0iiir

The Future Mortality of High
Mortality Countries: A Model
Incorporating Expert Arguments
Garbero, A., Pamuk, E., Garenne, M., Masquelier, B.
and Pelletier, F.
IIASA Interim Report
October 2013
Garbero, A., Pamuk, E., Garenne, M., Masquelier, B. and Pelletier, F. (2013) The Future Mortality of High Mortality
Countries: A Model Incorporating Expert Arguments. IIASA Interim Report . IIASA, Laxenburg, Austria, IR-13-017
Copyright 2013 by the author(s). http://pure.iiasa.ac.at/10743/
Interim Report on work of the International Institute for Applied Systems Analysis receive only limited review. Views or
opinions expressed herein do not necessarily represent those of the Institute, its National Member Organizations, or other
organizations supporting the work. All rights reserved. Permission to make digital or hard copies of all or part of this work
for personal or classroom use is granted without fee provided that copies are not made or distributed for profit or commercial
advantage. All copies must bear this notice and the full citation on the first page. For other purposes, to republish, to post on
servers or to redistribute to lists, permission must be sought by contacting
International Institute for
Tel: +43 2236 807 342
Applied Systems Analysis
Fax: +43 2236 71313
E-mail: [email protected]
A-2361 Laxenburg, Austria
Web: www.iiasa.ac.at
Interim Report
IR-13-017
The Future Mortality of High Mortality Countries: A Model
Incorporating Expert Arguments
Alessandra Garbero ([email protected])
Elsie Pamuk ([email protected])
Contributing authors:
Michel Garenne, Bruno Masquelier, François Pelletier
Approved by
Wolfgang Lutz ([email protected]) Leader, World Population Program
October 22, 2013
Interim Reports on work of the International Institute for Applied Systems Analysis receive only
limited review. Views or opinions expressed herein do not necessarily represent those of the
Institute, its National Member Organizations, or other organizations supporting the work.
International Institute for Applied Systems Analysis
Registration number: ZVR 524808900
Contents
Abstract
This paper examines the future of mortality in the 65 countries still experiencing high mortality in 2010, as defined by a cutoff of 40 deaths before age five per thousand live births. Mortality declines in several countries stagnated or reversed in the last two decades of the twentieth century due mainly to HIV/AIDS. The forces underlying past mortality trends and affecting the future course of mortality are examined by reviewing the existing literature and reporting the results of the global survey and invited meeting, both involving mortality experts. The experts assessed the likelihood and weight of forces hypothesized to influence mortality. A statistical model is combined with these expert assessments to produce a set of mortality assumptions that are incorporated into the projections reported in this paper. This paper also addresses the limited availability of reliable data on age-specific mortality rates.
The authors are grateful to Patrick Gerland and the paper's editors for helpful discussions and insightful comments. This research was made possible by an ERC (European Research Council) Advanced Grant "Forecasting societies' adaptive capacities to climate change", Grant Agreement No. ERC-2008-AdG 230195-FutureSoc.
About the Authors
Alessandra Garbero is an econometrician at International Fund for Agricultural Development (IFAD).
Elsie Pamuk was a senior health researcher at the U.S. Centers for Disease Control and Prevention from 1989 through 2011 and a visiting research scholar at the International Institute for Applied Systems Analysis from 2009 through 2012.
The contributing authors have drafted considerable parts of Section 4. They were selected as lead experts in respective topics and regions. Specifically, they have provided texts to the following sections: Michel Garenne contributed to Section 4.4 ("Behavioral changes related to health"), 4.5 ("Other infectious diseases"), and short paragraphs in Sections 4.1 ("Mortality due to crisis"), 4.7 ("HIV and AIDS"), and 4.8 ("Differential trends of population subgroups"); Bruno Masquelier provided child mortality data and contributed to Section 3 ("Adult mortality"); François Pelletier 4.1 ("Mortality due to crisis"), and 4.7 ("HIV and AIDS"). The views and opinions expressed by Garenne are those of the author and do not necessarily represent those of the United Nations. This paper has not been formally edited or cleared by the United Nations.
The Future Mortality of High Mortality Countries: An Expert Based
Model of Mortality
Alessandra Garbero Elsie Pamuk
1 Introduction
The theory and empirical basis of the demographic transition includes the important role played by mortality declines in generating a societal shift from high mortality and high fertility to low mortality and low fertility. In particular, it is the improved survival of children into adulthood that initially produces increasingly large populations with a very young age structure. Because the level of childhood mortality is strongly linked to fertility levels (Angeles 2010; Becker & Barro 1988) and adult mortality rates, the definition of a high mortality country used in the Wittgenstein Centre for Demography and Global Human Capital (WIC) expert opinion survey reported in this paper is in terms of the level of childhood mortality, that is, the probability of death before age five (5q0 in the life table designation).
In accordance with recent practice at WHO and UNICEF in monitoring progress
toward the Millennium Development Goals (MDG), we use a cutoff point of 40 deaths per thousand live births before the age of five years to designate a country as having high mortality (Hill et al. 2012). In 2010, the under-five mortality rate exceeded 40 in one-third of the 193 member countries of United Nations, and in only one of these countries did life expectancy at birth exceed 70 years (Azerbaijan, e0 = 70.1) (United Nations 2011b). Despite its relatively low under-five mortality rate (estimated at 0.025 in 2011), Botswana is also considered here as a country with high mortality because its life expectancy is estimated at 53 years (United Nations, 2011). The geographic distribution of these countries is shown in Figure 1, while Table 1 lists all 65 high mortality countries, along with current estimates of life expectancy, child and adult mortality and the change in life expectancy between the periods 1995-2000 and 2000-2011.
Figure 1. Geographic distribution of high mortality countries discussed in this paper
Table 1. Countries with high mortality
Selection criterion = 5q0>40/1000
Life Expectancy (e0)
Under- Five
mortality
(both sexes)
(5q0) per
1000 live
(both sexes)
UN – WPP 2010
2005-2010
gain in e0
(2005-10 -
Africa – Eastern
United Republic of Tanzania
Selection criterion = 5q0>40/1000
Life Expectancy (e0)
Under- Five
mortality
(both sexes)
(5q0) per
1000 live
(both sexes)
Africa - Middle & Northern
Central African Republic
Democratic Republic of the Congo
Equatorial Guinea
Sao Tome and Principe
Africa – Southern
Africa – Western
Selection criterion = 5q0>40/1000
Life Expectancy (e0)
Under- Five
mortality
(both sexes)
(5q0) per
1000 live
(both sexes)
Asia – Southern
Asia - South-East
Lao People's Democratic Republic
Asia -Central & Western
Latin America
Bolivia (Plurinational State of)
Papua New Guinea
Micronesia (Fed. States of)
As shown, high mortality countries include all of sub-Saharan Africa except the
island nations of Cape Verde, Mauritius, Mayotte and Reunion. Most of South Asia meets the criterion of high mortality, including the populous countries of India, Pakistan and Bangladesh.
1.1 Past Trends and Current Levels
Many demographers have, over the last 50 years, predicted a general convergence worldwide toward low mortality and fertility resulting in higher levels of life expectancy. The presumption of global convergence in mortality was based on analyses of mortality data, primarily from developed countries, starting from the 1960s (McMichael et al. 2004). These data revealed the occurrence of a common pattern, named the "epidemiological transition" (Omran 1971), broadly indicating not only that declines in death rates from infectious diseases (affecting mainly children and younger adults ) cause increases in life expectancy, but also leave the remaining mortality as primarily due to non-communicable diseases, largely occurring in old-age. The apparent pervasiveness of this pattern gave some expectation of a rapid decline of mortality in high mortality countries, while countries that had already achieved a relatively low level of mortality would find future increases in life expectancy harder to achieve.
However, the idea of a global convergence in mortality has been challenged by
the occurrence of mortality reversals during the last two decades. These reversals took place in countries that experienced conflict (i.e. Rwanda, Angola, Sierra Leone, Liberia, and Somalia), failure of health systems (i.e. Kazakhstan and Zimbabwe), or HIV and AIDS epidemics (Reniers et al. 2011). In 2004, HIV and AIDS was the fourth leading cause of death in low income countries, followed by deaths from lower respiratory infections, ischemic heart disease, and diarrheal diseases (Mathers et al. 2008). Increases in malaria and tuberculosis have also been partly responsible for mortality trend reversals in the last two decades, in sub-Saharan Africa and in other regions.
In addition, progress toward reducing infant and child mortality has stagnated or
slowed in many countries, due not only to HIV/AIDS and conflicts, but also because of increases in malaria-related mortality and stalls in immunization rates in the 1990s. Other factors contributing to this divergent trend are the growing burden of injuries and non-communicable diseases, as well as health risks due to environmental changes, induced or not by human pressures. Often, several factors combine to adversely affect mortality trends. For example, life expectancy has been severely affected in Haiti (Farmer et al. 2003) as a consequence of aid restrictions in a context of widespread poverty and a failed health system.
A serious problem in estimating past trends and projecting the future course of
life expectancy in high mortality countries is the lack of reliable data on age-specific mortality rates, particularly for adults. Among the 65 countries considered here, only Azerbaijan, Turkmenistan, Uzbekistan and São Tomé and Príncipe have vital registration systems covering at least 90 percent of deaths. The coverage of death registration in South Africa hovers around 85 percent, and until recently, vital registration data could be used in Zimbabwe as well (Feeney 2001). In other countries, either the coverage is far too low for estimating mortality or vital statistics are not compiled and transferred to national statistical offices (Mathers et al. 2005). Because of this lack of registration-type data, trends in child mortality are generally obtained from direct or indirect methods making use of mothers' reports on the survival of their children, as collected in censuses and large-scale surveys (DHS, MICS, etc.). For adult
1 Source: United Nations Statistics Division (n.d), Coverage of Birth and Death Registration, retrieved November 7, 2012 from http://unstats.un.org/unsd/demographic/CRVS/CR_coverage.htm
mortality, no equivalent approach has proved entirely satisfactory (Hill et al. 2005). Converting the cohort attrition between two census age distributions into measures of adult mortality poses several difficulties, mainly due to age misreporting, differences in the completeness of the censuses, and migrations (Preston 1983). Several death distribution methods have been designed to evaluate and to potentially adjust [upwards] mortality rates computed from recent household deaths or incomplete vital registration (Hill 1987), but these methods are hard to apply when net migration is substantial and they are based on rather stringent assumptions (such as a constant underreporting of deaths over a certain age limit). A third series of methods makes use of survey and census reports on the survival status of close relatives, that is, first spouses, siblings or parents (Hill & Trussell 1977; Hill 1987). The rare studies that exploited data on the survival of first spouses were not very encouraging (Makinson 1993; Timaeus 1987), and the method has since fallen into disuse. Probabilities of dying inferred from data on orphanhood also tend to underestimate adult mortality and they can be heavily distorted by HIV-related biases. By contrast, the data on the survival of siblings that have been collected in more than a hundred Demographic and Health Surveys (DHS) are emerging as a major source of estimates of adult mortality in developing countries. The main advantage of sibling survival data is that they provide occurrence/exposure-type mortality rates when full sibling histories are collected from adult household members. Limited modeling is required to derive age- and period-specific mortality rates (Timaeus & Jasseh 2004), yet substantial biases can affect these retrospective data as well (Helleringer et al. 2013; Masquelier 2013).
Against this backdrop of paucity and poor quality of data on mortality, the next
section describes what is known about trends in child and adult mortality in high mortality countries, using the best data available, for the 65 countries classified as having high mortality in 2010.
2 Child Mortality: Current Levels and Past Trends
An advantage of using early childhood mortality as the defining criterion for designating a country as having high mortality is that considerable effort is being made by the United Nations Inter-agency Group for Child Mortality Estimation (IGME) to form the most reliable estimates for every country in the world. The IGME collects and assesses the quality of all available data, then uses acceptable data and recognized statistical methods to form time series estimates of mortality before the age of five. New estimates for countries and world regions through 2011 have recently been made available (Hill et al. 2012), and provide the basis for the description of current levels and past trends contained in the following section.
Since 1990, the global under-five mortality rate has dropped by 41 percent—
from 87 deaths per 1,000 live births in 1990 to 51 in 2011 (UNICEF 2012). In the majority of countries including many developing countries, the under-five mortality rate has been cut in half in the past two decades. At the same time, however, the disparity between areas where child mortality remains high and the rest of the world has increased. As shown in Figure 2, child mortality is increasingly concentrated in sub-Saharan Africa and South Asia; over 80 percent of child deaths in 2011 occurred in these two regions. Yet even within this group of high mortality countries, the level of child mortality varies considerably. The under-five mortality rate in Sierra Leone, the country with the highest rate in 2011, was four and a half times greater than the rates for
Micronesia, Lao PDR and Namibia, and 7 times greater than that for Botswana (Table 1).
The difficulty involved in making accurate projections of future trends in life
expectancy for countries with high levels of mortality is illustrated by examining the trends in child mortality within these countries over the past three decades, time periods for which reasonably reliable estimates of child mortality levels have been made (You et al. 2011)
Figure 2 to Figure 7 show the trends in the under-five mortality rate for countries
separated by region. For regions with many high mortality countries, the overall trend and distribution is indicated by a series of boxplots accompanied by examples of different country-specific trends to indicate the range of variation in the patterns. The countries shown in the right-hand panel are those with the greatest and slowest rate of change between 1980 and 2011, those with the highest and lowest mortality rates in 2011, and examples of atypical trends.
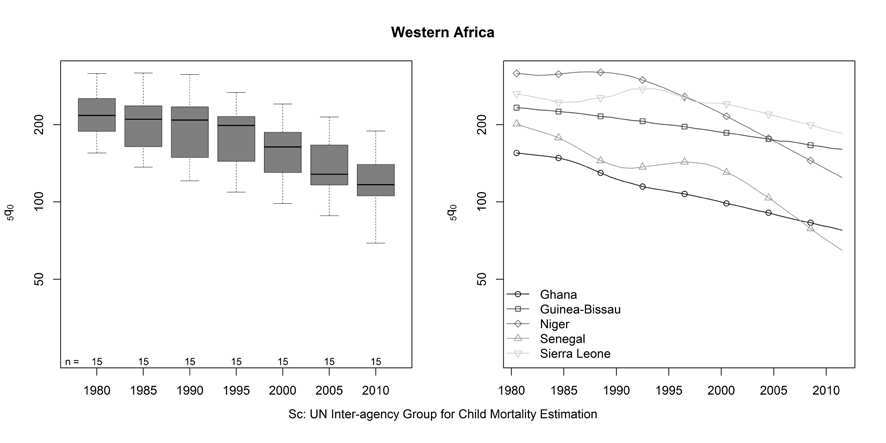
In 1980 the fifteen countries of Western Africa experienced very high child
mortality, averaging 226 (deaths to children less than 5 years of age for every 1000 live births) and ranging from a high of 317 in Niger to a low of 155 in Ghana (Figure 2). Over the next 3 decades, the rate of child mortality declined in every country, but the amount of decline varied from 67-68 percent in Liberia and Senegal to just 29-30 percent in Mauritania and Sierra Leone. For many Western African countries, the declines in child mortality have been steady, albeit at different rates, as typified by Ghana and Guinea-Bissau (Figure 2 – right panel). However, for Sierra Leone, Niger, Liberia and Nigeria, little or no progress was made between 1980 and the mid- to late- 1990s, followed by much more rapid declines in the last decade. By 2011, the average child mortality rate for these countries was 120 and ranged from 185 in Sierra Leone to 65 in Senegal, but the variation in the pattern and pace of decline produced a quite different ranking of countries by level of child mortality in 2011 compared with 1980.
Figure 2. Trends in the under-five mortality rate, Western Africa.
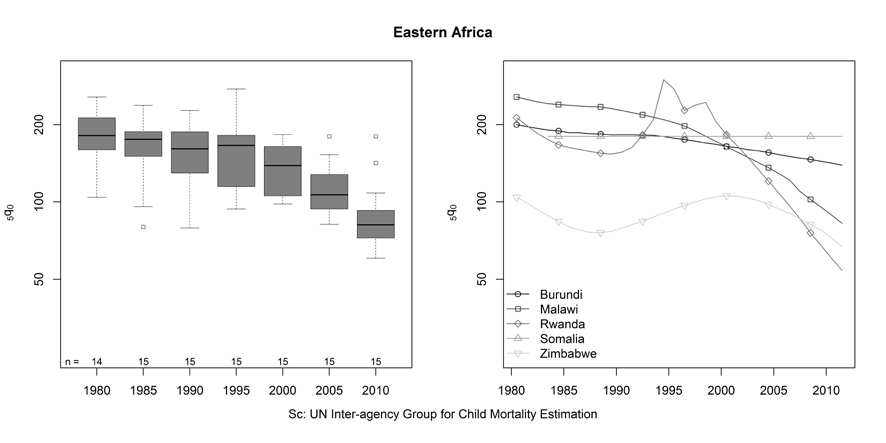
Figure 3 shows a generally similar overall pattern for the 15 countries of Eastern
Africa. In 1980 child mortality in these countries averaged 182 and ranged from 256 in Malawi to a low of 104 in Zimbabwe. By 2011 child mortality had declined by an average of 52 percent to 88. However, the variation in the pace of decline across these 15 countries was even more striking than in Western Africa. Estimates of declines ranged from 75 percent in Rwanda to only 30 percent in Burundi and to no change in Somalia. In most countries of Eastern Africa, the pace of decline in child mortality was slow or non-existent until the mid- to late-1990s (Figure 3). The recent declines have tended to be more rapid in countries where child mortality was higher initially, resulting in less variation across the region in 2011 than in 1980-2000. By 2011 all but 3 of the Eastern African countries had estimated child mortality rates between 54 and 90.
Figure 3. Trends in the under-five mortality rate, Eastern Africa.
Overall, the 11 countries of Middle and Northern Africa have seen less progress
in reducing child mortality (Figure 4). In 1980 the average child mortality rate was 186, ranging from 286 in Angola to 96 in São Tomé and Príncipe. By 2011 the average had fallen to 124, a decline of just 33 percent. The greatest decline was estimated to have occurred in South Sudan (56 percent), while only minimal declines were seen for the Central African Republic (7 percent) and São Tomé and Príncipe (8 percent). Although declines tended to be more substantial for countries with higher child mortality in 1980, such as Angola and South Sudan, the reduction in variation was not as great as that seen in Eastern Africa. In 2011, under-5 mortality rates ranged from 66 in Gabon to 166 in the Democratic Republic of Congo.
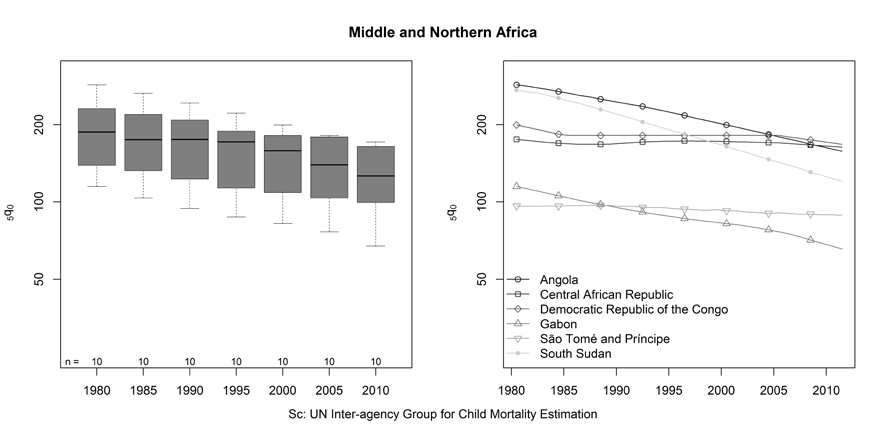
Figure 4. Trends in the under-five mortality rate, Middle and Northern Africa.
It is in Southern Africa that the impact of the AIDS epidemic on child mortality
trends is the most obvious (Figure 5). In 1980, child mortality was already lower in this region compared to the rest of sub-Saharan Africa, averaging 100 deaths per 1000 live births and ranging only between 121 in Lesotho to 78 in Botswana. In addition, child mortality continued to decline between 1980 and 1990 in all 5 countries, but by 2000 these gains had been completely reversed in Botswana, Lesotho and Swaziland and nearly reversed in South Africa and Namibia. Child mortality has started to fall again in the last decade, and at a more rapid rate in the countries that already had lower child mortality (Botswana, Namibia and South Africa). As a result, variation in child mortality across these 5 countries was substantially greater in 2011 than at any previous time; ranging from 26 in Botswana to 104 in Swaziland.
Figure 5. Trends in the under-five mortality rate, Southern Africa.
In general, declines in child mortality were much larger and more consistent in
the high mortality countries in Asia. The 5 high mortality countries of Central and Western Asia have each seen their child mortality rates decline by between 49 and 61 percent since 1980 (Figure 6). The declines in child mortality in Southern Asia have been even greater, averaging 67% since 1980. However, it is notable that child mortality declined less in India and Pakistan, the countries with the lowest levels in 1980, than in all other countries in the region. By 2011, Afghanistan was the only country in South Asia with higher child mortality than in India and Pakistan. Progress has been even more striking in the remaining high mortality countries of Southeastern Asia (Figure 7). Since 1982, the child mortality rate has been reduced by 77 percent in Lao PDR and Timor-Leste and by 72 percent in Cambodia, despite the period of stagnation between 1985 and 1998. Even in Myanmar, the child mortality rate is estimated to have fallen by over 50 percent since 1982.
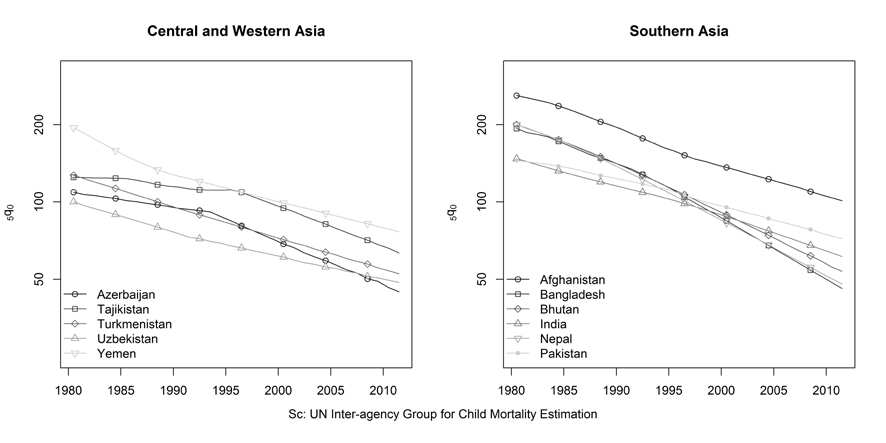
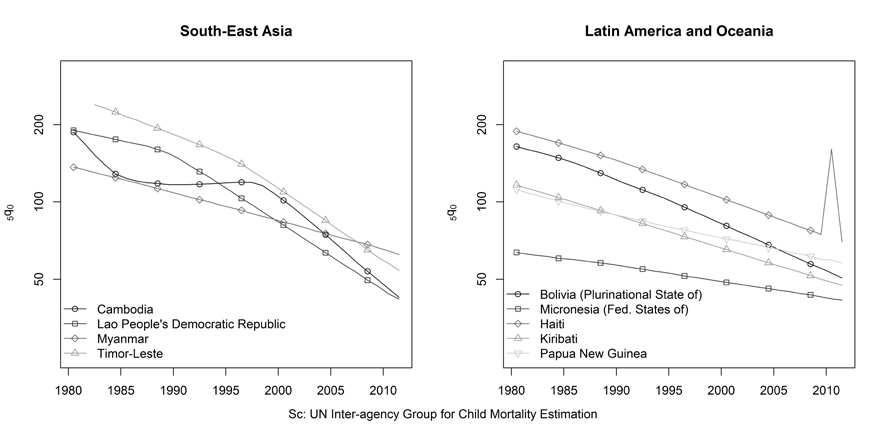
Figure 6. Trends in the under-five mortality rate, Central, Western and Southern Asia.
Figure 7. Trends in the under-five mortality rate, South-East Asia, Latin America and Oceania.
The remaining ‘high' mortality countries are divided between Latin American
and Oceania (Figure 7). The two Latin American countries, Bolivia and Haiti, have seen child mortality decline by more than 60 percent since 1980, despite the 2010 earthquake in Haiti. Declines in childhood mortality have been less steep in the three island nations of Oceania. The disparity across the ‘high' mortality countries in these 30 year trends in child mortality reinforces the difficulty of making predictions about the future course of life expectancy without linking these predictions to the forces determining the progress – or lack thereof – in combatting the underlying determinants of both child and adult mortality peculiar to each of these countries. The direct causes of childhood death in high mortality countries are predominately pneumonia, diarrhea, malaria, pre-term birth and complications during birth. But since these direct causes are amenable to both treatment and prevention, we need to look further to assess the prospects for future trends. The UN has estimated that over one-third of deaths to children under the age of
five can be attributed to undernutrition (UNICEF 2012). Many underlying forces in turn affect the extent to which a country can provide adequate nutrition and basic health services for its children.
What is clear from an examination of the most recent decadal changes in child
mortality in all high mortality countries is that rapid improvement can be achieved, even under less than ideal circumstances. Between 2000 and 2011, the IGME estimates that the child mortality rate declined by 30 percent or more in 29 of the 66 high mortality countries and by 50 percent or more in 6 (Rwanda, Botswana, Cambodia, Liberia, Timor-Leste and Senegal). Over the same period however, child mortality declined by less than 10 percent in many countries with some of the highest child mortality levels: Somalia, São Tomé and Príncipe, Central African Republic, Mauritania, Congo DR, Congo, Cameroon and Swaziland.
Adding to the challenges of predicting future trends in child mortality is the
uncertainty regarding past trends and current levels. Although the methods employed by the IGME have generated far better estimates than previously available, continual improvement in both data and methods is anticipated. Each improvement results in changes to the existing ‘best available' estimates, as shown by a comparison of 2010 and 2011 IGME estimates for high mortality countries. Still, our knowledge of levels and trends in child mortality for high mortality countries with inadequate death registration greatly exceeds that for adult mortality in these same countries, as shown in the following section.
3 Adult Mortality
3.1 Adult Mortality in sub-Saharan Africa
African nations are experiencing the heaviest burden of adult mortality worldwide. In the period 2005-2010, all countries in which the life expectancy at age 15 was lower than 50 years were located in sub-Saharan Africa, with the notable exception of Afghanistan (United Nations 2011b). This summary measure of adult mortality varied from 38 years in Zimbabwe to 56 years in Madagascar. Its average value, estimated at 48 years, remained almost 10 years below the corresponding value for South-Eastern Asia (57). In addition, whereas the life expectancy at age 15 increased by about five years in the last 25 years in South-Eastern Asia, it has remained virtually unchanged in sub-Saharan Africa. Only a handful of countries have benefited from substantial improvements in adult survival (Eritrea, Ethiopia, and Madagascar), whereas life expectancy in adults aged 15 years and over has declined since the 1980s in about 20 countries.
A detailed account of trends in adult mortality in the region remains elusive
because of the lack of reliable and comprehensive data sources. As mentioned earlier, the partial absence of comprehensive registration systems forces demographers to resort to indirect and unconventional techniques: intercensal survival methods, death distribution methods, and approaches based on orphanhood or sibling data. However, the resulting estimates are often discrepant and refer only to a few points in time. In
addition, the development of these techniques often predates the emergence of AIDS as a major cause of death. The epidemic has since introduced serious breaches in many of assumptions underpinning these techniques. For most African countries, the Population Division of the United Nations (UNPD) thus resorts to the long-standing tradition of combining child mortality rates with model mortality schedules, and making ad-hoc adjustments for HIV/AIDS (Masquelier et al. 2013). First, a complete life table that pertains to the population not infected by HIV (also referred to as the background mortality) is estimated. Then, for countries where HIV prevalence ever exceeded two percent, estimates of background mortality are supplemented by AIDS deaths calculated via an epidemiological multi-state model. This model is analogous to the Spectrum model used by UNAIDS (Stover et al. 2010; Stover et al. 2008). The resulting estimates of overall mortality are then compared to existing empirical data. When important discrepancies with model outputs are apparent, the background mortality is revised and the procedure is repeated until a reasonable agreement is achieved (United Nations 2005). Likewise, the WHO employs estimates of AIDS deaths from UNAIDS and adds them to the background mortality rates derived from child mortality estimates and a modified Brass logit model (Murray et al. 2003). Recently, the Institute for Health Metrics and Evaluation (IHME) has also produced its own set of mortality estimates for the Global Burden of Disease 2010 Study (Rajaratnam et al. 2010). The calculation of age and sex-specific mortality rates was performed in three steps (Wang et al. 2012). First, empirical measurements of the probabilities of dying in childhood (5q0) and between ages 15 and 60 (45q15) were extracted from survey, census and vital registration data, and adjusted for various biases. Second, trends in these two summary indices were fitted through a method known as Gaussian process regression (GPR), with a series of covariates including education and lagged distributed income. Third, a complete life table was derived from fitted trends in 5q0 and 45q15 by using yet another relational life table system. Some important differences with the methods used by the UNPD or the WHO are the use of covariates and the reliance on survey data on the survival of siblings, which often provide lower levels of adult mortality, as will be shown below.
The UNPD mortality rates are probably the most reliable estimates to date,
mainly because they are subject to a careful comparison with other existing data and they are obtained by ensuring consistency with other components of the demographic dynamic (fertility and migration). That said, they are underpinned by a complex modeling of the HIV epidemic that involves several parameters known to have large uncertainties, such as the HIV incidence by age and sex, or, more recently, the coverage of antiretroviral therapies. In addition, in a majority of high mortality countries, trends in the non-aids mortality are inferred from child mortality, which can be misleading if adult and child mortality have not evolved in concert.
Data on sibling survival collected in DHS provide useful counterpoints to these
estimates. Masquelier et al. (2013) compared the probability of dying between the ages 15 and 60 (45q15) from the 2010 Revision of the World Population prospects (WPP) and sibling survival data for sub-Saharan Africa. We summarize here their main observations and present a brief overview of mortality trends in the following plots, applying their estimation method also to DHS conducted outside of sub-Saharan Africa.
The boxplot idisplays the probability of a male dying between ages
15 and 60 (45q15) in 18 countries located in Western and Middle Africa (plus North
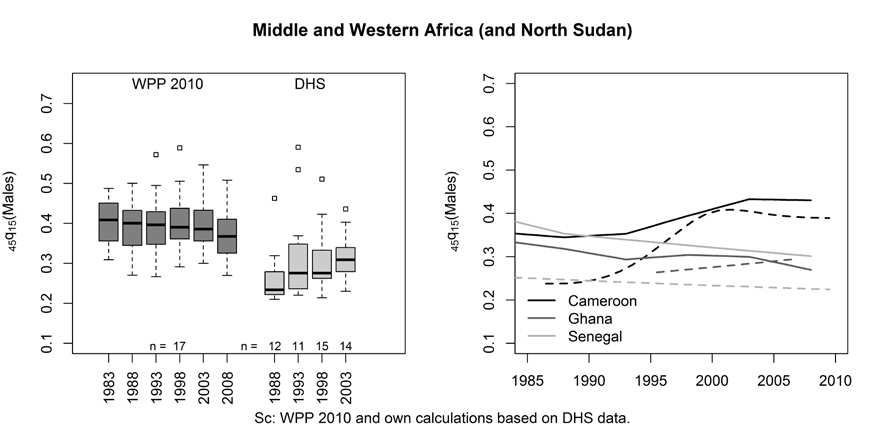
Sudan), in which at least one set of sibling survival data was collected in the DHS. Trends from the 2010 Revision of the WPP (United Nations 2011b) are presented alongside estimates derived from DHS. Sibling estimates largely fare as lower bound estimates. The right-hand side of Figure 8 singles out some countries and compares WPP estimates (solid lines) with DHS estimates (dashed lines). In Senegal, for example, the male probability 45q15 for 2004 is about 35 percent higher in the WPP than in the DHS. Large discrepancies are also found in Cameroon prior to 2000, while there is a better agreement in Ghana.
Figure 8. Trends in the probability of male dying between ages 15 and 60 in 18 countries in Middle, Western Africa and North Sudan, from the 2010 Revision of the World Population Prospects and DHS sibling histories.
Estimates in Eastern and Southern Africa can be quite discrepant as well, as
illustrated with Malawi, for which sibling-based estimates are lower in the pre-AIDS period, but higher in recent years. Reniers et al. (2011) already noted that discrepancies between WPP and DHS estimates are larger in settings with small HIV prevalence, especially in the Sahelian countries. They speculated about the reasons for this and suggested that recall errors could be more pervasive in surveys conducted in Western Africa because of greater complexity of family structures (due to higher fertility rates and polygyny). Another explanation is that sibling histories underestimate mortality irrespective of the region, but this is obfuscated in countries affected by HIV/AIDS. This could be the case if WPP estimates were themselves too low in these countries, potentially because of recent downward revisions of HIV prevalence (Reniers & Eaton 2009). However, this explanation needs to be supported by further investigations.
2 North Sudan is the only country from Northern Africa covered by sibling data (apart from Morocco, not included here), because South Sudan was not covered in the 1989-90 DHS. The 2010 WPP estimates refer to the former Sudan. Estimates for Rwanda in 1993 or 1998 are not included in the graphs due to the extremely high mortality levels related to the genocide. DHS estimates for Middle and Western Africa are only presented up to 2003 because few countries have conducted a DHS with sibling histories after 2008.
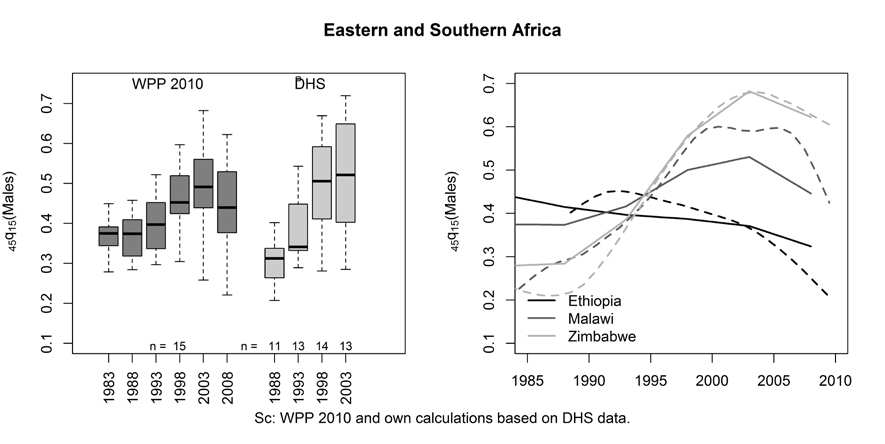
Figure 9. Trends in the probability of male dying between ages 15 and 60 in 15 countries in Eastern and Southern Africa, from the 2010 Revision of the World Population Prospects and DHS sibling histories.
Despite these methodological issues, some common trends can be isolated from
both sourcesa. In Middle and Western Africa, adult mortality mostly stagnated at relatively high levels. Increases in mortality have also occurred since 1985 in a few countries, either because of high HIV prevalence (in the case of Cameroon and Côte d'Ivoire) or civil unrest (Democratic Republic of the Congo). According to the DHS, the post-civil war period in Congo-Brazzaville is the only case in this region where adult mortality declined sharply during the 1990s.
In Eastern and Southern Africa, with the exceptions of Ethiopia, Madagascar
and Burundi (in the period post-2000), all countries covered by DHS sibling histories have experienced mortality increases. These have been the largest in Lesotho, Malawi, Namibia, Rwanda (during the genocide), Swaziland, Uganda, Zambia and Zimbabwe. In several cases, however, mortality rates have peaked and seem to be declining. Some of these peaks occurred before the rapid scale-up of ART programs (Zimbabwe, Zambia, Tanzania, Uganda). In Southern Africa, adult mortality levels are still on the rise in Lesotho, Namibia and Swaziland.
Standard DHS do not collect information on causes of deaths, apart from
questions aimed at identifying pregnancy-related causes. Information on the underlying structure of causes of death thus come either from (1) hospital records, (2) death registration for specific areas, such as in South Africa and some urban centers (Waltisperger & Meslé 2005), or (3) Health and Demographic Surveillance sites (HDSS). The latter refer to geographically localized populations in which a recurrent collection of demographic events (eg. every four months) is organized. More than 20 sites exist in Africa (many are part of the INDEPTH Network) and cover populations ranging from 50,000 to 200,000 (Network 2005). Information on causes of death come from "verbal autopsies" conducted with caregivers and relatives of the deceased. Adjuik et al. (2006) reviewed these data and concluded that infectious diseases remain the leading causes of death among adults aged 15 and older in African HDSS. This is
predominantly due to AIDS (causing as much as 53 percent of adult deaths in ACDIS, KwaZulu-Natal), tuberculosis (ranging from two percent of deaths in Nouna, Burkina Faso, to 19 percent in Butajira, Ethiopia), and malaria (causing about a quarter of adult deaths in Niakhar, Senegal). Evidence is also accumulating that sub-Saharan Africa is facing an epidemic of non-communicable diseases (Dalal et al. 2011), including cardiovascular disease, cancer and metabolic diseases. Rather than the expected transition from communicable diseases to non-communicable diseases, the sub-continent thus faces a double burden.
3.2 Adult Mortality in Asia
The measurement of adult mortality has also proven to be difficult in Asia. Mortality data simply did not exist in most Asian countries until the mid to late 20th century (Zhao 2011). Data from only 11 Asian populations contributed to the development of the United Nations Model Life Tables for Developing Countries in the early 1980s (United Nations 1982). Since then, the frequency of censuses increased but Asia is still lagging behind in terms of data quality. Demographic and health surveys have also played an important role and managed to fill some of the data gaps. In addition, as in the African region, the UNPD and the WHO have made considerable efforts to evaluate and adjust available data and correct for underreporting and enumeration errors.
The first three plots in, b present adult mortality estimates for males
in Asian countries that fall within our classification criterion. These are based on estimates from the World Population Prospects (solid lines). The corresponding regions are Southern Asia, South East Asia, and a few countries in Central and Western Asia. For countries in these regions, the estimates of the probability 45q15 in the WPP are only available for the period 1995-2010. Data on sibling survival have only been collected in Afghanistan, Nepal, Bangladesh, Cambodia and Timor-Leste. The corresponding estimates appear with dashed lines.
3 Estimates are available from 1980 onwards for countries for which an explicit modeling of HIV/AIDS is made by the UNPD, as is the case in most African countries.
Figure 10a, b. Trends in the probability of male dying between ages 15 and 60, by region, from the 2010 Revision of the World Population Prospects and DHS sibling histories.
A number of countries, mostly in the Southern and Central region, have
experienced either a slow decline or no remarkable change in the level of adult mortality in the period 1990-2005, as portrayed by these most recent estimates by the UN. Such countries are Afghanistan, Pakistan, India, Turkmenistan, and Uzbekistan. Afghanistan is the country where life expectancy was estimated at 47 years in 2005-2010 according to the 2010 Revision of the World Population Prospects, faring as the lowest life expectancy at birth in Asia (United Nations 2011b). But there are large uncertainties around these mortality estimates. In the recently released 2012 Revision of the WPP, mortality rates for Afghanistan have been revised downwards, with life expectancy reaching 58 years in 2005-2010. This revision was based on the 2010 Afghanistan Mortality Survey (AMS), in which low levels of child and adult mortality were reported. For example, the trend in adult mortality inferred from sibling data collected in this survey are presented in Figure 10a, b. These estimates should not be taken at face value, however, as several indicators point to poor data quality, such as very high sex
ratios of reported siblings and a large fraction of deaths reported as having occurred exactly 10 years prior to the survey. In addition, approximately 13 percent of the population was not surveyed because of security or other issues.
In order to shed light on the heterogeneous cause-of-death structure that is
characteristic of Asia, the percent distribution of adult deaths by cause is displayed in Figure 11 tfor both sexes, based on the 2008 WHO estimates of deaths due to diseases and injury (World Health Organization 2011). Adult deaths (15-59) were disaggregated by cause according to the major ICD-10 groupings (World Health Organization 1992) i.e. communicable, non-communicable, and injury deaths. Deaths from "infectious and parasitic diseases" were extracted from communicable diseases to understand their role in the countries under study. HIV and AIDS, and tuberculosis-related deaths were also isolated from the subgroup "infectious and parasitic diseases" to show their weight in the countries under study.
In general in high mortality Asian countries, factors that have contributed to
these high adult mortality trends are wars, social unrest, the collapse of the USSR, the spread of HIV and AIDS and, to a certain extent, a low level of socio-economic development.
In Southern Asia (Figure 11), although these countries are still in the later stage
of the epidemiological transition, the high levels of adult mortality can be attributed to non-communicable diseases, although communicable diseases as a whole (including infectious and parasitic diseases) still account for a large share.
Communicable diseases
Infectious and parasitic
diseases exc. HIV/TB
Noncommunicable diseases
Figure 11. Distribution of adult deaths by major cause (%), Southern Asia
Authors'own calculations based on WHO 2011 data.
In South-East Asia (Figure 12), communicable diseases -- particularly infectious and parasitic diseases – prevail, with Timor-Leste and Cambodia showing a large burden
due to HIV and TB-related adult deaths. Cambodia and Lao People's Democratic Republic also exhibit a large share of adult deaths due to non-communicable diseases. A significant burden from injury deaths is present in Myanmar.
Communicable diseases
Infectious and parasiticdiseases exc. HIV/TB
Lao People's Democratic
Noncommunicable diseases
Figure 12. Distribution of adult deaths by major cause (%), South-East Asia
Authors' own calculations based on WHO 2011 data.
In Central and Western Asi, adult deaths from non-communicable
diseases represent the major killer, according to WHO estimates. Countries that belong to this group are Azerbaijan, Tajikistan, Turkmenistan, Uzbekistan and Yemen. HIV and AIDS, and TB-related deaths occupy the largest share in Tajikistan.
Communicable diseases
Infectious and parasitic
diseases exc. HIV/TB
Noncommunicable diseases
Figure 13. Distribution of adult deaths by major cause (%), Central and Western Asia
Authors'own calculations based on WHO 2011 data.
3.3 Adult Mortality in Other Countries: Latin America and Oceania
Two Latin American countries, Bolivia and Haiti, fall within our classification criteria ). UN estimates of adult mortality for Bolivia indicate a downward trend while siblings estimates are substantially lower.
In Bolivia, the burden of adult deaths can be largely attributed to non-
communicable and injury deaths, which seem to predominate. In Haiti, social conditions deteriorated in recent years due to failure of the state and the lack of capacity to cope with the existing humanitarian crisis, generated by the aid embargo and coupled by the health care system failure The WHO data portrays a large share of adult deaths due to infectious and parasitic diseases.
Turning to the selected countries in the Oceanian region, i.e. Micronesia and
Papua New Guinea (Figure 10b), UN adult mortality estimates present a stalled trend for Micronesia; UN estimates for Papua New Guinea, indicate a downward trend instead. In the latter country, the breakdown by cause of death (Figure 14) shows that communicable diseases,particularly infectious disease including HIV and TB, account for a large share of the estimates, followed by non-communicable diseases. The burden of non-communicable diseases is instead predominant in Micronesia.
Communicable diseases
Infectious and parasiticdiseases exc. HIV/TB
Noncommunicable diseases
Figure 14. Distribution of adult deaths by major cause (%), for selected countries in Latin America and Oceania.
Authors'own calculations based on WHO 2011 data.
Table 2. Probabilities of dying between ages 5 and 60, disaggregated by sex, from the 2010 Revision of the World Population Prospects and estimates based on siblings histories collected in DHS.
Central and Western Asia
Azerbaijan
Tajikistan
Uzbekistan
South-East Asia
Cambodia
Timor-Leste
Southern Asia
Afghanistan
Bangladesh
Pakistan
Latin America
Kiribati
Micronesia
Papua New Guinea
Middle and Northern Africa
Cameroon
Central African
Republic
Equatorial Guinea
São Tomé and P.
Sudan (Former Sudan)
Western Africa
Burkina Faso
Côte d'Ivoire
Mauritania
Sierra Leone
Eastern Africa
Djibouti
Ethiopia
Madagascar
Mozambique
United Republic of 0.4
Tanzania
Zimbabwe
Southern Africa
Botswana
South Africa
Swaziland
Note: Estimates referring to DHS data are based on authors' computations.
4 Forces Affecting the Future of Mortality in High Mortality Countries
Over the past 50 years, mortality changes in high mortality countries have varied considerably, sometimes with major and rapid declines, sometimes with slow but regular declines, sometimes with stagnations, and occasionally with major increases. The determinants of these changes are complex, and can be studied at various levels. The following sections review the literature on forces affecting the future course of mortality, with particular reference to those aspects relevant to high mortality populations. In assessing the capability of specific forces to substantially affect future trends in child mortality, it is important to bear in mind that, as childhood mortality declines, infant mortality as a share of childhood mortality increases, especially mortality during the first month after birth. By 2010, half of all deaths under age five occurred to neonates in South Asia, and in sub-Saharan Africa the neonatal share of child mortality was 30 percent.
4.1 HIV and AIDS
The AIDS epidemic is considered the most important factor affecting survival prospects of adults and children in most of the high mortality countries. The future of HIV and AIDS rests primarily on hope for development of a preventive vaccine that is "safe, simple, highly effective and affordable" (Hemelaar et al. 2006: 2). However, the effectiveness of a global vaccine is threatened by the genetic and antigenic variability of
4 Portions of this section draw partly on publications of the United Nations, Department of Economic and Social Affairs, Population Division: World Mortality Report 2011 (2012) and World Population Prospects, The 2010 Revision: Highlights and Advance Tables (United Nations 2011c).
the virus (HIV-1). Impact of antiretroviral therapy and viral drug resistance are also important factors that could determine the future of the pandemic (Mahy et al. 2010). Beside the ABC strategy, which promotes abstinence, being faithful, and condom use and therefore safer behaviours the most effective intervention coming as close to a lifetime effective protection similar to a vaccine has been found to be circumcision (about 60% effectiveness based on randomized trials) (Auvert et al. 2005).
According to the most recent epidemic update by UNAIDS (2010), the overall
growth of the HIV epidemic seems to have stabilized: the annual number of new HIV infections has been declining since the 1990s. In addition, the number of AIDS deaths has also been decreasing, a consequence of the scale-up of antiretroviral treatment (ART), resulting in an increasing trend in prevalence (defined as all currently infected individuals). In sub-Saharan Africa, where the epidemic has been particularly severe, UNAIDS estimated the number of new infections in 2009 at 1.8 million, lower than the previous 2.2 million estimated for 2001. Five countries, Botswana, South Africa, Tanzania, Zambia and Zimbabwe, have shown a significant decline in new infections among young men and women according to national surveys, a decline largely attributed to changes in sexual behavior.
In a recent paper, Bongaarts et al.(2011), present trends in AIDS mortality from
1980 to 2030 using the UNPD estimates and projections. According to the authors, nearly all of the epidemics have reached their plateau, a consequence of both behavioral change and the natural course of the epidemic (i.e. saturation of high risk groups, as well as decline in the average infectiousness of individuals because fewer are in the post-infection state, or because of higher levels of ART).
According to UNAIDS, an estimated 33.3 million people in the world were
living with HIV in 2009 (UNAIDS 2010). In the 2010 Revision of the World Population Prospects, the demographic impact of the HIV/AIDS epidemic was explicitly taken into account when estimating and projecting mortality levels in 48 countries. Figure 15 shows the estimated and projected number of deaths due to AIDS for selected groups of countries or regions based on those 48 countries (values are per five-year period). These countries, together, account for a substantial portion of all AIDS-related deaths in the world, but the numbers shown here should not be taken as estimates for the world. For these countries as a whole and, particularly for the sub-Saharan countries, a sharp increase in number of AIDS-related deaths took place beginning in the mid-1980 and continuing to 2000. From that point on, the number of deaths plateaued at about nine million deaths per quinquennium, with a peak of 9.4 million for the period 2005-2010. During the projection period, the total number of deaths is expected to decline slightly and subsequently increase slowly to about 10 million in 2045-2050. This projected increase is driven partly by population growth, but also by some of the assumptions made regarding parameters of the epidemic simulation model, and the treatment coverage (see discussion below). Cohort effects are also at play. Out of the 48 countries for which the impact of HIV/AIDS epidemic was explicitly incorporated in the mortality estimates, 37 are in sub-Saharan Africa, three are in Asia (including both China and India), and eight pertain to other regions of the world. The vast majority of AIDS-related deaths occur in sub-Saharan Africa, and the share of AIDS-related deaths in that region is projected to rise from about 76 percent in 2010-2015 to about 90 percent in 2045-2050 (United Nations, 2012). In the three Asian countries, the number of AIDS-related deaths is expected to decline.
48 AIDS-Affected
countries
Sub-Saharan Africa (37)
Other regions (8)
Figure 15. Estimated and projected number of deaths due to AIDS by region, per quinquennium, 48 AIDS-affected countries, 1980-2050
Considering that some assumptions made about parameters of the epidemic
simulation model and the treatment coverage partly determine future trends, it is important to discuss some of these assumptions. As noted in the United Nations Mortality Report (2012, p.30)
Beginning in 2009, the parameter PHI, which reflects the rate of recruitment of new individuals into the high-risk or susceptible group, is projected to decline by half every twenty years. The parameter R, which represents the force of infection, is projected to decline by half every thirty years. The reduction in R reflects the assumption that changes in behavior among those subject to the risk of infection, along with increases in access to treatment for those living with HIV, will reduce the chances of HIV transmission.
Also, coverage levels of interventions to prevent transmission of HIV from
mother to child were projected in the 2010 Revision to reach, on average, 74 percent by 2015 among the affected countries, varying between 40 per cent and 95 percent. After 2015, the coverage is assumed to remain constant at the level reached in each of the affected countries in 2015. Furthermore, according to the UN report, "the 2010 Revision incorporates a revised survival for persons receiving treatment with highly active antiretroviral therapy. The proportion of the HIV-positive population receiving treatment averaged 64 percent in 2009 among the 48 affected countries" (United Nations 2012: 30). The proportion is projected to reach an average of 84 percent in 2015 while ranging between 40 percent and 99 percent at the country level. Coverage levels are assumed to remain constant thereafter. For further details regarding the assumptions, we refer readers to United Nations publications (2012; 2011b).
While looking at the same total number of AIDS-related deaths, this time broken
down by broad age groups (Figure 16), it can be said that AIDS mortality predominantly affects the "adult" population at ages 15-59. "Since the turn of the millennium, about 85 percent of all AIDS deaths in those 48 countries have occurred at ages 15-59 and that proportion is expected to only slightly increase by 2045-2050" (United Nations 2012: 31). As for children under the age of 15 who die from AIDS-related causes, a decline in both absolute and relative terms is anticipated in the following decades. When taking into account the recent achievements that were made with respect to the reduction in mother-to-child transmission of HIV, one could expect even sharper reductions in the number of AIDS-related deaths of children (United Nations, 2012).
s)
n 8,0
illio
M
eat
f d
o 4,0
er
b
m
u 2,0
Figure 16. Estimated and projected number of deaths due to AIDS by broad age groups, per quinquennium, 48 AIDS-affected countries, 1980-2050
Sources: (United Nations 2011b DEMOBASE extract (Special tabulations)) and (United Nations 2012) Note: The numbers of deaths due to AIDS are for five-year periods.
Based on the results of the estimates and projections for the group of countries
described above, it is quite evident that when doing mortality projections for countries affected by the HIV/AIDS epidemic, especially those with very high prevalence levels, one needs to adopt special procedures that take into account the current and future impact of HIV on mortality indicators. Clearly, the trajectories in the projected levels of life expectancy at birth, and other mortality indicators, should differ from those in non-affected or very low HIV prevalence countries. Furthermore, considering the differential impact across age groups, the age patterns of mortality should also encompass distinct shapes over time. Lastly, considering the timing of the onset of the epidemic and the phasing-in of treatment, there is a substantial cohort effect in the impact of HIV on
mortality levels and patterns. In that regard, special attention should be given to countries with prevalence levels above 10 per cent, mainly in Southern and Eastern Africa.
Again, based on the results of the 2010 Revision of the World Population
Prospects, and while measuring the mortality impact of the HIV/AIDS epidemic by comparing the mortality between the medium variant ("with AIDS") and the No-AIDS scenario ("without AIDS") in 2010-2015, researchers can get a sense of the impact of HIV/AIDS on specific mortality indicators. For instance, based on this comparison, AIDS more than doubled the probability of dying between ages 15 and 60 in seven countries, namely in Botswana, Lesotho, Malawi, Namibia, South Africa, Swaziland and Zimbabwe. AIDS can also significantly increase mortality among children, especially in the absence of treatment. For the period 2010-15, the largest absolute impact in child mortality was estimated to be in Swaziland, where excess under-five mortality due to AIDS amounted to 20 deaths per 1,000 live births. The highest relative impact (33 percent) occurred in South Africa, where the competing risks from other causes are lower than in Swaziland. In all countries of the Southern African region, the relative impact on under-five mortality exceeded 25 percent. Outside the sub-Saharan African region, most countries have experienced absolute impacts on under-five mortality of five deaths per thousand or less, while the relative impact has exceeded 10 percent in some countries with relatively low mortality (United Nations 2012).
Consequently, the increased mortality among adults and children may translate
into severe reductions in life expectancy at birth. The largest impact in 2010-2015 was found to be in Botswana, where life expectancy at birth was estimated to be 17 years lower in the medium variant than in the No-AIDS scenario. The loss in life expectancy due to AIDS was estimated to exceed 10 years in eight other countries, namely Lesotho, Malawi, Mozambique, Namibia, South Africa, Swaziland, Zambia and Zimbabwe, and was found to be between five and 10 years in seven other countries (Cameroun, Central Africa Republic, Côte d'Ivoire, Gabon, Kenya, Uganda, and the United Republic of Tanzania). The very high HIV prevalence levels encountered in Southern and Eastern African countries have not been found in other regions of the world, and thus the impact on life expectancy for other regions is lower (United Nations, 2012).
For the reasons outlined above, the WIC/IIASA argument-based probabilistic
population projections have adopted mortality forecasts where the medium scenario coincides with the UN/WPP 2010 medium variant up to 2050 for sub-Saharan Africa, Haiti, and Afghanistan. Details on the methodology can be found elsewhere (Garbero & Sanderson 2012).
4.2 Changes to Biomedical Technology
Another determinant of mortality trends is health technology (preventive and curative medicine), as well as population coverage. For instance, the development of vaccines against childhood diseases (measles, whooping cough, tetanus, poliomyelitis, pneumonia, etc.) was instrumental in controlling the targeted diseases in high mortality countries and reducing their mortality. However, the demographic impact was most visible when the vaccination campaigns reached the whole population and became sustained, especially after the major effort led by UNICEF and other international organizations that began in 1985.
The development of drugs had a huge impact on mortality. Drug development
started after 1945 with antimalarial drugs and antibiotics, and more recently has seen the use of anti-retroviral drugs and numerous other new medicines. These drugs have strongly reduced mortality from malaria, bacterial diseases, and more recently HIV/AIDS. In the field of nutrition, major improvements were also made through the creation of new strategies for treating and preventing severe malnutrition. However, there remains a number of diseases for which treatments are ineffective. That is particularly true for many cancers and other non-communicable diseases.
Changes in biomedical technology encompass a range of developments, each of
which has the potential to substantially reduce mortality. These technology changes include the development of new drugs and vaccines and their associated delivery mechanisms and diagnostic tools, as well as improvements in medical techniques, health care management, and improved software and communication tools. Yet the promise and almost certain introduction of new biotechnology developments in the future must be tempered by acknowledgement of the barriers to technological innovation and implementation that exist in resource poor settings. Such barriers include deficiencies in both infrastructure (power, water, roads) and personnel (skilled technicians and practitioners), as well as public mistrust and competing priorities for even minimal resources (Malkin 2007). In the past, financial incentives for developing biomedical technology appropriate for resource-poor populations have come predominantly from wealthier countries – either governments or private foundations – and the extent to which this will be necessary in the future is likely to differ dramatically across the current high mortality countries. Large countries, such as India with its substantial highly trained research and technical workforce, have already demonstrated the capability to generate appropriate new biomedical technologies. Smaller countries with fewer trained personnel are less likely to develop this capacity (Coloma & Harris 2004).
An international focus on reducing childhood mortality, with a recent emphasis
on improving both maternal and newborn outcomes during delivery and immediately post-partum, might provide the impetus needed to bring important changes in medical care and treatment to resource-poor areas. Examples of technological innovations that show promise include: treatment of postpartum hemorrhage with misoprostol or pre-packaged injectable oxytocin (Buekens & Althabe 2010; Winikoff et al. 2010), use of antenatal steroids to prevent death associated with premature delivery (Mwansa-Kambafwile et al. 2010), use of chlorhexidine to prevent umbilical cord infections (McClure et al. 2007), administration of antiretroviral treatment to prevent mother-to-child transmission of HIV/AIDS, new pneumococcal and rotavirus vaccines, and remote imaging from rural health clinics.
4.3 Effectiveness of Health Care Systems
All of the high mortality countries have relatively high levels of both maternal mortality and neonatal mortality. These two adverse outcomes are strongly linked, and their levels reflect the effectiveness of health care systems. A country's overall health system and the number of health personnel in particular are key determinants of mortality decline. Countries with a high proportion of physicians per capita have low mortality, as
Botswana before 1990. In contrast, when physicians leave the country, mortality tend to rise, as in Ghana between 1978 and 1983 (Garenne 2010a).
As child mortality declines, neonatal mortality will assume a larger share of the
remaining mortality burden. Reducing neonatal mortality will depend on improving and increasing access to antenatal care, skilled birth attendants, and available care for complications arising during pregnancy and delivery. Data from the Demographic and Health Surveys around 2008 indicate that the percent of births attended by a skilled provider varied considerably over the high mortality countries, from less than 25 percent in Bangladesh, Nepal and Lao PDR to almost 100 percent in Turkmenistan (World Health Organization 2010).
Efforts to increase access to skilled health providers for delivery have been both
numerous and varied in these countries, especially over the past decade. Increases in institutional deliveries occurred in both Ghana and Rwanda after government initiatives to reduce user fees as a barrier by paying providers directly for services and, in the case of Rwanda, to improve the quality of service provided. Other countries have focused on upgrading the skills of traditional midwives or providing incentives for private doctors to deliver services in underserved areas (World Health Organization 2010). The successes and failures of these various programs can guide future health systems investments in other high-mortality countries where health care resources are limited. However, progress toward cost-effective rationalization of reproductive health services delivery is hampered by a lack of data on the current level and quality of services provided.
4.4 Behavioural Changes Related to Health
Behavioural changes related to health are also important determinants of mortality especially related to the rise of non-communicable diseases in developing countries.
With respect to nutrition, the quantity and quality of the diet has generally
improved over the past 50 years, which has had an impact on the mortality of children and adults. There are exceptions to the overall improvement, especially in Africa, which has been plagued with political turmoil, wars, and extensive government mismanagement. And while people in much of the developing world struggle to get enough food, the problem of obesity is emerging in Southern Africa, especially among women. The problem is linked not only to consuming too much food, but eating unhealthy food (e.g. some industrially-produced products) as well as diets based on fried food and saturated fat. Economic and social changes are typically accompanied by changes in health behaviours, especially with respect to hygiene, disease prevention, and use of appropriate health services when sick. However, economic and social change is sometimes associated with negative behaviours, such as smoking, substance abuse, lack of physical exercise, and risky sexual behaviour. These behaviours can lead to significant increases in mortality from cancers and other non-communicable diseases.
4.5 Other Infectious Diseases: Role of Neglected and Emerging Diseases
In the 1960's, the widely held belief around the globe was that infectious diseases were under control in terms of prevention and treatment and that their effect on mortality would become negligible. Since that time, a number of diseases have emerged or re-
emerged, sometimes with significant impacts on mortality levels and trends. The WHO defines an emerging disease as, "one that has appeared in a population for the first time, or that may have existed previously but is rapidly increasing in incidence or geographic range."
The dynamics of such diseases are largely independent of economic
development, level of education, or socioeconomic status, and are almost impossible to predict. They are determined by a variety of factors, including: evolutionary factors (jumping the species barrier); natural selection (pressure of antibiotics or other drugs); ecological factors (appearance of a new niche or a new vector); demographic factors (population density, migration); and behavioural factors (e.g. sexual behaviour). The mortality impact of these diseases depends on their spread in general populations, their lethality, their latency period (e.g. the length of the asymptomatic phase) and the absence of prevention or treatment. The NIAID lists around 20 recent emerging / re-emerging diseases, and more are likely to come in the future.
Among the emerging / re-emerging diseases in the past 40 years in high
mortality countries, three stand out as having a major mortality impact: HIV/AIDS, tuberculosis, and malaria. HIV/AIDS started to spread in general populations in the early 1980's and soon became a leading cause of death among young adults and children. The disease was almost always lethal for the first 20 years of the epidemic. The course of the epidemic changed in about 2000, when prevention efforts (condom use and reducing casual partners) came into effect. Since that time HIV prevalence has stabilized and tended to decline in most infected countries. Its mortality impact changed radically at about the same time, with the massive use of antiretroviral therapy (ARV). Even in highly infected countries such as South Africa, mortality started declining after years of increase. South Africa experience 15 years of increases in mortality before a decline began in 2005 that was the start of a fast-paced new trend.
Emerging diseases such as HIV/AIDS have not only an impact on mortality
from infectious diseases, but also on non-communicable diseases (cancers), and even on maternal mortality. For instance, in South Africa, indirect causes of maternal deaths increased four-fold because of HIV and tuberculosis, and direct causes increased two-fold, partly because of the diseases themselves (causing puerperal infections), and partly because ARV treatments induced hypertension, causing death by eclampsia.
Tuberculosis also re-emerged in a number of places for two reasons: first, it is an
opportunistic infection of HIV/AIDS, so the HIV/AIDS epidemic induced a large increase in the number of tuberculosis cases. Second, the use of antibiotics was so extensive that it led to an increase in resistant strains of diseases, which increased their lethality. In recent years, however, new combination treatments are bringing the disease under control.
Malaria re-emerged in Africa in the 1980s and 1990s, mostly as a result of the
pressure of treatment with chloroquine, leading to massive resistance and increased mortality (Trape 2001). However, since 2000, the disease is again on the path to be controlled, in part because of new and more efficient treatments (in particular with Artemisinin combination therapy), and due to new prevention efforts, particularly insecticide impregnated bed nets.
Infectious agents for a host of diseases, such as influenza, meningitis, and
diarrheal diseases, are constantly evolving and responding to drugs by developing
resistance. As a result, the long-term effect of these diseases on mortality can only be estimated with a large degree of uncertainty.
4.6 Environmental Changes
The impact of climate change on human life and health is an area of intense scientific scrutiny. The pathways through which climate change may affect health and mortality can be partitioned into four broad groups: 1) increased frequency and intensity of heat waves, floods, and droughts e.g. climate stress; 2) a reduction in cold-related deaths; 3) changes in the distribution of vector-borne and infectious diseases, and 4) increased risks of disasters and malnutrition (Haines et al. 2006). The overall balance across these factors is likely to be negative with populations in developing countries likely to be greatly affected by the adverse impacts of climate change. For instance, the direct impacts will result in changes in water distribution and agricultural production, including food. Rising temperatures leading to changes in the distribution of vector-borne diseases are believed to be responsible for changes in the incubation period of the pathogen within the vector, resulting in increased risks of malaria, Dengue fever, Lyme disease, and Ross River Virus (Strand et al. 2010). The evidence shows that high-income countries are also likely to be affected, with possible examples being the 2003 heat wave in Europe, hurricane Katrina in the US in 2005, and the Melbourne bushfires in 2009. Indirect impacts of rising temperature include increased sea level and ocean acidity.
Public-health strategies and improved surveillance are essential to improve
adaptation to climate change especially in low income countries. Reducing the use of fossil fuels and increasing the use of renewable energy technologies should improve health in the near term by reducing exposure to air pollution and therefore mitigate the negative impacts of climate change (McMichael et al. 2004; Tanser et al. 2003; World Health Organization 2006).
4.7 Mortality Due to Crises
The political stability of the state, or national government, and its investment in the health sector are likely to be key ingredients of a positive transition to low mortality. Conversely, political instability often leads to an increase in mortality. An example of the first scenario is Senegal, a country with virtually no economic growth and a low level of education, which yet has experienced a dramatic decline in under-five mortality since 1960. A counter example is Uganda, where a major political crisis induced by a coup d'état in the 1970s and years of civil war, led to a large increase in mortality (Garenne & Gakusi 2006).
Crises resulting from conflicts, violence, famine or natural disasters (including
tsunamis, earthquakes, floods and hurricanes, etc.) may not only lead to overall increases in mortality, but also affect segments of the population in ways that may translate into distinct patterns of excess mortality by age and sex. Excess deaths from
5 Portions of this section are partly drawn upon from United Nations (2011a)
these crises can be caused directly by violence or natural disasters, but may moreover be associated with indirect effects, such as damage to infrastructure, interruption of services (water, sanitation, health care), and harm to production and marketing of food. Consequently, mortality risks may continue to be higher after the period of an actual crisis. Furthermore, crisis-induced morbidity and malnutrition could also have long-term negative effects on the health and mortality of a given population.
Such crises can lead to important deviations in the trend of mortality decline that
is considered typical in most projections of mortality levels and therefore need to be taken into account while doing such an exercise. Though it is clear that many different types of crises will occur in the following decades, predicting such events in specific geographic settings is not feasible. However, our knowledge of current crises and post-conflict situations can be taken into account when generating feasible assumptions regarding short- or medium-term projections of mortality decline. Clearly, countries that are now in the midst of a crisis should be subject to different patterns than countries that have recently faced one. On the one hand, the projected increase in life expectancy at birth should be more conservative in a country that is currently in the midst of conflict or civil strife. Such considerations should be taken into account for countries like Afghanistan, Somalia, Sudan, and Syria. On the other hand, a country that has recently come out of a severe crisis may be experiencing outstanding progress in mortality declines and researchers should be cautious in extrapolating the resulting trends into the future. For example, Rwanda, a country that experienced tremendous mortality spikes in the mid-1990s due to the genocide and other crises has been experiencing exceptional declines in mortality, partly as a result of the recovery one would anticipate following a mortality shock.
Outside interventions following a shock can benefit the survival prospects of
populations. Though it is not easy to measure precisely the role of each event (recovery vs. interventions), it is clear that the outcome of such a unique combination of events should not be extrapolated into the future; the pace of decline in mortality is likely to slow down. Furthermore, not all countries that have undergone a mortality crisis due to a conflict, civil strife, or other events have experienced fast declines in mortality in the aftermath of the crisis. Following a crisis, government capabilities to make proper interventions are sometimes limited or compromised, which may result in slow progress in survival improvements. The same may apply to countries that have been facing long term crisis. One could anticipate, for the following years, slow improvements in the level of life expectancy at birth, if any, in countries that are no longer in the midst of a crisis but are still facing economic and other challenges.
4.8 Differential Trends in Population sub-Groups
This section briefly reviews important relationships between a variety of causes and conditions, on the one hand, and mortality trends in particularly affected populations, on the other. Economic development and income per capita are important determinants of mortality decline, and periods of economic growth are usually associated with the latter, whereas periods of economic crises are often associated with increased mortality. An example of the first scenario is Gabon before 1990, a relatively wealthy country that reached relatively low levels of mortality. A counter example is Zambia, which has been ruined by an economic crisis that struck in 1975 and led to a major increase in
mortality. Higher household income also has a direct effect on health through improved nutrition, causing major declines in income to be associated with worsening nutritional status (Waltisperger & Meslé 2007).
Pockets of extreme poverty have emerged in numerous large cities, with serious
health consequences. For instance, in the slums of Nairobi, Kenya, under-five mortality has doubled over the past 20 years because of badly inadequate hygiene conditions, violence, and lack of infrastructure and personnel (Garenne 2010b).
A high level of education at the national and household levels is usually
associated with lower mortality because education is closely associated with knowledge, attitudes, and behaviours, all determinants of a person's health status.
Familial socioeconomic status has been found through extensive research to be a
primary determinant of infant and child survival across virtually all societies, regardless of the overall standard of living. In addition, the independent effect of maternal education on infant and child survival has received special consideration beginning with the pioneering work of John Caldwell (1979). While the majority of empirical research has shown a strong, independent effect of maternal education on family economic resources, variation in the strength of this effect has been observed across countries and over time. Recent research has demonstrated that some of this variation may be due to the overall level of educational attainment of women at both the community and societal levels. Thus, as a higher proportion of women attain secondary or higher levels of education, infant and child survival appears to improve even for women with less education and fewer economic resources. In projecting the impact of sub-group differentials on future trends in infant and child mortality, the extent of social and economic integration across the country as a whole, and particularly between rural and urban areas, is likely to have a large influence on the rapidity of improvement in child survival (Pamuk et al. 2011).
Evidence has shown that increasing levels of educational attainment are likely to
be correlated with decreasing levels of mortality, morbidity and disability among adults (for a survey see KC & Lentzner 2010). In North America and Europe, the literature has documented the existence of an education gradient in mortality, specifically a strong inverse relationship between education and mortality among adults (Kunst & Mackenbach 1994; Ross & Mirowsky 2006; Ross & Mirowsky 1999; Zajacova 2006).
The relevant literature outside of developed countries, particularly sub-Saharan
Africa, is scarce. A few studies in Asia document the usual negative relationship, with some exceptions, primarily related to women's survival and breast cancer mortality (KC & Lentzner 2010).
In sub-Saharan Africa, where HIV and AIDS has been ravaging populations for
the past 20 years, evidence of an education gradient in mortality is mixed, implying a high degree of heterogeneity, especially as far as the link between HIV infection and education is concerned (Fortson 2008). A number of authors (Gregson et al. 2001; Over & Piot 1993) have documented a positive relationship, particularly at the beginning of the epidemic, where highly educated individuals were more likely to engage in risky sexual behaviors given the availability of casual sex and the means to pay for it. Forston (2008) shows evidence in her recent paper of a robust positive education gradient in HIV infection, after controlling for a rich set of confounders and non-response bias in HIV testing, where adults with six years of schooling were more likely to be HIV
positive than adults with no education. Other authors (Glynn et al. 2004) found no evidence of an increased risk of HIV infection associated with education, hypothesizing that the more educated might be responding more adequately to behavioral change programmes.
Based on an analysis of maternal mortality modules across 84 DHS surveys
conducted in high mortality countries, Masquelier and Garbero (forthcoming) looked at educational differentials in adult mortality (defined as the probability of dying between ages 25-40) based on siblings estimates. The analyses were based on surveys conducted in high mortality countries such as in Sub-Saharan Africa (70 DHS), Haiti, Afghanistan, Bangladesh, Nepal, Cambodia, Timor-Leste, and Bolivia. In this study, the authors examined the relationship between the living sister level of educational attainment and adult deaths in the household. The critical assumption is that educational outcomes are correlated among siblings, therefore the level of educational attainment of the living sibling acts as a proxy for the level of educational attainment of the deceased sisters (Graham et al. 2004).
The results confirm the large heterogeneity of country-specific trends by level of
educational attainment particularly for those countries with several DHS and reliable adult mortality trends (namely Bolivia, Kenay, Madagascar, Namibia, Uganda, Rwanda, Zambia and Zimbabwe). This heterogeneity is both a function of the overall level of adult mortality and the stage and size of the HIV epidemic. Specifically, in countries with a relatively low level of adult mortality such as Bolivia and Madagascar, the negative expected gradient was found, i.e. significantly higher risks of dying for uneducated women versus those of women with lower secondary education or higher. In some of the remaining countries, an opposite gradient was found, although not statistically significant. Other countries presented instead an evolving gradient that highlights the important role of HIV as a confounding factor in the positive relationships between educational attainment and survival gains (Masquelier & Garbero 2012). Further research using supplementary datasets should both aim at triangulating these results and also exploring the causal mechanisms that drive the relationship between education and mortality and lie behind such gradients.
5 Expert Survey on the Future of Life Expectancy in High Mortality
Countries
This section presents the results of the 2011 survey module on future trends in life expectancy in high mortality countries. Survey respondents provided numerical predictions of future trends in life expectancy through 2050 and an assessment of factors producing these trends for a country of their choice. They were also asked to indicate additional countries or regions for which their assessment was valid. Altogether, only 28 questionnaires in the high mortality module of the survey were completed, with results pertaining to a total of 14 countries. The paucity of responses corroborates both the uncertainty that revolves around the estimation of mortality trends in high mortality countries and the lack of experts' confidence in making predictions about the future of mortality in such countries. The following figures combine responses for all 14 countries in the high mortality questionnaire sample, (n=28), as well as for the 10 countries of sub-Saharan Africa (n=17) and the four countries of South Asia (n=11) separately (Table 3).
Table 3. Survey respondents according to country and region of projection provided, country of work, field of expertise, gender and age.
Country (and region of projection)
No. of experts Country of work
No. of experts
Eastern Africa
Tanzania
Zimbabwe
Middle Africa
Cameroon
Congo (Dem. Rep. of)
Southern Africa
Western Africa
Burkina Faso
South-Central Asia
Bangladesh
Pakistan
Total responses
Field of expertise
Data collection and analysis
Demography
Age group
Economics
Fertility, Ageing, Reproductive health
Health Economics
Mortality
Maternal and Childhood mortality
Migration
Migration and health
Monitoring and Evaluation
Population & health
Population Studies
Population, FP, RH
Country (and region of projection)
No. of experts Country of work
No. of experts
Quantitative demography/projections
Reproductive health and development
Social demography
Economic demography, fertility, health
Reproductive health
One of the key elements of this exercise was to obtain predicted decadal gains in
life expectancy at birth from respondents for 2010-2030 and 2030-2050 ("best guess" estimates plus 80 percent uncertainty intervals). After providing a numerical estimate for the decadal gain in life expectancy, experts were asked to assess the validity and relevance of alternative arguments about the forces (clusters) that will shape these future trends. Then, having worked through the arguments of the questionnaire, experts were asked whether they wanted to alter their initial projections. Most experts kept their projections unaltered. If the respondent did not alter the preset default value for the point estimate, minimum, or maximum, these responses were set to "missing". The following figures show the experts' final projections of life expectancy at birth, along with the official UN estimated trend since 1950 and projections revised in 2010 (United Nations, 2011). The gains in life expectancy for 2005-2020 and for the decade 2030-2040 are derived from interpolating the decadal estimations related to the start of the period in 2005. The grey areas around the expert trend indicate the range of the 80 percent uncertainty intervals assessed by the experts. The regional and global estimations were further weighted by the population sizes of the countries, based on UN data and medium variant prediction until 2050/55. For comparing the regional mortality trend of the experts with the UN estimation, we selected only those countries for which the experts assessed the future gain in life expectancy.
t b
a
cy
n 60
cta
n
e
p
x
e 50
Figure 17. Previous and expected future trend in life expectancy at birth for all high mortality countries
Note: Authors' own calculations
The gains in life expectancy since 1950 in these high mortality countries
represent one of the major achievements of the latter half of the 20th century. Between 1950 and 1975, the UN estimates that life expectancy at birth increased from 39 to 53 years in these countries. However, the impact of the HIV/AIDS epidemic resulted in a dramatic slowing of the previous pace of improvement. Between 1975 and 2000, life expectancy at birth increased by only seven years. More recently the pace of improvement appears to have again accelerated slightly, with life expectancy at birth reaching 63.6 in 2010. The UN medium variant however, projects a future gain of only two years each decade between 2010 and 2050, implying life expectancy at birth of only 72 years by mid-century. The experts responding to our survey were more optimistic, predicting decadal gains of over three years, implying a life expectancy at birth of 70.5 in 2030 and 77.1 in 2050. Despite this general optimism, the range of uncertainty was quite high, with lower values representing only a three-year gain between 2010 and 2050, and higher values indicating a 20-year gain.
The survey respondents were also asked to assess the validity and relevance of
alternative arguments about the forces that could shape future mortality trends in the country or region they chose. Survey respondents for high mortality countries were given a list of 39 arguments grouped according to seven underlying forces, forming the following clusters: changes in bio-medical technology; effectiveness of health care systems; behavioural changes related to health; infectious diseases and resurgence of old diseases; environmental change, disasters and wars; changes in composition and differential trends in population subgroups; and HIV/AIDS.
For each argument the experts could assess the likelihood, the conditional
impact, and the net impact. The likelihood or validity of an argument was defined across the following response scale: Very likely wrong = 0; more likely wrong than right = 0.25; ambiguous = 0.5; more likely right than wrong = 0.75; very likely right = 1.0. The conditional impact gives the respondents' assessment regarding the consequences of the argument for future life expectancy, if the argument becomes true. The scale contains five categories: strongly decreasing (-1); moderately decreasing (-0.5); none (0); moderately increasing (0.5); strongly increasing (1). Likelihood and conditional impact were then used to derive an argument's net impact on future life expectancy. In the survey, these net impacts were predefined as a combination (multiplication) of an argument's likelihood and its conditional impact, but the experts were free to change the calculated impact. At the end of the questionnaire the experts could allocate points to each cluster of arguments based on its relative importance for future trends in life expectancy. Allocations were made so that the sum of distributed points totaled 100 percent.
Figure 18 shows the net impact of each argument in a Circos plot. Each segment
of the plot presents one cluster, while the size of the segment depends on the cluster importance as assessed by the experts. The cluster of arguments deemed most important by the survey respondents related to the effectiveness of health care systems (24 percent importance), followed by behavioural changes related to health (17 percent importance) and changes in bio-medical technology (15 percent importance). However, the specific arguments having the greatest net impact on life expectancy in the high mortality countries under consideration were not necessarily in those clusters of forces deemed to have the greatest importance. Within each cluster, the net impact of individual arguments is shown in the outer grey ring. Arguments could be interpreted to have either a positive or negative influence on life expectancy, as indicated by the position of the bars. The optimism expressed by respondents in their numerical predictions for life expectancy at birth is reflected in the larger net impact values for arguments with positive influences compared with arguments with negative influence.
Figure 18. Circos Plot
The average relative importance given to each cluster is shown on the left side of
Figure 19, here indicated by the size of the circle. The position of the circle on the Y-axis represents the absolute value of the argument with the highest net impact on future life expectancy within that cluster.
Figure 19. Cluster relevance and the ranking of highest impact arguments for all high mortality countries (Global trend)
The right side of Figure 19 ranks specific arguments by multiplying the absolute
value of their mean net impact score by the cluster weight. So although the argument "Improvements in the education of women will improve the health of children" (HD 6-4) was assigned the highest net impact score of any specific argument, it is not ranked among the top five arguments. This is because overall, factors related to differential trends in population sub-groups are not considered to have as much impact on future life expectancy as other forces. By contrast, the importance allocated to the effectiveness of health care systems combined with relatively high net impact scores means that the four highest ranked arguments come from this cluster: basic public health interventions for children under five (HD 2-4), expansion of coverage for inexpensive interventions against diarrhoea, pneumonia and malaria (HD 2-5), extension of reproductive health services (HD 2-6), and investments in education increasing the quality of health care personnel (HD 2-8) , .
As noted previously, the countries that continue to experience high mortality
levels are concentrated in sub-Saharan Africa and Asia, with African countries disproportionately affected by the HIV/AIDS epidemic. We therefore examine the survey responses for African and Asian countries separately.
t b
a
cy
n 60
cta
n
e
p
x
e 50
Figure 20. Previous and expected future trend in life expectancy at birth for Africa
As shown in Figure 20, the increase in life expectancy at birth since 1950 has
been less dramatic in the 10 African countries for which we obtained survey responses than for all 14 high mortality countries. In addition, the HIV/AIDS epidemic resulted in a decline in life expectancy between 1985 and 1995, but the recent resumption of continual improvement in survival has been quite dramatic. Still, by 2010 life expectancy at birth in these African countries was estimated to be only 53.6 years.
The increase in life expectancy predicted by the survey respondents exceeded
the UN projections only slightly; the UN medium variant projects a gain of 7.2 years for 2010-2020 and a gain of 6.2 years for 2020-2050, while the survey respondents predicted, on average, gains of 8.1 years and 6.4 years for these same periods. However, the degree of uncertainty expressed by the survey respondents was substantial; the lower bound reflects in a decline in life expectancy of 4.6 years by 2050, while the upper bound indicates a gain of 23.4 years.
Figure 21. Cluster relevance and the ranking of highest impact arguments for Africa
Figure 21 shows that survey respondents for African countries regarded a
number of underlying forces as important in determining the future course of life expectancy: the effectiveness of health care systems (Cl 2, 26% influence), HIV/AIDS (Cl 7, 17% influence), changes to bio-medical technology (Cl-1, 16% influence), and behavioral changes related to health (Cl-3, 15% influence). With respect to specific arguments, "Improvements in the education of women will improve the health of children" (HD 6-4), and "Improvements in medical technology will contribute to declining mortality" (HD 1-1) were considered to have the greatest net impact on life expectancy. Still, the combination of the greater cluster weight and relatively high net impact scores given to specific arguments means that arguments related to the effectiveness of health care systems dominated the list of top five arguments for African countries (right side of Figure 21).
t b
a
cy
n 60
cta
n
e
p
x
e 50
Figure 22. Previous and expected future trend in life expectancy at birth for Asia
As shown in Figure 22, life expectancy at birth increased dramatically after 1950
in the four populous Asian countries of India, Pakistan, Bangladesh and Nepal. The period between 1950 and 1975 saw an increase of 15 years, and even as the pace of increase slowed somewhat since 1975, life expectancy continued to rise by nearly 3.5 years per decade, reaching 66 years by 2010. After 2010, the UN medium variant assumes a slowing in life expectancy gains in these four countries, projecting a decadal gain of only 2.5 years between 2010 and 2030 and a decadal gain of only 1.5 years between 2030 and 2050. The survey respondents for these countries were considerably more optimistic, expecting an average increase of 3.8 years per decade, producing a life expectancy at birth of 81.4 by mid-century. In addition, the level of confidence expressed for these predictions was substantially greater than for Africa. The upper bound indicates a gain of 21 years by 2050, resulting in life expectancy at birth reaching 87.2 years. It is interesting to note that the lower confidence bound given by survey respondents indicated a pattern and level of life expectancy gain only slightly less than the UN medium variant projection, resulting in a projected life expectancy for 2050 of 73.5 years, while the UN projection is for life expectancy to reach 74.6 years.
Another difference is that respondents for Asian countries tended to attribute
importance more evenly across the underlying forces affecting life expectancy than respondents for Africa, as reflected in the more similar sizes of the circles in Figure 23.
Figure 23. Cluster relevance and the ranking of highest impact arguments for Asia
Respondents for Asian countries still attributed the most importance to the
effectiveness of health care systems (Cl 2, 22% importance), changes in behaviors affecting health (Cl 3, 19% importance), and changes in bio-medical technology (Cl 1, 15% importance). But in contrast to respondents for Africa, more importance was attached to differential trends in population sub-groups and less to HIV/AIDS.
Still, the top five arguments again reflected the importance attached to the
effectiveness of health care systems, but with "Delivery of reproductive health services, including antenatal care services and family planning programs, will be extended" (HD 2-6) ranked highest. Concern with chronic disease as a cause of death in Asia is reflected in the argument "Sedentary lifestyles and changes in diet leading to chronic disease risk will increase" (HD 3-1) appearing among the top five. "Improvements in the education of women will improve the health of children" (HD 6-4) again had the greatest mean net impact score of all the specific arguments, and the greater importance assigned to the population sub-group cluster (Cl 6) for Asia resulted in this argument's appearance among the top 5.
6 Meta-experts' Assessments of Future Life Expectancy Trends
On February 10–11, 2011, a meeting of experts was held in Cape Town, South Africa, to review, synthesize and critique the survey results and to develop alternative scenarios—most likely, optimistic and pessimistic—for future mortality trends in high mortality countries. The meeting participants were Rob Dorrington, Tom Moultrie, both from the University of Cape Town, Ian Timaeus from the London School of Hygiene and Tropical Medicine; Michel Garenne from Institut Pasteur, and Francois Pelletier, for the United Nations Populations Division. Initial discussion focused on the unique issues in projecting mortality for countries with high mortality: the lack of data for determining past trends and current levels of life expectancy, and the inability to predict emergent threats and their impacts on future trends. An example of the latter is the difficulty posed by the HIV/AIDS epidemic, not just with respect to predicting the
epidemic, but also in modeling its future impact. As a group, these experts felt that attempting specific projections for individual countries was unwieldy and likely to yield inconsistent results, and that the mortality projections should be based on a classification of countries that would follow similar trajectories into the future. The most obvious starting point for this classification was to separate high mortality countries according to their prevalence of HIV/AIDS.
6.1 Storylines for Low HIV/AIDS Prevalence Countries
An optimistic scenario for countries that continue to have high mortality implies a convergence of forces that would act to dramatically reduce death in infancy and childhood, accompanied by improvements in mortality among working aged men and women. In most of these countries, this could be maximally achieved by the development of a vaccine and improved treatments for malaria that would be both effective and made widely available. This, in combination with broad implementation of current "best practices" known to reduce deaths from pneumonia, diarrheal diseases, and undernutrition (pneumonia vaccination, oral rehydration therapies, food and vitamin supplementation) and injuries (especially road accidents) could translate into a five year decadal gain in life expectancy. Achievement of this optimal scenario would imply that the international community would continue, at a minimum, its current level of funding for high mortality countries. In addition, the high mortality countries would have to demonstrate the political will to utilize external funding appropriately and to provide internal resources to improve health services infrastructure and increase and improve education. Improvements in education are crucial since education increases motivation to improve health at the individual level, providing benefits over the entire life course. With respect to chronic, as opposed to infectious diseases, the most optimistic scenario would occur if these high mortality countries benefit from the experience of low mortality countries by preventing increases in the behavioral risk factors for chronic disease (smoking, obesity, drug and alcohol use).
The pessimistic scenario was described essentially as the opposite of the
optimistic scenario. The negative scenario could occur as a consequence of increased isolation and reductions in aid from wealthier nations to high mortality countries. Within a high mortality country, lowering mortality could be set back by economic stagnation or decline. An economic crisis could lead to a reduction in standards of living and, in more extreme cases, increased internal or external conflicts. In addition, easy solutions would not materialize in the form of long-lasting "magic bullets"; newly developed vaccines would prove to be ineffective when scaled up, drug-resistance would develop to existing treatments, and non-compliance with treatment regimens would increase. Along with this failure to effectively combat mortality from infectious diseases, unhealthy behaviors leading to chronic diseases (poor dietary habits, drug and alcohol use, and smoking) could increase. The group felt that this scenario would result, on average, in a 0.1 year increase in life expectancy over a decade, but that this could vary significantly across countries with some countries experiencing declines in life expectancy.
Regionally, all of the high mortality countries outside of Africa have relatively
low AIDS prevalence, with the exception of Haiti. Even without a high HIV/AIDS prevalence, South Asia represents a disproportionate share of the world's mortality
because of its large population size. The meeting participants agreed that the most likely scenarios for the most populous countries in this region would be determined by progress in reducing infant and child mortality. In general, the meeting participants were somewhat less optimistic than the survey experts with respect to the likely future scenario for India. These meta-experts felt that it was unlikely that mortality decline would continue at as rapid a pace once substantial reductions in child mortality had been achieved. The group agreed that a four-year increase for 2020-2030 seemed reasonable, somewhat less for 2040-2050, and that a best-case scenario would be an increase of five years in both decades. The worst-case scenario would be decadal gains of 1.5 years. For Bangladesh, the consensus was that the recent rapid increase in life expectancy was likely to continue into the near future, in line with the UN projection. A pessimistic scenario for Bangladesh would be only a one year gain per decade, while an optimistic scenario wouldn't be much better than the UN projection, since mortality is now low enough that gains will be slower. The consensus opinion regarding the most likely course for Pakistan was much less positive. Meeting participants noted that education gains in Pakistan have stalled, especially for girls. The probable scenario was seen as a slow improvement in life expectancy equal to the UN projection of two years per decade. A pessimistic scenario would be a loss of one year per decade, while the optimistic scenario would produce a three year per decade gain.
6.2 Storylines for High HIV/AIDS Prevalence Countries
The most optimistic scenario for countries severely affected by the HIV/AIDS epidemic would imply the development, in the near future, of an effective vaccine that could be made available at a reasonable cost. Barring this, a lesser but still optimistic scenario could be achieved by maintaining international support for anti-retroviral development and treatment. Since the effectiveness of currently available anti-retroviral drugs is less than 100 percent, even an optimistic scenario would mean that there would still be many AIDS deaths in 30 years, but perhaps not in 50 years. However, the meeting participants agreed that current methods for the prevention of mother-to-child transmission of HIV could, under optimal circumstances, mean that childhood AIDS could be eliminated. This, combined with a broader reduction of infectious disease mortality, especially in childhood, could produce decadal life expectancy gains of five years through 2050.
A pessimistic scenario would imply a continuance of mother-to-child
transmission and childhood AIDS. Adult AIDS mortality could even increase if funding for anti-retroviral treatment diminishes and/or host resistance to these drugs increases. An added problem would be that advances against chronic disease mortality could be constrained by expanding resources on HIV/AIDS so that little is left for prevention and control of other diseases.
The region most affected by the HIV/AIDS epidemic is Southern Africa.
According to UNAIDS, the average prevalence rate in 2009 for these five countries was 21 percent, ranging from 13 percent in Namibia to 26 percent in Swaziland. In terms of the most likely scenario for future life expectancy in this region, the general consensus was that an effective AIDS vaccine was unlikely to be available in less than 10 years. South Africa, the most populous country in the region, was seen as likely to experience a three year per decade increase in life expectancy. A pessimistic scenario would result in life expectancy stagnating, while an optimistic scenario would result in rapid short-
term gains allowing South Africa to catch up to the UN non-AIDS projection and then follow that trajectory. The meta-experts generally felt that Lesotho was likely to follow the pattern set by South Africa, but that Botswana and Swaziland would be different, but in ways that were difficult to predict due to the lack of data.
Eastern Africa is the region with the next highest AIDS prevalence; the average
across these 15 countries is 5.7 percent, but the range extends from 0.1 percent in Comoros to 14.3 percent in Zimbabwe. The situation in Zimbabwe illustrates the difficulty with making country-specific projections. Recent data indicate that both HIV/AIDS prevalence and mortality have been falling, but explanations for this decline remain elusive. Speculation for the cause range from the dire economic situation resulting in less travel and less risky behavior overall, to previous high mortality years eliminating many HIV infected persons. It was suggested that Kenya would likely follow a pattern similar to South Africa because the lower HIV/AIDS prevalence (estimated to be 6.3 percent in 2009) would permit effective implementation of anti-retroviral drug treatment programs. Ethiopia, the largest country in Eastern Africa, also presents difficulties due to the paucity of data. The trend projected by the UN for Ethiopia is heavily dependent on the future course of child mortality, which appears to have declined steadily, with some recent acceleration in the rate of decline. The consensus was that the probable trend for Ethiopia was likely to be somewhat better than the UN projection.
The countries of Middle and Northern Africa, on average, have a somewhat
lower HIV/AIDS prevalence (3.5 percent in 2009), ranging from a low of one percent in Sudan to five percent in Cameroon. The meta-experts felt unable to project a specific probable course for mortality for this region as a whole or for any of the constituent countries due to a lack of data and the history of recent civil conflicts.
Western Africa has, on average, the lowest HIV/AIDS prevalence in sub-
Saharan Africa (1.8 percent in 2009). Even so, projecting mortality for these countries must be done in the context of uncertainty. Nigeria, the largest country in the region, epitomizes this problem. The high levels of child mortality in Nigeria imply the potential for dramatic decreases, but the meta-experts felt that there was enough uncertainly in the Nigerian data to question their use as the basis for future projections. The general sense among the meeting participants was that a decadal gain of four years in life expectancy was very optimistic, that a gain of only one year somewhat pessimistic, and the most likely scenario would be decadal gains of two years.
7 Combining Expert Assessments and Model Forecasts to Define
Scenario Assumptions
For high and low mortality countries the same procedure was applied for defining the final assumptions for overall mortality levels for each country. The procedure is summarized in (Samir et al. forthcoming) and detailed in the Appendix I by Garbero and Sanderson. For the high mortality countries, outcomes of the model-based forecast were blended with the assessments of the surveyed experts as described in this paper and with results of the meta-expert meeting in Cape Town,South Africa.
In sum, the statistical model used explicitly assumes convergence in the decadal
increase of life expectancy. The model also takes into account country-specific heterogeneity in the historical trajectories of life expectancy as well as between-
countries heterogeneity in terms of increases in life expectancy. This reflects the view that "national mortality trends should be viewed in a larger international context rather than being analysed and projected individually" (Lee 2003). Our model also follows the argument of Torri and Vaupel (2012) that life expectancy across different countries tends to be positively correlated, so that forecasts for particular countries can be carried out by forecasting the best-practice level of life expectancy and then the gap between this best-practice level and the particular country's performance. The model used here builds upon this method by varying the speed of convergence, taking into account differential rates of linear increase in life expectancy across groups of countries. As described in detail in the Appendix I, this is operationalized by choosing Japan as the global forerunner with a long-term increase of life expectancy of 2 years per decades. A set of regional forerunners is then assumed to converge to this Japanese speed of improvement. In a second round, the model then defines the convergence of all countries to their respective regional forerunners. This statistical model results in a consistent set of projections for all high and low mortality countries except for some countries with high AIDS prevalence that required special assumptions as described in the technical Appendix I by Garbero and Sanderson.
The added value of this convergence model lies partly in the fact that it is based
on empirical data. In addition, it takes into account the heterogeneous country-specific historical experiences as well as differences in gains between forerunners and laggards over time and across regions. Thus, it accounts for structural as well as stochastic components that contribute to life expectancy trends over time and can generate unbiased parameters upon which the new forecasts are based. Building further, the model-based forecasts were adjusted to incorporate source experts and meta-experts arguments and assessments about future gains in life expectancy in individual countries up to 2050. This was done by assigning the results of the statistical model the weight of 1.0, the average of the meta-experts' responses the weight 1.0 and the specification of each individual source expert who made a statement on a given country the weight 0.2. The final step consisted of modifying the future trajectories (2050-2095) based on the new trend implied by the reweighted forecasts up to 2050, as described in detail in the Appendix I. This procedure is applied to female life expectancy, from which male life expectancy is derived by assuming the sex-differentials in mortality used in the 2010 UN assessment. For countries seriously affected by the HIV/AIDS epidemic, the United Nations medium scenario, which explicitly models the impact of HIV and AIDS with an epidemiological model (Alkema et al. 2007; Brown et al. 2010; Raftery & Bao 2010), is used up to 2050. After 2050 life expectancies to the end of the century were projected using the model with Namibia as the forerunner country for this group of countries. A comparison with the UN assumptions for this period showed very close results.
The resulting mortality assumptions for each country are listed in tabular
Appendix II for selected years and in the on-line material for all years. The high and low mortality assumptions were derived for all low-mortality countries by the same procedure under the simple assumption that the decades gain of the frontrunner is 1.0 years higher or lower than in the medium assumption. For countries (mostly in sub-Saharan Africa) with a high prevalence of HIV/AIDS, larger uncertainty intervals were assumed for the nearer-term future. In the first decade of the projections, life expectancy is assumed for those countries to be five years lower or higher than in the medium. After 2020, the "high" mortality scenario for those countries assumes a one year lower
decadal gain than in the medium scenario. The "low" mortality scenario assumes an additional two years gain per decade on top of the gain from the medium scenario until 2050, and one year additional gain thereafter. This procedure was only applied to the high HIV/AIDS countries in order to reflect the particularly large uncertainties with respect to speed for recovering from AIDS, which is also directly linked to the future funding of anti-retroviral treatment.
Education-specific trajectories of life expectancy were then derived by the
procedure described in Samir et al. (forthcoming), based on the assumption that the medium trend in overall life expectancy (across all education groups) as discussed in this paper reflects the educational attainment change over time that is implied by the Global Education Trend (GET) scenario. Together with the assumption of certain given relative differences in education-specific mortality, this procedure produces unique iteratively derived sets of education-specific mortality trends for each educational attainment category.
It is worth noting that using different education scenarios together with identical
sets of education-specific mortality trajectories produces a resulting trajectory of overall future life expectancy that is different, because the different education structure of the population implies different weights for the sub-populations that each have different education-specific mortality rates. In this way the assumed future of education trends is also a direct determinant of the future trajectory of the overall level of mortality.
8 Conclusion
This paper has highlighted the challenges that attend the estimation of past trends as well as the projection of the future course of life expectancy in high mortality countries. The challenges revolve around the presence of a large degree of uncertainty that encompasses several dimensions.
First is the uncertainty that surrounds the empirical basis for the estimation of
past trends and current levels: namely the lack of reliable data on age-specific mortality rates, particularly for adults, in this subset of countries. Although the methods employed have generated far better estimates than previously available, continual improvement in both data and methods is anticipated.
Second, there is uncertainty that points towards the heterogeneity of trends and
pathways across this group of countries: in other words, the disparity in terms of past trends reinforces the difficulty in making predictions about the future course of life expectancy without linking these predictions to the forces determining the progress – or lack thereof – in combating the underlying determinants of both child and adult mortality peculiar to each of these countries.
Third, there is uncertainty that revolves around the use of demographic and
epidemiological models to predict the future of life expectancy in high mortality countries, as well as the assumptions regarding the parameters that are at the basis of these models. This is particularly true for countries affected by HIV and AIDS where assumptions about coverage and efficacy of treatment are key determinants of these predictions.
Fourth, there is uncertainty around expert opinions vis a vis the importance and
the role of the forces that will shape the future of life expectancy and the direction and
magnitude of life expectancy gains. This uncertainty is reflected both in the small number of source-experts who provided answers to the high mortality questionnaire, and in the meta-experts' mostly dichotomist view of the future of life expectancy in high mortality countries, which could be summarized as a radical versus a more conservative view around their vision of the effectiveness of anti-retroviral treatment, continued progress towards reducing child and infant mortality, and increasing behavioral health risk factors.
Taking stock of these considerations, the model used to project life expectancy
in this paper incorporates the various levels of uncertainty through blending an expert-based approach with a model based approach as described in detail in Appendix I by Garbero and Sanderson.
9 References
Adjuik, M. et al. 2006. Cause-specific mortality rates in sub-Saharan Africa and
Bangladesh. Bulletin of the World Health Organization 84(3): 181–188.
Alkema, L., A.E. Raftery, and S.J. Clark. 2007. Probabilistic projections of HIV
prevalence using Bayesian melding. The Annals of Applied Statistics 1(1): 229–248.
Angeles, L. 2010. Demographic transitions: analyzing the effects of mortality on
fertility. Journal of Population Economics 23(1): 99–120.
Auvert, B. et al. 2005. Randomized, controlled intervention trial of male circumcision
for reduction of HIV infection risk: The ANRS 1265 Trial. PLoS Med 2(11): e298.
Becker, G.S. and R.J. Barro. 1988. A reformulation of the economic theory of fertility.
The Quarterly Journal of Economics 103(1): 1–25.
Bongaarts, J.P., F. Pelletier, and P. Gerland. 2011. Global trends in AIDS mortality.
Pages 171–183 in R. G. Rogers and E. M. Crimmins, eds., International Handbook of Adult Mortality. International Handbooks of Population. Springer Netherlands.
Brown, T. et al. 2010. Modelling HIV epidemics in the antiretroviral era: the UNAIDS
estimation and projection package 2009. Sexually Transmitted Infections 86: ii3–ii10.
Buekens, P. and F. Althabe. 2010. Post-partum haemorrhage: beyond the confrontation
between misoprostol and oxytocin. The Lancet 375(9710): 176–178.
Caldwell, J.C. 1979. Education as a factor in mortality decline an examination of
Nigerian data. Population Studies 33(3): 395–413.
Coloma, J. and E. Harris. 2004. Innovative low cost technologies for biomedical
research and diagnosis in developing countries. BMJ : British Medical Journal 329(7475): 1160–1162.
Dalal, S. et al. 2011. Non-communicable diseases in sub-Saharan Africa: what we know
now. International Journal of Epidemiology 40(4): 885–901.
Farmer, P., M.C. Smith Fawzi, and P. Nevil. 2003. Unjust embargo of aid for Haiti. The
Lancet 361(9355): 420–423.
Feeney, G. 2001. The impact of HIV/AIDS on adult mortality in Zimbabwe. Population
and Development Review 27(4): 771–780.
Fortson, J.G. 2008. The gradient in Sub-Saharan Africa: socioeconomic status and
HIV/AIDS. Demography 45(2): 303–322.
Garbero, A. and W.C. Sanderson. 2012. Forecasting Mortality Convergence Up to
2100. Laxenburg, Austria: IIASA.
Garenne, M. 2010a. La récupération après les crises sanitaires: Etudes de cas sur les
tendances de la mortalité des jeunes enfants en Afrique sub-saharienne. in Chaire Quetelet 2010: Ralentissements, résistances et ruptures dans les
transitions démographiques. Paris: Institut de Recherche pour le Développement (IRD).
Garenne, M. 2010b. Urbanisation and child health in resource poor settings with special
reference to under-five mortality in Africa. Archives of Disease in Childhood 95(6): 464–468.
Garenne, M. and E. Gakusi. 2006. Health transitions in sub-Saharan Africa: overview of
mortality trends in children under 5 years old (1950-2000). Bulletin of the World Health Organization 84(6): 470–478.
Glynn, J.R. et al. 2004. Does increased general schooling protect against HIV infection?
A study in four African cities. Tropical Medicine & International Health 9(1): 4–14.
Graham, W. et al. 2004. The familial technique for linking maternal death with poverty.
The Lancet 363(9402): 23–27.
Gregson, S., H. Waddell, and S. Chandiwana. 2001. School education and HIV control
in sub-Saharan Africa: from discord to harmony? Journal of International Development 13(4): 467–485.
Haines, A. et al. 2006. Climate change and human health: impacts, vulnerability, and
mitigation. Lancet 367(9528): 2101–2109.
Helleringer, S. et al. 2013. Reporting errors in survey data on adult mortality: results
from a record linkage study in Senegal. Demography forthcoming.
Hemelaar, J. et al. 2006. Global and regional distribution of HIV-1 genetic subtypes and
recombinants in 2004. AIDS 20(16): W13–W23.
Hill, K. et al. 2012. Child mortality estimation: accelerated progress in reducing global
child mortality, 1990–2010. PLoS Med 9(8): e1001303.
Hill, K. 1987. Estimating census and death registration completeness. Asian and Pacific
Population Forum 1(3): 8–13, 23–24.
Hill, K., Y. Choi, and I. Timaeus. 2005. Unconventional approaches to mortality
estimation. Demographic Research 13: 281–300.
Hill, K. and J. Trussell. 1977. Further developments in indirect mortality estimation.
Population Studies 31(2): 313–334.
KC, S. and H. Lentzner. 2010. The effect of education on adult mortality and disability:
A global perspective. Vienna Yearbook of Population Research 8: 201–235.
Kunst, A.E. and J.P. Mackenbach. 1994. The size of mortality differences associated
with educational level in nine industrialized countries. American Journal of Public Health 84(6): 932–937.
Lee, R. 2003. Mortality forecasts and linear life expectancy trends. Social Insurance
Studies (3).
Mahy, M. et al. 2010. Estimating the impact of antiretroviral therapy: regional and
global estimates of life-years gained among adults. Sexually Transmitted Infections 86(Suppl 2): ii67–ii71.
Makinson, C. 1993. Estimates of adult mortality in Burundi. Journal of Biosocial
Science 25(02): 169–186.
Malkin, R.A. 2007. Design of health care technologies for the developing world. Annual
Review of Biomedical Engineering 9: 567–587.
Masquelier, B. 2013. Adult mortality from sibling survival data: a reappraisal of
selection biases. Demography 50(1): 207–228.
Masquelier, B. and A. Garbero. 2012. A familial approach to estimating education-
based differentials in adult mortality in developing countries. in 2012 Quetelet Seminar. Louvain-la-Neuve.
Masquelier, B., G. Reniers, and G. Pison. 2013. Divergences in child and adult
mortality trends in sub-Saharan Africa: evidence from survey data on the survival of children and siblings. Population Studies Forthcoming.
Mathers, C., T. Boerma, and D.M. Fat. 2008. The Global Burden of Disease: 2004
Update. Geneva: World Health Organization.
Mathers, C.D. et al. 2005. Counting the dead and what they died from: an assessment of
the global status of cause of death data. Bulletin of the World Health Organization 83: 171–177c.
McClure, E.M. et al. 2007. The use of chlorhexidine to reduce maternal and neonatal
mortality and morbidity in low-resource settings. International journal of gynaecology and obstetrics: the official organ of the International Federation of Gynaecology and Obstetrics 97(2): 89–94.
McMichael, A.J. et al. 2004. Mortality trends and setbacks: global convergence or
divergence? The Lancet 363(9415): 1155–1159.
Murray, C.J.L. et al. 2003. Modified logit life table system: principles, empirical
validation, and application. Population Studies 57(2): 165–182.
Mwansa-Kambafwile, J. et al. 2010. Antenatal steroids in preterm labour for the
prevention of neonatal deaths due to complications of preterm birth. International journal of epidemiology 39 Suppl 1: i122–133.
Network, I. 2005. An international network of field sites with continuous demographic
evaluation of populations and their health in developing countries. INDEPTH Network.
Omran, A.R. 1971. The epidemiologic transition. A theory of the epidemiology of
population change. The Milbank Memorial Fund quarterly 49(4): 509–538.
Over, M. and P. Piot. 1993. HIV infection and sexually transmitted diseases. Pages
455–527 in D. T. Jamison et al., eds., Disease Control Priorities in Developing Countries. New York: Oxford University Press.
Pamuk, E.R., R. Fuchs, and W. Lutz. 2011. Comparing relative effects of education and
economic resources on infant mortality in developing countries. Population and Development Review 37(4): 637–664.
Preston, S.H. 1983. An integrated system for demographic estimation from two age
distributions. Demography 20(2): 213–226.
Raftery, A.E. and L. Bao. 2010. Estimating and projecting trends in hiv/aids generalized
epidemics using incremental mixture importance sampling. Biometrics 66(4): 1162–1173.
Rajaratnam, J.K. et al. 2010. Worldwide mortality in men and women aged 15–59 years
from 1970 to 2010: a systematic analysis. The Lancet 375(9727): 1704–1720.
Reniers, G. and J. Eaton. 2009. Refusal bias in HIV prevalence estimates from
nationally representative seroprevalence surveys. AIDS (London, England) 23(5): 621.
Reniers, G., B. Masquelier, and P. Gerland. 2011. Adult mortality in Africa. Pages 151–
170 in R. G. Rogers and E. M. Crimmins, eds., International Handbook of Adult Mortality. International Handbooks of Population. Springer Netherlands.
Ross, C.E. and J. Mirowsky. 1999. Parental divorce, life-course disruption, and adult
depression. Journal of Marriage and the Family 61(4): 1034.
Ross, C.E. and J. Mirowsky. 2006. Sex differences in the effect of education on
depression: resource multiplication or resource substitution? Social science & medicine (1982) 63(5): 1400–1413.
Samir, K.C. et al. forthcoming. Data and methods. In W. Lutz, W. P. Butz, and K. C.
Samir, eds., World Population and Human Capital in the 21st Century. Oxford University Press.
Stover, J. et al. 2010. The Spectrum projection package: improvements in estimating
incidence by age and sex, mother-to-child transmission, HIV progression in children and double orphans. Sexually Transmitted Infections 86(Suppl 2): ii16–ii21.
Stover, J. et al. 2008. The Spectrum projection package: improvements in estimating
mortality, ART needs, PMTCT impact and uncertainty bounds. Sexually Transmitted Infections 84(Suppl 1): i24–i30.
Strand, L.B. et al. 2010. Vulnerability of eco-environmental health to climate change:
the views of government stakeholders and other specialists in Queensland, Australia. BMC Public Health 10(1): 441.
Tanser, F.C., B. Sharp, and D. le Sueur. 2003. Potential effect of climate change on
malaria transmission in Africa. Lancet 362(9398): 1792–1798.
Timaeus, I. 1987. Estimation of fertility and mortality from WFS household surveys.
Pages 93–128 in J. G. Cleland and C. Scott, eds., The World Fertility Survey: An Assessment. London: Oxford University Press.
Timaeus, I. and M. Jasseh. 2004. Adult mortality in Sub-Saharan Africa: evidence from
demographic and health Surveys. Demography 41(4): 757–772.
Torri, T. and J.W. Vaupel. 2012. Forecasting life expectancy in an international context.
International Journal of Forecasting 28(2): 519–531.
Trape, J.F. 2001. The public health impact of chloroquine resistance in Africa. The
American journal of tropical medicine and hygiene 64(1-2 Suppl): 12–17.
UNAIDS. 2010. Report on the Global AIDS Epidemic. Geneva: UNAIDS.
UNICEF. 2012. Levels & trends in child mortality: estimates developed by the UN
Inter-agency Group for Child Mortality Estimation. New York: UNICEF.
United Nations. 1982. Model Life Tables for Developing Countries. New York: United
United Nations. 2011a. United Nations Expert Group Meeting on Mortality Crises:
Conflicts, Violence, Famine, Natural Disasters and the Growing Burden of Non-communicable Diseases, Report of the Meeting. New York: Department of Economic and Social Affairs Population Division.
United Nations. 2012. World Mortality Report 2011. New York: Department of
Economic and Social Affairs Population Division.
United Nations. 2005. World Population Prospects: The 2004 Revision. New York:
Department of Economic and Social Affairs, Population Division.
United Nations. 2011b. World Population Prospects: The 2010 Revision. New York:
Department of Economic and Social Affairs, Population Division.
United Nations. 2011c. World Population Prospects: The 2010 Revision, Highlights and
Advance Tables. New York: Department of Economic and Social Affairs, Population Division.
Waltisperger, D. and F. Meslé. 2005. Crise économique et mortalité: Le cas
d'Antananarivo 1976-2000. Population Vol. 60(3): 243–275.
Waltisperger, D. and F. Meslé. 2007. Economic crisis and changes in mortality due to
infectious and parasitic diseases in antananarivo, madagascar. Pages 79–99 in HIV, Resurgent Infections and Population Change in Africa. Springer.
Wang, H. et al. 2012. Age-specific and sex-specific mortality in 187 countries, 1970–
2010: a systematic analysis for the Global Burden of Disease Study 2010. The Lancet 380(9859): 2071–2094.
Winikoff, B. et al. 2010. Treatment of post-partum haemorrhage with sublingual
misoprostol versus oxytocin in women not exposed to oxytocin during labour: a double-blind, randomised, non-inferiority trial. The Lancet 375(9710): 210–216.
World Health Organization. 2010. Countdown to 2015 Decade Report (2000-2010).
Washington, D.C.: World Health Organization.
World Health Organization. 2011. Disease and Injury Country Estimates. Geneva:
World Health Organization.
World Health Organization. 1992. International Statistical Classification of Diseases
and Related Health Problems (ICD 10) 10th Ed. Geneva: World Health Organization.
World Health Organization. 2006. Scientific Working Group Report on Dengue.
Geneva: World Health Organization.
You, D., G. Jones, and T. Wardlaw. 2011. Level of Trends in Child Mortality: Report
2011. New York: United Nations Children's Fund.
Zajacova, A. 2006. Education, gender, and mortality: does schooling have the same
effect on mortality for men and women in the US? Social Science & Medicine 63(8): 2176–2190.
Zhao, Z. 2011. Adult mortality in Asia. Pages 133–150 in R. G. Rogers and E. M.
Crimmins, eds., International Handbook of Adult Mortality. International Handbooks of Population. Springer Netherlands.
Appendix
List of arguments for assessing future mortality trend in high-mortality countries
Module 1: Changes in Bio-medical Technology
Improvements in medical technology will contribute to declining mortality
Medical care will improve due to therapeutic and diagnostic devices developed specifically for low resource areas
There will be little financial incentive for private pharmaceutical companies to invest in research and development (R&D) for new treatments for neglected diseases
Investing in education and in-country research will favor in-country development of appropriate biomedical technology
Module 2: Health Care Systems
Low cost access to essential medicines for broad segments of the population will improve
Increasing user fees for medical services will restrict access to effective and timely treatment
Public-private partnerships will be created for development and implementation of successful health strategies
Basic public health and nutrition interventions (e.g., immunization, breastfeeding, vitamin A supplementation and safe drinking water) will be expanded to cover more children under the age of 5
Coverage of inexpensive interventions against diarrhea, pneumonia and malaria will be expanded
Delivery of reproductive health services, including antenatal care services and family planning programs, will be extended
Competing demands will reduce government spending for health care systems
Investments in education will increase the quality of health personnel
Module 3: Behavioral Changes
Sedentary lifestyles and changes in diet leading to chronic disease risk will increase
Tobacco consumption will decrease
Substance abuse (alcohol and drugs) will increase
Health-enhancing behaviors will spread widely due to mass communication
Investments in education will lead people toward more health-inducing behaviors
Module 4: Infectious Diseases
There will be an increase in new infectious diseases
There will be increasing drug resistance to known infectious diseases
Increasing standard of living, hygiene and nutrition will improve host-resistance to communicable diseases
Investments in education will increase capability of early detection and control to contain the spread and impact of new infectious diseases
Module 5: Environment, Disasters and Wars
The frequency and intensity of natural disasters (such as flooding and strong storms) will increase
Global warming will lead to an expansion of the malaria zone
Higher temperature variations will lead to increased diarrheal disease incidence
Indoor air pollution due to utilization of solid fuels, including biomass (wood, dung and crop residues) and coal, will decrease
Chemical and nuclear contamination will be a major health threat in the future
There will be more violent civil unrest and wars
Better education will contribute to decreasing vulnerability to climate change
Module 6: Population Differentials
Increased social inequality will lead to higher prevalence of poverty, distrust, violence and crime
Investing in education will favour upward social mobility and reduce poverty
Gender inequalities will decline and will lead to narrowing health gaps between men and women
Improvements in the education of women will improve the health of children
Health and social services in urban areas will not keep pace with urban population growth
Mortality differentials by level of education will diminish
Module 7: HIV/Aids
Effective vaccines towards HIV and AIDS and TB will be developed within 20 years
Anti-retroviral treatment will be effectively implemented to meet the needs of populations living in resource-poor settings
Risky sexual behaviors will impede progress towards reducing the risk of HIV and sexually transmitted infections (STDs)
HIV infection rates will decline most among people with primary and post-primary education
More education (not just sexual education but also basic education) will favor better prevention and adherence to treatment
Source: http://pure.iiasa.ac.at/10743/1/IR-13-017.pdf
The combined effects of L-theanine andcaffeine on cognitive performance and mood Gail N. Owen1, Holly Parnell1, Eveline A. De Bruin2, Jane A. Rycroft1 1Unilever Research and Development, Colworth House, Sharnbrook, Bedford, UK 2Unilever Food and Health Research Institute, Unilever R&D Vlaardingen, The Netherlands The aim of this study was to compare 50 mg caffeine, with and without 100 mg L-theanine, oncognition and mood in healthy volunteers. The effects of these treatments on word recognition,rapid visual information processing, critical flicker fusion threshold, attention switching and moodwere compared to placebo in 27 participants. Performance was measured at baseline and again 60min and 90 min after each treatment (separated by a 7-day washout). Caffeine improved subjectivealertness at 60 min and accuracy on the attention-switching task at 90 min. The L-theanine andcaffeine combination improved both speed and accuracy of performance of the attention-switchingtask at 60 min, and reduced susceptibility to distracting information in the memory task at both 60min and 90 min. These results replicate previous evidence which suggests that L-theanine andcaffeine in combination are beneficial for improving performance on cognitively demanding tasks.
Este trabajo se ha realizado con la colaboración de Enrique Gómez Bastida Director de la Agencia Española de Protección de la Salud en el Deporte. Felipe Trigo Romero Presidente del Colegio Oficial de Farmacéuticos de Cádiz (hasta el 28 de mayo de 2015)y Vicepresidente del Consejo General de COF (hasta el 24 de junio de 2015) Francisco Vallejo Pérez de la Blanca Director Técnico del Colegio Oficial de Farmacéuticos de Cádiz


