Topic: a, b, c, d, e or f

The Second TSME International Conference on Mechanical Engineering
19-21 October, 2011, Krabi
Investigation of Load Profiles of Lithium-ion batteries
for Electric Vehicle Applications
Chadchai Srisurangkul
National Metal and Materials Technology Center, 114 Thailand Science Park, Phahonyothin Rd. Klong 1, Klong Luang,
Pathumthani 12120 Thailand
*Cor esponding Author: Tel: +66 2 564 6500 ext. 4731, Fax: +66 2 564 6332,
E-mail: [email protected]
Abstract
Vehicle electrification become and continues to be the major trend in the automotive industry and
a main part of this is batteries. Unfortunately the battery testing presently does not represent the real-
world condition, in which the bat ery load profile comprises complex charge-discharge wave. Therefore in
this study, the load profile of bat eries for electric vehicles was investigated. An integrated simulation and
testing approach is used to predict the bat ery load. In simulation the bat ery load profile is calculated
based on the utilization of vehicle and battery model. The present vehicle and bat ery model are
developed using a vehicle dynamics technique and equivalent circuit modeling technique respectively,
whereas the model development is focused on a specific vehicle which converts conventional propulsion
into pure electric propulsion. The results are demonstrated through the current profile of advanced
bat eries subjected to standard driving cycles. With this approach, the battery loads correspond to actual
driving condition or any driving cycle can be predicted and can be used for bat ery testing. This creates a
new aspect to evaluate advanced bat eries for power train application.
Keywords: Current Profile, Vehicle Modeling, Bat ery Modeling, Driving Cycle
1. Introduction
some bat ery parameters but still not suite to
All major car manufacturers are planning
investigate, for example, the bat ery life or heat
to bring out electric cars in the near future. This
generation. It is not suitable to use as tool for
trend drives the development of high power
design bat ery subsystem such as bat ery
bat eries such as lithium-ion bat eries. Although
thermal management.
lithium-ion bat eries are widely used for electric
This paper describes an approach to
vehicles, there is no testing standard for those
determine the bat ery load profile comprising
bat eries [10]. The bat ery test profiles presently
complex charge-discharge wave from real-world
base on constant current or step response
technique which does not represent the real-
world condition. They may be used to investigate

The Second TSME International Conference on Mechanical Engineering
19-21 October, 2011, Krabi
2. Vehicle Dynamics Modeling
speed, x is the vehicle speed, and Jred is the
The vehicle dynamic model can be
reduced mass moment of inertia at wheel.
derived from Newton's second law considering
The vehicle considered in this work is
all the forces applied upon the vehicle. It should
the two year used HONDA Jazz that will be
be noted that only the longitudinal dynamic is
converted to a pure electric vehicle. The existing
sufficient to investigate the bat ery load profile.
engine will be replaced with a 40kW new
With this the complex and uncertain parameters
developing motor. The vehicle uses a 100 cell
as well as the simulation time can be reduced.
lithium-ion bat ery (type: LiFeYPO4) as power
The total resistance forces acting on the
source. The total capacity is 60Ah. The vehicle
vehicle are rolling resistance, aerodynamic
uses the original transmission modified to use
resistance, and grade resistance force, as
the 3rd gear ratio. The vehicle specification is
demonstrated in Fig. 1.
shown in Table 1. Table. 1 Vehicle specification
Value/Description
2 Weight distribution 62/38 (%)
4 Drag coef icient
Fig. 1 Resistance force acting on the
Hence, the vehicle dynamic equation
can be obtained as
3.461, 1.869, 1.303
F F
F F F Eq. (1)
8 Final drive ratio
F mg( f f x)sgn(x) mgsin
A (x x )2 sgn(x) (m
continuous power
roll is rolling resistance, Fad is the
aerodynamic resistance, F
resistance, m is the vehicle mass, g is the
12 Battery Capacity 60 (Ah)
natural acceleration, is the angle of grade, f
13 Number of cells
14 Battery weight
1 are the rolling coef icients, is the air
density, Cd is the aerodynamic drag coef icient,
Af is the vehicle frontal area, x is the wind
simulations there are various types of
mathematical models available. In this work the

The Second TSME International Conference on Mechanical Engineering
19-21 October, 2011, Krabi
vehicle model was created by using a transient effort-flow refer to [1]. Ef ort-flow in the model refers to the combinations of torque/angular speed, force/velocity and voltage/current.
The basic configuration of the electric
vehicle used for simulation is illustrated in Fig. 2. Overall system is modeled in a MATLAB/ Simulink environment.
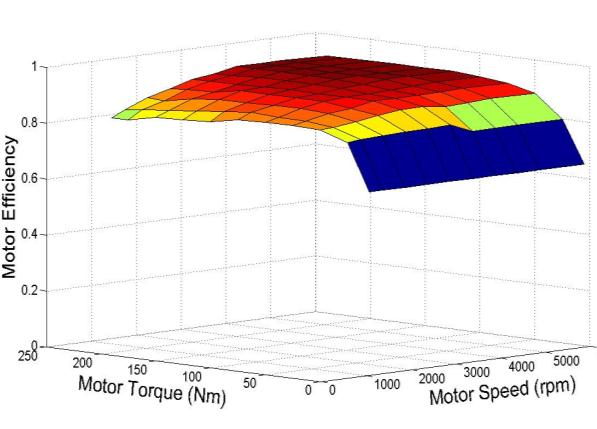
Fig. 3 Efficiency map of the electric motor
3. Battery Modeling
3.1. Battery Model
A bat ery model calculates the bat ery
variables like current, voltage, and the battery
temperature. The bat ery is modeled as an equivalent circuit with a bat ery internal
resistance, as shown in Fig. 4. The model uses
Fig. 2 Electric vehicle configuration
data from experiment described in the next
Vehicle system models typically contain
a mix of empirical data, engineering assumptions, and physical based parameter and
algorithms. Driven by the need for fast
simulation times, complex components such as motor are typically simulated using empirical data in form of lookup maps. For example, the
electric motor is modeled using an efficiency
map handled as a 2-D lookup table indexed by
Fig. 4 Bat ery Model
rotor speed and torque. This map is generally
The model consists of voltage source
obtained via experiments. In our case the
generating an open-circuit voltage (OCV) and a
efficiency map of electric motor is unknown
resistor representing the internal resistance (R).
because the motor is presently constructing.
Both parameters can be described as a function
Therefore the scaling of torque to provide the
of state of charge (SOC) and temperature. The
required maximum power has been done. This
internal resistance is considered separately
type of scaling is valid only for the same motor
between charge and discharge process.
type and in the neighborhood near the actual
The state of charge was estimated by
parameter. The efficiency map of the electric
coulomb counting (current based SOC
motor is shown in Fig. 3.
estimation). The SOC is obtained by measuring
the current flowing into and out of a battery and


The Second TSME International Conference on Mechanical Engineering
19-21 October, 2011, Krabi
integrating this current over time and then
The system consists mainly of power
subtracting it from the charge in a fully charged
supply and electronic load which connected to
bat ery [4]. The other methods of SOC
PC via GPIB. The output voltage range and the
determination can be found in [5].
maximum current rating of those machines are
The temperature is obtained by using
0-60Vdc and 120A respectively. Labview was
bat ery thermal model which describes the heat
used to define the test procedure and log data.
transfer process. The heat is generated from
The tested specimen is a 5 cell series
bat ery due to electrochemical reactions and
connected LiFeYPO4 with a capacity of 60 Ah.
resistive heating which causes increased bat ery
The bat ery core is covered by poly-propylene
temperature [6]. In practice the heat dissipation
case which has low thermal conductivity. During
is best estimated from values of the current and
the test the bat ery was placed in a temperature-
voltage [7], according to
control cabinet. The test cycles is shown in Fig.
where V is the instantaneous cell potential, Voc is
the open-circuit voltage.
The heat dissipation is conducted from
the internal bat ery to the bat ery case and then
convected from the case's surface to the air.
3.2. Experiment Setup
To characterize battery parameters for
its model, the step response technique [8] was
employed. The tests were carried out on the
Deep of Discharge, DoD (%)
testing system as shown in Fig. 5.
Fig. 6 Bat ery test cycle as function of DoD
Fig. 7 Bat ery test cycle as function of time
The test started with the discharge
Fig. 5 Testing system configuration
process. For each test cycle the constant current
of 0.5C (30A) is applied and was paused for one
The Second TSME International Conference on Mechanical Engineering
19-21 October, 2011, Krabi
minute at every 10% change in state of charge.
4. Simulation
Measurements were taken every 200ms. The
4.1 Driving Cycle and Battery Load Cycle
test was performed at temperature of 5°C, 25°C
Through the battery load profile of real-
and 40°C. Some initial cycles were applied to
world driving cycles is the aim of this work, the
ensure that the bat ery reaches stable behavior.
standard driving cycles with transient
The voltage response during the pause
characteristic was used to test our model. The
period is used in order to determine the battery
transient cycles give more dynamic changing in
internal resistance. An example of the voltage
load and are based upon real-world data. UDDS,
response during pause period is shown in Fig. 8.
NYCC and CSC cycles are three examples of
transient driving cycle used to define the bat ery
load profile. They were chosen because they are
based upon real-world driving and content a high
portion of with non-aggressive urban and
suburban routes that are suitable for electric
vehicles. UDDS cycle describes an urban route
with cold start and transient phase, NYCC cycle
represents an urban route through New York
Fig. 8 Example of the voltage response
and CSC cycle describes a city suburban route
with lower average speed than UDDS cycle. Fig.
1, V2, and V3 in Fig. 8 are easily measured.
Both the resistance and the open-circuit voltage
10 shows UDDS cycle as an example.
(OCV) are assumed to be constant over the
pulse period. Voltage dif erent at the beginning
of the pulse is also assumed at the end of the
pulse. The internal resistance after analysis the
test data is shown in Fig. 9. For other methods
for resistance estimation can be found in [11].
Fig. 10 An example UDDS cycle
A bat ery load profile used by the
vehicle can be determined by using one of these
driving cycles as an input to the simulation. The
load profile results are shown in Fig. 11-13. The
simulation was set up with a full battery and a
temperature of 25°C.
Deep of Discharge, DoD (%)
Fig. 9 Internal resistance in case of discharge
The Second TSME International Conference on Mechanical Engineering
19-21 October, 2011, Krabi
the vehicle dynamic simulation must be filtered
while still maintaining the typical load
characteristic. The filter model with filter and
stair-step function was developed for this
purpose. It performs an online analysis to meet
the requirement of hardware in the loop
simulation in the future. Fig. 14 shows a close
up view of a portion of the filtered and unfiltered
Fig. 11 Battery load profile, UDDS
load profile for UDDS cycle.
Fig. 14 Unfiltered and filtered battery load profile
Fig. 12 Bat ery load profile, NYCC
The peak current of unfiltered and
filtered profile are 95.06 A and 96 A, while the
average current are 18.85 A and 18.64 A
respectively. This guarantees correctness and
stability of the filter model.
Fig. 15-17 shows the distribution of the
filtered bat ery load profile for all three driving
Fig. 13 Bat ery load profile, CSC
4.2 Cycle Filtration
In the practice the high dynamic load
cannot use directly due to the limited capability
of bat ery testing machines. To enable the use
of widely available battery testing machines the
minimum sampling period of load profile for input
to the testing machine should be 2 seconds and
the profile should be rectangular wave. To meet
Filtered battery current (A)
these requirements the battery load profile from
Fig. 15 Load distribution of UDDS cycle
The Second TSME International Conference on Mechanical Engineering
19-21 October, 2011, Krabi
been done to provide input parameters for the
The vehicle dynamic model and the
bat ery model are a core of this vehicle system
simulation. In the vehicle dynamic model only
the longitudinal dynamic is sufficient to
investigate the battery load profile, while an equivalent circuit with an internal resistance is
considered in the bat ery model.
Filtered battery current (A)
The experiment has been conducted to
Fig. 16 Load distribution of NYCC cycle
get the bat ery properties. The test methodology
relies on the current pulse relaxation technique
to determine the battery characteristics.
Accordingly, using this methodology, the
bat ery load profile correspond to actual driving
condition or any driving cycle can be predicted
and can be used for bat ery testing. This creates
a new aspect to evaluate advanced batteries for
power train application.
6. References
Filtered battery current (A)
Fig. 17 Load distribution of CSC cycle
[1] Gao, D.W., Mi, C. and Emadi, A. (2007).
All three driving cycles have the most
Modeling and Simulation of Electric and Hybrid
common current value with in the same range.
Vehicles, Proceedings of the IEEE, vol.95(4),
For UDDS cycle the bat ery current varies widely
April 2007, pp. 729 – 745.
between -15 and 96 A, whereas the most
[2] Johnson, V.H., Pesaran, A.A. (2000).
common value lies between 2 to 6 A. NYCC and
Temperature-Dependent Battery Models for
CSC cycles show narrower current distribution
High-Power Lithium-Ion Batteries, paper
than the UDDS cycle. The vehicle takes current
presented in the 17thElectric Vehicle Symposium,
from the bat ery at 2 to 6 A through about half of
Montreal, Canada.
[3] Johnson, V.H. (2002). Battery performance
5. Conclusion
models in ADVISOR, Journal of Power Sources,
The present paper examined the bat ery
vol.110, pp. 321 – 329.
load profile of a vehicle driving in the real world.
[4] Bergveld, H.J., Kruijt, W.S., Notten, P.H.L.
To predict the bat ery load a vehicle system
(2002). Battery Management Systems: Design by
simulation was developed while many tests have
Modelling, Philips Research Book Series Volume 1, ISBN: 1402008325, Springer
The Second TSME International Conference on Mechanical Engineering
19-21 October, 2011, Krabi
[5] Pop, V., Bergveld, H.J., Danilov, D., Regtien,
[9] Duvall, M.S. (2005). Battery Evaluation for
P.P.L., Notten, P.H.L. (2008). Battery
Plug-In Hybrid Electric Vehicles, Vehicle Power
Management Systems: Accurate State-of-Charge
and Propulsion, IEEE Conference, pp. 338 –
Indication for Battery-Powered Applications,
Philips Research Book Series Volume 9, ISBN:
[10] Morita, K., Akai, M., Hirose, H. (2009).
1402069448, Springer
Development of Cycle Life Test Profiles of
[6] Pesaran, A.A. (2002). Battery thermal models
Lithium-ion Batteries for Plug-in Hybrid Electric
for hybrid vehicle simulations, Journal of Power
Vehicles, EVS24 International Battery, Hybrid
Sources, vol.110, pp. 377 – 382.
and Fuel Cell Electric Vehicle Symposium
[7] PCM Thermal Control of Nickel-Hydrogen
[11] Schweiger, H.G., Obeidi, O., Komesker, O.,
Batteries, Division of Technical Services and
Raschke, A., Schiemann, M., Zehner, C.,
Planning, PL-TR-93-1075, Energy Science
Gehnen, M., Keller, M., Birke, P. (2010),
Laboratories Inc., Final Report 1993
Comparison of Several Methods for Determining
[8] Doerffel, D. (2007). Testing and
the Internal Resistance of Lithium Ion Cells,
Characterisation of Large High-Energy Lithium-
Sensors 2010, 10, ISSN 1424-8220, pp. 5604 –
Ion Batteries for Electric and Hybrid Electric
Vehicles, PhD Thesis, University of Southampton
Source: http://rcme.engr.tu.ac.th/TSME-ICoME%20Web/full_paper_file/ETM/ETM18%20920-1611-1-RV.pdf
Vol. 7 No. 1 is new AHMOPI President By : Camille "Camry" T. Silos IntelliCare Chairman level-playing field for all and President, Mario M. Silos, companies who are a part ofis the newly-elected president of AHMOPI to compete with eachthe Association of Health other without undue advantageMaintenance Organizations of or disadvantages, as well asthe Philippines, Inc. (AHMOPI). providing a venue where theIt is a non-stock and non-profit members can give advice toumbrella organization composed other members in the associationof all the major HMOs and other and discuss various relevantsimilarly-engaged pre-paid topics with each other. Lastly,healthcare companies in the AHMOPI is a vehicle by whichcountry.
RASHMI DESHMUKH, MD KATHLEEN FRANCO, MD* Department of Psychiatry and Psychology, Head, Section of Consultation-Liaison The Cleveland Clinic Psychiatry, Department of Psychiatry andPsychology, The Cleveland Clinic Managing weight gain as a sideeffect of antidepressant therapy ■ A B S T R AC T EIGHT GAIN IS A SERIOUS concern for


