4a.zqu.edu.cn

This article was published in an Elsevier journal. The attached copy
is furnished to the author for non-commercial research and
education use, including for instruction at the author's institution,
sharing with colleagues and providing to institution administration.
Other uses, including reproduction and distribution, or selling or
licensing copies, or posting to personal, institutional or third party
websites are prohibited.
In most cases authors are permitted to post their version of the
article (e.g. in Word or Tex form) to their personal website or
institutional repository. Authors requiring further information
regarding Elsevier's archiving and manuscript policies are
encouraged to visit:

Author's personal copy
Journal of Chromatography A, 1163 (2007) 333–336
Short communication
Separation of seven fluoroquinolones by microemulsion electrokinetic
chromatography and application to ciprofloxacin, lomefloxacin
determination in urine
Shoulian Wei a,b, Jiesheng Lin a, Haifang Li b, Jin-Ming Lin b,∗
a Department of Light Industry & Chemistry, Zhaoqing University, Zhaoqing 526061, China
b Department of Chemistry, Tsinghua University, Beijing 100084, China
Received 5 June 2007; received in revised form 26 June 2007; accepted 28 June 2007
Available online 30 June 2007
A simple, reliable microemulsion electrokinetic chromatography (MEEKC) method is developed for the simultaneous separation of seven
fluoroquinolones (FQs). The best separation is achieved in a carrier electrolyte containing 1% (v/v) heptane, 100 mmol/L sodium dodecyl sulfate(SDS), 10% (v/v) 1-butanol, and 8 mmol/L phosphate–sodium tetraborate buffer at pH 7.30. The proposed method was directly applied to thedetermination of ciprofloxacin (CPF) and lomefloxacin (LMF) in urine samples of subjects administered either with CPF or LMF.
2007 Elsevier B.V. All rights reserved.
Keywords: Microemulsion electrokinetic chromatography; Fluoroquinolones; Ciprofloxacin; Lomefloxacin
MEEKC [12] is a relatively new CE technique that often
provides higher resolving power. In this study, we develop a
In generally, following oral administration, fluoroquinolones
selective MEEKC method for the separation of CPF, LMF,
(FQs) are rapidly and completely absorbed from the gastroin-
norfloxacin (NF), ofloxain (OF), fleroxacin (FL), gatifloxacin
testinal tract and reach the maximal plasma concentration in
(GTF) and sparfloxacin (SPF) and determination of CPF or LMF
1–2 h [1–3]. But how long it takes to reach the maximal urine
in urine samples.
concentration has not been investigated, and this may be usefulto know in clinical pharmacology. Therefore, there is a neces-
sity to develop analytical methods that would allow the directlydetermination of FQs in urine and make it suitable for routine
analysis in clinical laboratories.
Several techniques such as spectrophotometry [4], spec-
A separation was performed with a Beckman (Fullerton CA,
trofluorometry [5], electrochemical detection [6], flow-injection
USA) PACE/MDQ capillary electrophoresis system. 32 Karat
chemiluminescence [7], capillary electrophoresis (CE) [8] and
Software V.7.0 was used for instrument control and data analysis.
high-performance liquid chromatography (HPLC) [9–11] have
An untreated fused-silica capillary of 56.9 cm (46.6 cm from
been developed for the determination of FQs in urine sam-
inlet to detector) × 75 m I.D. (Yongnian Optical Fiber Factory,
ples. However, the literature available on determination of FQs
Hebei, China) was used. The detection wavelength was 280 nm.
in urine is very short and commonly suffers from long pre-
Samples were injected by applying a pressure of 3.4 kPa for 5 s.
treatment of the samples and low resolving power.
2.2. Chemicals and materials
All chemicals were of analytical grade. SDS was obtained
∗ Corresponding author. Tel.: +86 10 62792343; fax: +86 10 62792343.
from Sigma (St. Louis, MO, USA). CPF, LMF, OF and NF were
E-mail address: [email protected] (J.-M. Lin).
obtained from the Institute to Pharmaceutical and Biomaterial
0021-9673/$ – see front matter 2007 Elsevier B.V. All rights reserved.
doi:10.1016/j.chroma.2007.06.052
Author's personal copy
S. Wei et al. / J. Chromatogr. A 1163 (2007) 333–336
Authentication of China (Beijing, China). GTF, FL and SPFwere kindly donated by the Institute to Pharmaceutical and Bio-material Authentication of Zhaoqing (Guangdong, China). CPFand LMF tablets were purchased from local drugstore.
2.3. Standard solutions
Stock solutions of NF, CPF, OF, LMF, SPF, FL and GTF
(1.0 × 10⁻³ mol/L) were prepared using 0.01 mol/L NaOH andstored under light-protecting condition at 4 ◦C. Standard work-ing solutions were daily prepared by mixing and diluting thestock solution in water.
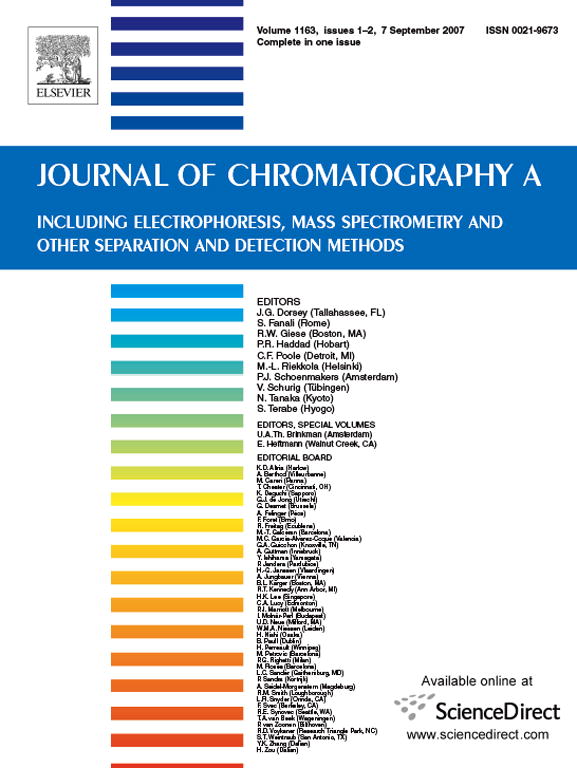
Fig. 1. MEEKC electropherogram of FQs standard mixture each at
2.4. Preparation of the microemulsion
5.0 × 10⁻⁵ mol/L (except for OF: 1.0 × 10⁻⁵ mol/L). Separation condi-tions: 1% (v/v) heptane + 100 mmol/L SDS + 10% (v/v) 1-butanol + 8 mmol/L
The microemulsion was prepared by adding 1% (v/v) hep-
phosphate–sodium tetraborate buffer at pH 7.30. The applied voltage was 22 kV,temperature was 20 ◦C. Peaks: 1 = FL; 2 = LMF; 3 = OF; 4 = GTF; 5 = CPF;
tane, 10% (v/v) 1-butanol, 2.88 g (100 mmol/L) SDS, 0.125 g
6 = NF; 7 = SPF.
(8 mmol/L) sodium phosphate (NaH2PO4·2H2O) to a 100 mLflask. This mixture was sonicated for 30 min to aid dissolution
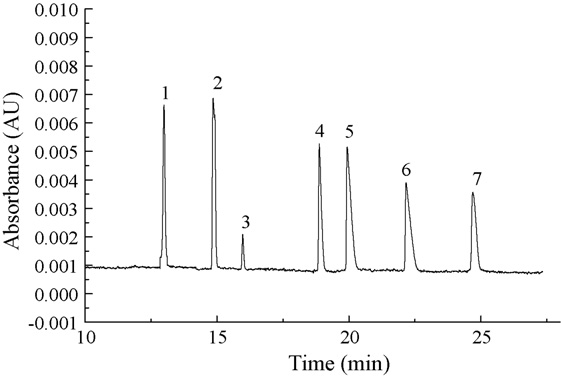
independent sources of drug-free urine. No interfering peaks in
and an optically transparent microemulsion had formed. Before
the retention time of CPF, LMF were observed in blank drug-free
use, the microemulsion solutions were filtered through a 0.45-
m filter and degassed in an ultrasonic bath for 1 min. The bufferwas adjusted to pH 6.0–9.0 with 50 mM sodium tetraborate, if
3.2. Linearity of the method and limits of detection and
2.5. Sample preparation
The calibration curves were constructed using response
of peak areas (y) versus the urine sample concentra-
2.5.1. Drug administration
tion (x, mol/L). The calibration curves for LMF and
Eight healthy males and females adult volunteers were partic-
CPF in the range of 1.2 × 10⁻⁶ − 5.0 × 10⁻⁴ mol/L were:
ipated in the study. All subjects were healthy on the basis of their
y = 1.93 × 10⁹x + 8.55 × 10³, and y = 9.82 × 10⁸x + 3.58 × 10³,
medical history, clinical and laboratory examination. After the
with r = 0.9987 and r = 0.9972, respectively. The detection lim-
overnight fast, one 500 mg CPF tablet or LMF tablet of the test
its (LODs, S/N = 3) were 0.95 and 0.97 mol/L for LMF and
was administered orally. The urine samples were respectively
CPF, respectively. The quantification limits (LOQs, S/N = 9)
collected at 0, 0.75 (0.5), 1.75 (1.5), 3.75 (2.75), 4.25(3.75), 5.25
were 2.85 and 2.91 mol/L for LMF and CPF, respectively.
(4.5), 5.75 (5.5), 6.25 (6.0), 6.75 (7.0), 8.5 (8.0), 12.0 (12.0) hand stored at −20 ◦C until analysis.
3.3. Precision and accuracy
2.5.2. Urine
Precision and accuracy were assessed for LMF and CPF at
The frozen urine samples were thawed at room temperature
three concentrations covering the linearity range (six replicate
and centrifuged at 3500 × g for 15 min. The supernatants were
analyses at each level during 5 consecutive days) by spiked urine.
transferred to clean glass tube and filtrated through a 0.45 m
The intra-day and inter-day precision were <5.0% and <7.0%,
filter, and directly injected into the electrophoresis system.
3. Results and discussion
3.1. MEEKC profiles
The standard microemulsion conditions [0.81% (w/w) hep-
tane, 6.61% (w/w) 1-butanol, 3.31% (w/w) SDS, and 89.27%(w/w) 10 mmol/L sodium tetraborate buffer] were taken as thestarting point and performed a series of optimizations. The pHwas a critical factor in a series of optimizations. Thus, a pH inter-val of 7.0–9.5 was investigated. The best separation was achievedin a carrier electrolyte containing 1% (v/v) heptane, 100 mmol/LSDS, 10% (v/v) 1-butanol, and 8 mmol/L phosphate–sodiumtetraborate buffer at pH 7.30. Figs. 1 and 2 show the optimized
Fig. 2. Electropherograms of a blank drug-free pooled urine; Analytical condi-
MEEKC separation of a standard solution of all seven FQs and
tions were as for Fig. 1.
Author's personal copy
S. Wei et al. / J. Chromatogr. A 1163 (2007) 333–336
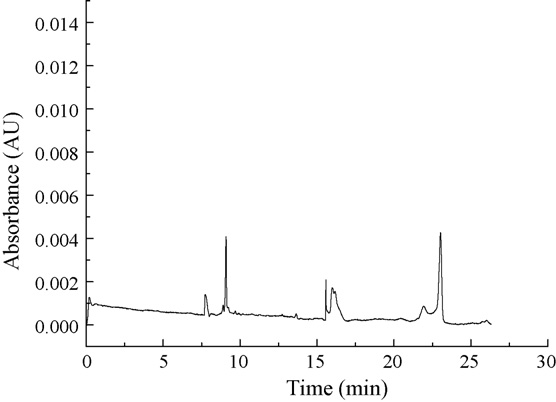
Fig. 3. Electropherograms of: (A) urine 0.75 h and (B) 3.75 h after oral administration of one tablet with 500 mg CPF; (C) urine 4.0 h after oral administration of onetablet with 500 mg LMF. Analytical conditions were as for Fig. 1. Peaks 1, 2 and 3 were probably CPF metabolites.
respectively, for LMF and CPF. The intra-day and inter-dayaccuracy were in the range of 99.0–104.0% and 100.0–105.5%,respectively, for LMF and CPF. The above results indicated thatthe method was reliable, reproducible and accurate.
3.4. Urine samples
The proposed method was applied to determination of CPF
and LMF in urine samples. Fig. 3A and B shows an electro-pherogram of one healthy volunteer after oral administration of500 mg CPF tablet, collected at 0.75 h and 3.75 h, respectively.
Comparing the electropherogram obtained in Fig. 2, three newpeaks respectively at tR = 17.60 min, 19.72 min and 20.53 min
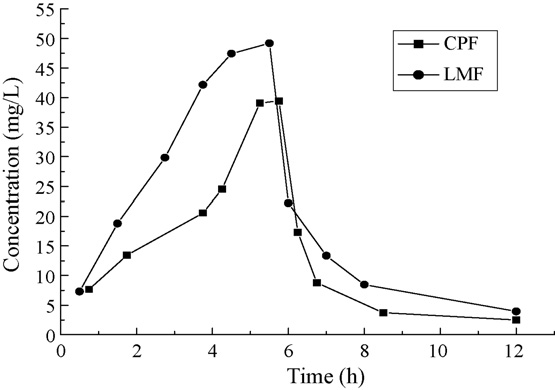
Fig. 4. Urine concentration–time profiles after oral administration of one tablet
can be observed in Fig. 3A and B. Their areas changed with the
with (A) 500 mg CPF, (B) 500 mg LMF.
collection time and their spectra concordance with CPF. There-fore, Peaks 1, 2 and 3 were probably CPF metabolites. Fig. 3C
results may be useful in clinical pharmacology for detecting the
shows an electropherogram of another healthy volunteer after
efficacy and side effects of LMF and CPF.
oral administration of 500 mg LMF tablet, collected at 3.75 h.
Comparing the electropherogram obtained in Fig. 1 and Fig. 2,
few differences in migration times can be observed. These aredue to the time taken to remove the sample matrix from the
This work was supported by the Program for Changjiang
capillary, since the sample matrix is different.
Scholars and Innovative Research Team in Tsinghua University
The urine concentration–-time profile of two healthy human
(No. IRT0404) and the National Key Technology R & D Program
volunteer after respectively receiving one table with 500 mg
CPF and LMF were shown in Fig. 4. The concentration ofCPF and LMF in the urine respectively reached a maximum
value of 39 mg/l and 49 mg/L after about 5 h oral administra-tion. Twelve hours after oral administration, the concentration
[1] T. Nekvindov´a, J. Suchop´ar, Remedia 4 (1993) 206.
of CPF and LMF in the urine was, respectively, 2.5 mg/L and
[2] K.G. Nabe, Chemotherapy 42 (1996) 1.
3.9 mg/L, which corresponded to a rapid elimination. The above
[3] A.E. Struck, D.K. Kim, F.J. Frey, Clin. Pharmacokinet. 22 (1992) 116.
Author's personal copy
S. Wei et al. / J. Chromatogr. A 1163 (2007) 333–336
[4] M. Jelikic-Stankov, J. Odovic, D. Stankov, P. Djurdjevic, J. Pharm. Biomed.
[9] S. Husain, S. Khalid, V. Nagaraju, R.N. Rao, J. Chromatogr. A 705 (1995)
Anal. 18 (1998) 145.
[5] L.M. Du, Y.Q. Yang, Q.M. Wang, Anal. Chim. Acta 516 (2004) 237.
[10] G.J. Krol, G.W. Beck, T. Benham, J. Pharm. Biomed. Anal. 14 (1995)
[6] M. Rizk, F. Belal, F.A. Aly, N.M. El-Enany, Talanta 46 (1998) 83.
[7] Y.D. Liang, J.F. Song, X.F. Yang, Anal. Chim. Acta 510 (2004) 21.
[11] A. Zotou, N. Miltiadou, J. Pharm. Biomed. Anal. 28 (2002) 559.
[8] C. Fierens, S. Hillaert, W.V.D. Bossche, J. Pharm. Biomed. Anal. 22 (2000)
[12] K.D. Altria, P.-E. Mahuzier, B.J. Clark, Electrophoresis 24 (2003)
Source: http://4a.zqu.edu.cn/files/sjjx/%E5%AD%A6%E7%94%9F%E8%AE%BA%E6%96%87/2007%E5%B9%B4%20CHROMA347841.pdf
A Hybrid Approach to Clinical Guideline and to Basic Medical Knowledge Conformance A. Bottrighi1, F. Chesani2, P. Mello2, G. Molino3, M. Montali2, S. Montani1, S. Storari4, P. Terenziani1, and M. Torchio3 1 DI, Univ. del Piemonte Orientale, via Bellini 25/g, 15100 - Alessandria, Italy 2 DEIS - Univ. di Bologna, viale Risorgimento 2, 40136 - Bologna, Italy 3 Az. Ospedaliera S. Giovanni Battista, via Bramante 88, Torino, Italy
Sitting Can Be Good for the Circulatory System HOW THE EMBODY® CHAIR LOWERS HEART RATE Cardiovascular diseases are the leading cause as a significant contributor to this deadly disease. of death and morbidity in industrialized nations, / See Figure 1 / For people increasingly seduced by accounting for about 50 percent of all deaths. Since


