Microsoft word - iemssfinal.docx
International Environmental Modelling and Software Society (iEMSs)
2012 International Congress on Environmental Modelling and Software
Managing Resources of a Limited Planet, Sixth Biennial Meeting, Leipzig, Germany
R. Seppelt, A.A. Voinov, S. Lange, D. Bankamp (Eds.)
Enhancing Stocks and Flows modelling to
support sustainable resource management
in low carbon infrastructure transitions.
Jonathan Busch1,2, David Dawson1,2, Katy Roelich1,2, Julia Steinberger1, Philip
Purnell2
1. Sustainability Research Institute, University of Leeds
2. Institute for Resilient Infrastructure, University of Leeds
Abstract: Emissions reductions of the scale required to avoid dangerous climate
change will require rapid, systemic change including extensive refurbishment and
replacement of infrastructure systems. The technologies required to make this
systemic change exist today but many rely on critical metals which are at risk of
scarcity and difficult to substitute. There has been extensive debate in the
academic and policy literature about whether the availability of these critical metals
will constrain the transformation required. However, policy decisions are being
made without addressing these material barriers or considering how critical
materials could be managed more sustainably during future infrastructure renewal.
This project enhances the established stocks and flows (S&F) methodology used in
industrial ecology by adding layers of extra information on material criticality. This
transforms S&F from being concerned only with quantities of materials, to capturing
supply constraints as well. This in turn allows us to analyse how transitions in the
physical infrastructure may introduce vulnerabilities, associated with materials
supply. More excitingly, it allows us to identify conflicts between low carbon
pathways and sustainable resource management. This paper presents the results
of a proof-of-concept case study that demonstrates the enhanced S&F
methodology on a simple infrastructure system. The findings of the proof-of-
concept study will be used to propose improvements to the modelling approach
and its application to policy development and decision making.
Keywords: Stocks and Flows, Critical materials, Low Carbon Infrastructure
transitions, sustainable resource management.
1
Emission reductions of the scale required to avoid dangerous climate change will
require rapid, systemic changes including extensive refurbishment and
replacement of infrastructure systems. This may include a rapid increase in
renewable energy provision; new nuclear power stations; a bigger, smarter grid to
cope with fluctuating supply; electric vehicle infrastructure; shifting freight to rail
and waterways; and preparing roads, railways etc. for more intense heat or rainfall
[IEA 2011; HM Government 2009].
Such disruptive transitions in the mix of infrastructure technology may introduce
new vulnerabilities, as new technologies need materials that are not widely present
in, or demanded by, current infrastructure. Many of these materials are described
as ‘critical' because they are at risk of scarcity and difficult to substitute [European
Commission 2010]. Introducing new materials into physical infrastructure, where
annual production is measured in Giga-tonnes, can increase demand by orders of
magnitude or induce criticality in previously abundant materials. Current
procurement and design processes ignore the physical, economic and geopolitical
J.Busch et al. / Enhancing Stocks and Flows modelling to support sustainable resource management in
low carbon infrastructure transitions.
risks associated with critical materials; this will introduce vulnerability in new
infrastructure and further reduce its sustainability and adaptability. There has been
extensive debate in the academic and policy literature about the constraints these
critical metals could place on the transformation required [Kleijn et al. 2011; Moss
et al. 2011]. Most scenarios of low carbon technology transitions, however, do not
consider these constraints, even though demand for scarce materials is expected
to multiply five- to ten-fold as emerging economies grow rapidly [Graedel and Cao
2010]. This poses a challenge to designers and policy makers, who must develop
carbon reduction strategies for infrastructure without being able to assess whether
they are increasing or decreasing its vulnerability. As a result, there is a genuine
need for a new method that allows policy makers to take this into account.
This project aims to enhance the established stocks and flows (S&F) methodology
used in Industrial Ecology. In our methodology, physical infrastructure is
disaggregated into structures and their components, both of which may contain
materials. Additional layers will be added containing information on material
criticality. This will allow us to analyse how infrastructure transitions may introduce
vulnerabilities associated with critical material supply and analyse reuse/recycling
strategies to alleviate these vulnerabilities.
2
STOCKS AND FLOWS MODELLING
S&F analysis tracks materials into, out of and through a system of interest throughout the stages of its lifecycle "
equating flows at each reservoir within the system by conservation of mass" [Graedel et al. 2010]. The flows of materials and energy into a system are to a great extent determined by the stocks (the infrastructure) existing within the system. Existing infrastructure requires input flows for usage, maintenance and replacement. This results in output flows of wastes and emissions, which would require more flows of resources into and out of the system – even without any growth in the scale of existing infrastructure. After definition of the scale, level, an appropriate system boundary and time interval, the analysis proceeds either
top down or
bottom up. In the former, stock levels are inferred from differences between inflows to and outflows from the system, whereas the latter approach estimates the stock levels in use within each part of the system. The approach is chosen according to the data available [Graedel et al. 2010]. The traditional approach to S&F models is extremely valuable in quantifying and projecting flows of single substance streams [Spatari et al. 2002; Binder, Graedel and Reck 2006]. This approach, however, is static and does not provide any information on historic trends or drivers, which could be used to analyse mechanisms of change and potential interventions. A number of researchers have investigated more dynamic approaches to analysis with long term changes both historical and potential future changes in material flows [Brattebø et al. 2009; Tanikawa and Hashimoto 2009]. As an extension to historical analysis, stock dynamics have been used as an alternative method for forecasting resource demand and waste generation [Sonigo 2011]. Müller [2006] used a ‘bottom-up' approach relating material stocks in-use to services, on the assumption that material flow analysts are interested in the services that materials provide, rather than the presence of stocks. Services can then be realised by different stocks of good in-use, with different material composition and with different lifetimes. This allows such an approach to modelling to take into account technology and material substitution effects. Tanikawa and Hashimoto [2009] studied the spatial distribution of construction materials over time on an urban scale using 4d-GIS. This inclusion of spatial data can thus enable urban planning and waste management planning to take local characteristics of urban metabolism into account.
J.Busch et al. / Enhancing Stocks and Flows modelling to support sustainable resource management in
low carbon infrastructure transitions.
ENHANCING STOCKS AND FLOWS MODELLING FOR LOW CARBON
INFRASTRUCTURE TRANSITIONS
The model described in this paper is the first step towards enhancing S&F
modelling to assess material criticality in low carbon infrastructure transitions. At
this stage, the model extends the application of S&F modelling to infrastructure
systems containing multiple materials, and allows early conclusions about the
vulnerability of low carbon pathways to material criticality to be made. The service
driven approach described by Müller et al. [2006] is taken as a starting point. From
this, the model is implemented in a structure that is flexible enough to incorporate a
variety of infrastructure systems and multiple materials, and support the later
inclusion of additional layers of information on material criticality.
In order to do this, the types of stock present in the system are split into three basic
categories: infrastructure, technology and material (see Figure 1). Infrastructure
stocks represent the capacity of infrastructure in the system, for example, the
capacity of renewable electricity generation or the number of low carbon vehicles
on the road. The infrastructure stock has no associated flows as only the stock
level over time is needed. This stock is determined by the current level of
infrastructure (from historical data) and a scenario-based prediction of future
deployment.
The technology stocks are disaggregated into two types of objects: structures and
components. Structures are physical objects that are directly related to the
infrastructure stock. For example, a wind turbine that provides a proportion of the
total renewable electricity supply in the UK. Component objects refer to the parts
that make up the structures but do not relate directly to infrastructure. Components
may be nested such that, for example, a wind turbine nacelle is a component of the
wind turbine; a gearbox is a component of the nacelle and a cog is a component of
the gearbox.
The final type of stock present in the model is material. These are stocks
representing the amount of material present in the system aggregated from all
structures and components.
Figure 1: Schematic of the structure of the model indicating the different types of
stock objects in the model, their associated flows, and the drivers and determinates
of stocks and flows.
The calculation of the time evolution of stocks proceeds from left to right across Figure 1. The total stocks of infrastructure, 𝐾 ! (𝑡) in units of capacity (e.g. Giga Watts (GW) or number of vehicles), are determined according to a future deployment scenario. These drive, via a technology mix, the required stock levels
J.Busch et al. / Enhancing Stocks and Flows modelling to support sustainable resource management in
low carbon infrastructure transitions.
of structures, 𝐾 ! (𝑡), that make up the infrastructure in the same units. The outflow, 𝑂 ! (𝑡), of a stock is calculated as
𝑑𝑡!𝐿 ! 𝑡, 𝑡! 𝐼 ! 𝑡! , 1
where 𝐼 ! (𝑡!) is the inflow of stock at time 𝑡′ and 𝐿 ! 𝑡, 𝑡! is the lifetime function of the stock. The lifetime function defines the rate of decommissioning at time 𝑡 of stock added at time 𝑡′ and is assumed to be a Gaussian function. Inflows and outflows are always defined in units of the related stock per year (e.g. GW/year). The inflow is calculated using
Once all the stocks and flows for structure objects have been calculated, the same can be done for the components. The required stocks of a component are determined by the stocks of the parent structure or component multiplied by a component uptake factor. The calculation of a component outflow is complicated by the fact that its outflow may not be solely driven by it reaching the end of its life. A component will also be decommissioned when its parent structure or component is decommissioned. The outflow of a component thus consists of two parts: those decommissioned due to parent decommissioning, 𝑂 !
𝑡 , and those that have reached end of life where
the parent still survives, 𝑂 !
𝑡 . If we further define the lifetime outflow as
𝑑𝑡!𝐿 ! 𝑡, 𝑡! 𝐼 ! 𝑡! , (3)
𝑂 ! 𝑡 − 𝑂 ! (𝑡) ,
𝑂 ! 𝑡 < 𝑂 ! 𝑡
𝑡 ≥ 𝑂! 𝑡
The total component outflow is then given by
𝑂(!) 𝑡 = 𝑂(!)
𝑡 − 𝑂! 𝑡 . (5)
Structures and components at any level of this system may contain materials and thus act as a direct parent to a material stock. The calculation of component inflows is the same as the equivalent calculation for structure inflows (equation 2). Once all the component stocks and corresponding flows are known, the material S&F are calculated in an analogous procedure. The material stocks in mass units (e.g. tonnes) are derived from their parent structure or component stocks by multiplying by a material intensity, which describes the amount of material present per unit of parent stock. The units of material intensity must be a mass unit per the parent stock unit (e.g. tonnes per GW). This method implements a standard S&F model enhanced by the disaggregation of stocks to deal with systems built up of structures and components. This enhancement also provides additional flexibility for modelling nested components and the simultaneous analysis of multiple materials.
J.Busch et al. / Enhancing Stocks and Flows modelling to support sustainable resource management in
low carbon infrastructure transitions.
PROOF-OF-CONCEPT CASE STUDY
The future use of a selection of critical materials in UK passenger vehicle stocks has been chosen to illustrate the functioning of the model. The selection of this case study was primarily determined by the availability of relevant data [Department for Transport, 2012; HM Government, 2011; Bauer et al. 2010]. The future deployment of low carbon infrastructure (i.e. vehicles) is taken from the UK Department for Energy and Climate Change's (DECC) pathway analysis detailed in the
Carbon Plan – Delivering a low carbon future [HM Government 2011]. As inputs for the model, we use the core MARKAL pathway1 and the higher renewables pathway from the Carbon Plan and the Level 4 pathway from the online pathway calculator tool. The Level 4 pathway represents
"extremely ambitious changes that push towards the physical or technical limits of what can be achieved" [HM Government 2010]. The MARKAL pathway was selected as a baseline, whilst the level 4 pathway was chosen to set an upper boundary. Finally, the
Higher Renewables pathway was selected to illustrate a future with higher reliance on renewable technologies. The results, therefore, inherit the behaviour and technological assumption within these pathways [see HM Government 2010, 2011].
The technologies considered in this assessment are restricted to three types of structures and four components. The structures are passenger vehicles, categorised as: internal combustion engine (ICE) vehicles, electric vehicles (EVs), and plug-in hybrid electric vehicles (PHEVs). Other vehicles, the fuel required to propel vehicles and the associated infrastructure are not considered. The four component stocks of the vehicles include catalytic converters in ICE vehicles, two types of lithium-ion batteries (one for EV and one for PHEV) and a single type of permanent magnet contained in the electric motors of both EVs and PHEVs. Lithium-ion batteries contain lithium and cobalt, motors (or permanent magnets) contain neodymium [Kara et al. 2010; Moss et al. 2011; Bauer et al. 2010] and catalytic converters contain Platinum; materials that have all been listed in previous studies on material criticality [Kara et al. 2010; Moss et al. 2011; European Commission, 2010]. The material intensity estimates of the vehicle components are taken from the US Department of Energy's
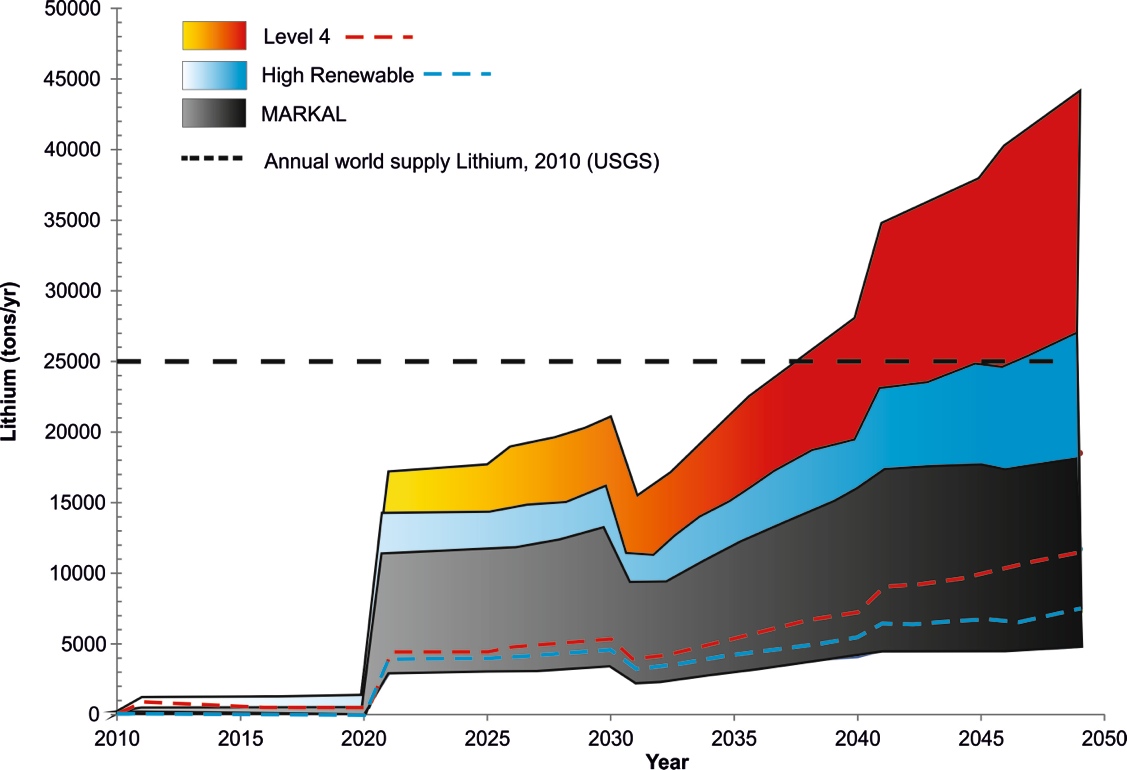
Critical Material Strategy [Bauer et al. 2010]. It is assumed that all vehicles have an average lifetime of 14 years with a standard deviation of 4 years [BERR & DfT 2008]. Using all the estimates stated the predicted annual demand for one material (lithium) for personal vehicles is presented below in Figure 1. The results show a sudden increase in the annual demand for lithium in UK vehicle stock, reflecting a sudden change in the deployment rate of low emission vehicles in 2020. The abruptness of this increase is partly an artifact of the incremental time steps of the scenarios used in the model (five years). In reality, the uptake may follow a smoother trajectory, but the total number of low carbon vehicles in the UK is still estimated to reach between 19 – 26 million by 2030. Based on these estimates, the results suggest that between 2020-2030 the demand for lithium from passenger vehicles will be between 10 to 70 per cent of annual world mine production of lithium in 2010 [USGS 2010]. The range in demand within scenarios is representative of the variance in material requirements in vehicle components from different manufacturers [Bauer et al. 2010]. The range in demand between scenarios is representative of the variation in vehicle deployment. The core MARKAL scenario, which showed the lowest EV and PHEV deployment rates, still results in an increase in demand of over 10 per cent of current lithium production. This represents a step-change in demand for lithium, particularly when considered in combination with the increase in demand for low carbon vehicles outside the UK. The results for future increases in cobalt and neodymium demand (not shown) identify similar scales of magnitude.
1 MARKAL refers to the cost optimisation energy system model used to create the pathway.
J.Busch et al. / Enhancing Stocks and Flows modelling to support sustainable resource management in
low carbon infrastructure transitions.
Figure 2: Annual lithium demand from UK passenger vehicles in the UK based on
three transition scenarios [HM Govenrment 2010, 2011]. Dashed lines represent
the lower estimates based on the range of material intensities for Li-ion batteries in
EVs and PHEVs (Bauer et al. 2010). Estimates are compared with annual world
supply (mine production) taken from USGS (2010).
The model is also capable of estimating the amount of platinum that will be available from future scrapped ICE vehicles estimated in the scenarios. The most conservative scenario of EV and PHEV deployment and material intensity estimates a peak in 2022 that suggest approximately 250 tonnes of platinum will be scrapped in that year (assuming all ICE vehicles have a catalytic converter). This figure represents approximately 30% of the estimated annual world mine production of platinum in 2010 [USGS 2010]. It has the potential to displace virgin metal reducing the need to mine primary materials. This case study provides an illustrative example of the application of the enhanced S&F model to a low carbon infrastructure transition. Electric vehicles make for a particularly interesting study as they are inherently componentised technology structures; batteries are components of the vehicles but have their own lifetime functions. The detailed effect of this in the model is that a significant fraction of batteries do not in fact last until their average lifetime. Batteries will be replaced on average once and then scrapped with the parent vehicle. An interesting follow-up to this case study will be on the effect of this lifetime mis-match on different replacement/recovery strategies for resource management. A further necessary extension of this case study will use fictitious scenarios for model validation. The usual validation and calibration strategy using historical data is not applicable to most of the case studies of interest to this project as the existing stock of most low carbon technologies is very small. Instead, the model will be validated against a set of fictitious scenarios designed to be simple enough to predict independently of the model.
J.Busch et al. / Enhancing Stocks and Flows modelling to support sustainable resource management in
low carbon infrastructure transitions.
FUTURE DEVELOPMENTS
The purpose of developing an enhanced S&F methodology is to assess the
vulnerability of low carbon infrastructure transition plans to material criticality. In
order to make such an assessment, however, additional information is required.
Factors that contribute to material criticality are: geological scarcity; geopolitics;
environmental impact; demand from other sources; importance to economy or low
carbon strategy; potential for reuse/refurbishment/recycling of components or
materials and substitutability of materials [Roelich 2012]. The model must therefore
include the information needed to make an assessment of the risk posed by each
of these factors.
All but the last two of these factors (recyclability and substitutability) we term
‘derived factors' as they are purely functions of the amount of a material required.
The current infrastructure S&F model allows us to estimate this amount. The
information used to assess the magnitude of these factors and their impact on low
carbon transitions can be added as an extra layer to the model once the material
stock levels are known. The next phase of work will determine a method that
combines these diverse criticality factors into a useful index, or set of indices.
These indices will be used, in combination with material flow data, to assess the
increase in criticality of metals and the resulting vulnerability of low carbon
transitions to this criticality.
The substitutability and recyclability of materials and technologies are determined
by the properties of these objects. Their assessment must be integrated into the
model in a way that changes the dynamics of the stocks and flows of the
technology and material objects (Figure 1). These are, therefore, termed ‘dynamics
factors'. The next phase of work will include amendments to the model to
incorporate substitution of materials, components and structures and recycling
based on consideration of their properties.
6.0
CONCLUSIONS
This paper has presented the current developments towards a methodology that
applies an enhanced stocks and flows model to the assessment of vulnerabilities of
materials in low carbon infrastructure transitions. The structural implementation of
the basic model was outlined and a proof-of-concept case study has been
demonstrated. This highlighted a significant step change in resource requires for
the UK's low carbon transport infrastructure, and illustrates the urgent need for a
more robust modelling framework. Finally, in order to achieve such a framework
the anticipated model enhancements were outlined. With these additions, it will be
possible to assess the UK's infrastructure vulnerability to material criticality in low
carbon transitions.
REFERENCES
Bauer, D., Diamond, D., Li, J., Sandalow, D., Telleen, P. and Wanner, B., Critical
Materials strategy, United States Department of Energy. 2010.
BERR & DfT, Investigation into the Scope for the Transport Sector to Switch to
Electric Vehicles and Plugin Hybrid Vehicles, a report by ARUP prepared for the Department for Business Enterprise & Regulatory Reform and the Department for Transport, March 2008
Binder, C.R., Graedel, T.E., and Reck, B., Explanatory Variables for per Capita
Stocks and Flows of Copper and Zinc A Comparative Statistical Analysis, Environmental Studies, 10 (1), 2006.
J.Busch et al. / Enhancing Stocks and Flows modelling to support sustainable resource management in
low carbon infrastructure transitions.
Brattebø, H., Bergsdal, H., Sandberg, N.H., Hammervold, J., and Müller, D.B.,
Exploring built environment stock metabolism and sustainability by systems analysis approaches, Building Research & Information, 37(5-6), 569-582, 2009.
Department for Transport. Vehicles registered for the first time by body type, Great
Britain, monthly from 2001. Vehicle licensing, VEH0150, 8 March, 2012
European Commission. European Commission Enterprise and Industry. Critical
Materials for the EU, Report of the Ad-hoc Working Group on defining critical raw materials, 2010
Graedel, T.E., and Cao, J., Metal spectra as indicators of development,
Proceedings of the National Academy of Sciences of the United States of America, 107 (49), 2009.
Graedel, T.E. et al., Metal Stocks in Society Scientific Synthesis, United Nations
Environment Programme, International Panel for Sustainable Resource Management 2010.
HM Government, 2050 Pathway Analysis, HMSO, 2010.
HM Government, The Carbon Plan - Delivering a low carbon future, HMSO, 2011.
IEA (International Energy Agency), World Energy Outlook, 2011.
Kara, H., Chapman, A., Crichton, T., Willis, P., Morley, N., Deegan, K., Lanthanide
Resources and Alternatives, 2010.
Kleijn, R., van der Voet, E., Kramer, G.J., van Oers, L., and van der Giesen, C.,
Metal requirements of low-carbon power generation, Energy, 36, 5640-5648, 2011.
Moss, R., Tzimas, L.E., Kara, H., Willis, P. and Kooroshy, J., Critical Metals in
Strategic Energy Technologies Assessing Rare Metals as Supply-Chain Bottlenecks in Low-Carbon Energy Technologies, 2011.
Müller, D.B., Stock dynamics for forecasting material flows - Case study for
housing in The Netherlands, Ecological Economics, 59(1), 142-156, 2006.
Roelich, K., Undermining Infrastructure: Material criticality briefing note, http://sure-
infrastructure.leeds.ac.uk, 2012.
Sonigo, P., Turbe, A., Johansson, L., Lockwood, S., Mitsios, A., Steinberger, J.K.,
Wiedenhofer, D., Eisenmenger, N., and Maxwell, D., Large Scale Planning and Design of Resource Use, Final Report prepared for European Commission (DG ENV), Paris: Bio Intelligence Service (BIOIS), 2011.
Spatari, S., Bertram, M., Fuse, K., Graedel, T.E., and Rechberger, H., The
contemporary European copper cycle: 1 year stocks and flows, Ecological Economics, 42(1-2), 27-42, 2002.
Tanikawa, H, and Hashimoto, S., Urban stock over time: spatial material stock
analysis using 4d-GIS, Building Research & Information, 37(5), 483-502, 2009.
USGS. United States Geological Survey, Mineral Resources, mineral commodities
summaries: accessed from http://minerals.usgs.gov/minerals/pubs/mcs/ on the 22/01/12.
Source: http://iemss.logismi.co/xmlui/bitstream/handle/iemss/12202/0737paper_long.pdf?sequence=2
Illicit drugs and by Angela Dean Almost half the population of Australian adults reports use of an illicit substance at least once. Therefore it is likely that some of our patients may be using illicit drugs in combination with other medications. Illicit substance use may contribute to adverse effects, interfere with treatment efficacy, or even augment treatment effects. Additionally, regular users of illicit substances may exhibit poor medication adherence or impaired ability to engage in behaviours such as blood glucose testing in diabetes.
International Journal of Risk & Safety in Medicine 27 (2015) 85–91 DOI 10.3233/JRS-150645IOS Press Suicidal risk from TADS study was higherthan it first appeared G¨oran H¨ogberga,b,∗, David O. Antonuccioc and David Healyda Department of Women's and Children's Health, Child and Adolescent Psychiatric Unit,Karolinska Institutet, Astrid Lindgren Children's Hospital, Stockholm, SwedenbStockholm Child and Adolescent Psychiatry, BUP Huddinge, Stockholm, SwedencDepartment of Psychiatry and Behavioral Sciences, University of Nevada School of Medicine,Reno, NV, USAdBangor University, Wales, UK


