Krex.k-state.edu
THE EPIDEMIOLOGY OF TETRACYCLINE AND CEFTIOFUR RESISTANCE IN
COMMENSAL ESCHERICHIA COLI
MATTHEW THOMAS MCGOWAN
B.S., Kansas State University, 2011
submitted in partial fulfillment of the requirements for the degree
MASTER OF SCIENCE
Department of Biomedical Science
College of Veterinary Medicine
KANSAS STATE UNIVERSITY
Manhattan, Kansas
Dr. H. Morgan Scott
Copyright
MATTHEW THOMAS MCGOWAN
Abstract
The modern phenomenon of increasing prevalence of antibiotic resistance in clinically
relevant bacteria threatens humanity's ability to use antibiotics to treat infection in both humans
and animals. Despite the marked complexity of bacterial evolution, there is tremendous
importance in unfolding the process by which antibiotic resistance genes emerge, disperse, and
persist in the natural world. This thesis investigates certain aspects of this process in two
experimental studies that differ primarily by scale but also by methodology.
The first study examined the long-term annual prevalence of ceftiofur and tetracycline
resistance in Canadian beef cattle from 2002 to 2011 at both phenotypic and genotypic levels.
Ceftiofur was present at a very low prevalence (<4%) that did not statistically increase over the
decade (p<0.05). Relative proportions of tetracycline genes
tet(A), tet(B), and
tet(C) also did not
significantly change over the observation period. However, it was surprising that almost 20% of
isolates recovered from nonselective agar harbored
tet(C) given that current literature generally
indicates that
tet(C) is significantly less prevalent than
tet(A) or
tet(B). The usage of historical
samples in addition to parallel selective plating using agar supplemented with antibiotics
provided insight into systemic bias present in common microbial approaches. Long-term sample
freezing significantly diminished the recoverability of
E. coli over time. Additionally the usage
of selective MacConkey agar containing tetracycline biased the proportions of tetracycline genes
to over-represent the
tet(B) gene in commensal
E. coli compared to nonselective MacConkey
The second study attempted to explain the short-term selection effects of antibiotic
treatment on the overall ecological fitness of commensal
E. coli using bacterial growth
parameters estimated from spectrophotometric growth curves as a simple surrogate of general
fitness. Treating cattle with either tetracycline or ceftiofur was found to not only select in favor
of tetracycline resistant bacteria, but also increased the overall fitness among the tetracycline
resistant population. However, growth curves were unable able to explain why transiently
selected resistant bacteria were eventually replaced by susceptible bacteria once the selection
pressure was removed.
Table of Contents
List of Figures
List of Tables
First and foremost, I would like to express my gratitude to my advisor Dr. H. Morgan
Scott for his continuing support of my Masters research, for his enthusiasm, experience, and
I would also like to thank all the members of my research laboratory. Specifically I would like to
thank Javier Vinasco for his practical experience and inventive troubleshooting, Neena Kanwar
for sharing her labor intensive analysis, and Stephan Guillossou for providing his savvy R
programming skills.
I thank Nicol Janecko and the entire CIPARs team at the Laboratory for Foodborne Zoonoses,
Patrick Boerlin and Jennifer Cottell at the University of Guelph, and all collaborators on the
NIFSI grant that have made this research possible.
Dedication
To my mother and father who shared with me their thirst for knowledge and appreciation
To my wife Jessy for sharing in all the kite-flying, kayak-paddling, mountain-conquering
adventures that make life totally worth it!
Chapter 1 - Overview of tetracycline and ceftiofur resistance
Objective
This thesis is a combination of two studies designed to investigate epidemiological
properties of both tetracycline and ceftiofur resistant commensal
E. coli present in the intestines
The widespread usage of antimicrobials in animal agriculture for the treatment, control,
and prevention of disease as well as growth promotion is generally considered to provide
evolutionary selective pressure that contributes to the emergence, spread, and persistence of
antimicrobial resistant bacteria. This research focuses on antimicrobial resistance (AMR) in beef
cattle as one significant production system that regularly employs antibiotics and is being
negatively impacted by antibiotic resistance. Among the many different antimicrobials used in
treating cattle, ceftiofur and tetracycline are focused on here not only because of rising concern
over the spread of extended-spectrum beta lactamases, but also because both drugs provide two
distinct and potentially generalizable situations regarding the dynamics of antibiotic resistance.
On one hand, tetracycline is a very old antibiotic with an extended history and variety of
uses in cattle. In addition to treatment use, the drug is also used for growth-promotion,
prevention and control, and thus is administered at a wide range of dosages and regimens. The
most common mechanism of resistance is by drug efflux, but there are other mechanisms such as
ribosomal protection and, rarely, enzymatic inactivation. Tetracycline resistance is not only well
established and commonly present in cattle commensal bacteria, many different tetracycline
resistance genes often co-reside within local bacterial populations. Additionally, tetracycline is a
common denominator in nearly all multidrug resistance phenotypes that have emerged in the past
decade. Even though tetracycline resistance itself emerged and spread in cattle decades ago,
there is evidence to suggest that not all tetracycline resistance genes are created equal in their
ability to persist in bacterial communities, spread to new bacterial species, and associate with
other drug resistances. We looked at tetracycline resistance not as a primary emerging threat, but
instead as serving a potential supporting role on the global stage of resistance. It was
hypothesized that differences between tetracycline resistance determinants are competitively
changing their distributions in bacterial populations and unevenly contributing to the emergence
of multidrug resistance in beef cattle.
On the other hand, ceftiofur represents a more recently introduced antibiotic. There are
relatively few recorded mechanisms of resistance to ceftiofur in North American agriculture and
nearly all rely on enzymatic inactivation of the drug itself. The drug is parenterally administered
at treatment dosages and while resistance has been detected in cattle, the prevalence is generally
low in cattle not undergoing treatment. Considering a growing concern over a generally
increasing prevalence of extended-spectrum beta-lactamases among Gram-negative enteric
bacteria, ceftiofur resistance is looked at in this study as a resistance that has already emerged, is
not yet widely established, but may currently be in the process of spreading in cattle populations.
This study hypothesizes that ceftiofur resistance is in the initial stages of spreading, but may not
yet be prevalent above the detection threshold of already established resistance surveillance
Tetracycline Resistance
Since its discovery in 1945, tetracycline and its derivatives have played key roles in the
antimicrobial arena because of its broad-spectrum activity, low toxicity, and low production
cost.(1) While remaining a widely used antibiotic class across the globe, their long term
usefulness as a therapeutic agent in treating disease is becoming limited because of the
increasing prevalence, spread, and persistence of a variety of tetracycline resistance determinants
in microbial communities.
The presence of widespread tetracycline resistance raises particular concern in animal
agricultural production systems. In addition to its therapeutic use for control and prevention of
disease (generally doses greater than 70 mg/hd per day in beef cattle for chlortetracycline),
tetracycline is also administered at sub-therapeutic levels in livestock as feed additives(2) for
improvement in feed efficiency and rate of gain (generally anything ≤70 mg/hd per day in
growing cattle over 400 lbs) (3). The benefit of higher weight gain and from this use creates a
strong incentive for farmers to use tetracycline as a feed additive. Consequently, they are
regularly used except in countries or production systems that explicitly ban their use. The
justification for using tetracycline or any antimicrobial as a growth promoter is increasingly
contentious because there is growing unease that the constant use of antimicrobials at low
dosages may significantly impact the emergence, selection, and spread of antibiotic resistance(4).
The antimicrobial mechanism of tetracycline relies on entering bacterial cells through
passive diffusion as well as energy-dependent active transport(6). The drug accumulates in the
cell and reversibly binds to the bacterial 30S ribosomal subunit. This binding causes a
conformational change in the ribosome and prevents the attachment of aminoacyl-tRNA to the
ribosomal acceptor (A) site. Protein synthesis is shut down after tetracycline accumulates in
sufficient quantity to saturate the bacterial ribosomes. Tetracycline is often categorized as a
bacteriostatic agent because it does not directly kill the cell.
The growing body of research regarding tetracycline resistance reveals that there is
relatively high diversity among determinants compared to other antimicrobial classes(7). As of
2009, there were 35 different identified genes that confer resistance to tetracyclines(8). The
mechanistic actions of these genes divide into three categories. The largest group confers
resistance through energy-dependent efflux proteins that export tetracycline out of the cell before
the drug can accumulate to concentrations required to inhibit synthesis. The second most
common group codes for proteins that interact with the ribosome to interrupt the drug from
halting translation. The current model for this process is that the protection proteins interact with
a ribosome bound with tetracycline and cause a conformational change in the ribosome which
results in tetracycline being released from the ribosome, allowing protein synthesis to
continue(9). The third group confers resistance by enzymatic inactivation of the antibiotic.
However, this third type of resistance has only been found in the obligate anaerobe
Bacteroides,
which ironically requires oxygen to work, and also is not clinically relevant(10).
Tetracycline resistance genes have spread to a widely diverse number of bacterial genera.
Efflux and ribosomal protection genes have been found in both Gram-positive and Gram-
negative microbes present in the environment and animals (11, 12). However, efflux genes have
been reported more in Gram-negative genera and ribosomal protection genes more in Gram-
positive genera(13). The extensive reach of these genes is largely attributed to their location on
conjugative plasmids in the case of efflux genes and on conjugative transposons in the case of
ribosomal protection genes(8). Incompatibility between the conjugation vectors and certain
genera may explain the uneven distribution of resistance genes. One example is the absence of
ribosomal protection genes tet(M) and tet(O) among
Escherichia coli. Indeed, the conjugative
transposons carrying tet(M) and tet(O) likely originate from
Bacteroides and have been shown
to be unable to mobilize into
E. coli(14). This incompatibility is not only restricted to ribosomal
protection genes. Indeed, some efflux genes have been found to be associated with specific
plasmid types(15). However, there has been speculation that the current understanding of the
resistance distribution is distorted by unequal screening for genes in particular genera(16). A
meta-analysis addressing this has yet to be published.
Ceftiofur resistance
Ceftiofur is classified as a third-generation cephalosporin. First commercially released in
1987, it has become a core antimicrobial for treating respiratory disease in ruminants, swine, and
horses(17). Ceftiofur's irreversible bactericidal mechanism of action is provided by a β-lactam
ring in its molecular structure(18). This ring forms an analogue of the terminal amino acid
residues on precursor subunits of the peptidoglycan layer. Because of this, the drug binds to
penicillin-binding proteins (PBPs) which normally facilitate the final transpeptidation step in
synthesizing the peptidoglycan layer of bacterial cell walls. The irreversible binding of beta-
lactams to the PBPs prevents the final crosslinking of peptidoglycan and disrupts cell wall
synthesis. With the cell wall compromised, the bacterial cell then fails to divide and dies. Drugs
containing a β-lactam are classified based on other molecules attached to the ring in their
molecular structure. Cephams, the group of β-lactams including cephalosporins, have the β-
lactam ring fused to an unsaturated six-membered thazine ring.
Resistance to cephalosporins primarily occurs by the production of enzymes that
hydrolyze the β-lactam ring and deactivate the drug before it can kill the bacterial cell. While
nearly all confer resistance to penicillins, some provide activity against other β-lactams as
well(19). The term extended-spectrum β-lactamases (ESBL) usually applies to enzymes also
capable of hydrolyzing third-generation cephalosporins (e.g., ceftazidime, ceftriaxone, and
ceftiofur) but are not effective against cephamycins (e.g., cefoxitin and cefotetan) or
carbapenems (e.g. meropenem or imipenem)(20). Carbapenemases and cephamycinases are β-
lactamases with activity against carbapenems and cephamycins, respectively, in addition to
extended-spectrum β-lactams. The most common classification system for these enzymes is the
Ambler classification. This system divides β-lactamases into four classes A through D(21) based
on their amino acid sequences.
Class A β-lactamases are the most commonly encountered. Enzymes in this class have a
conserved serine residue at their active-site(22). Among class A enzymes, TEM-1 is the most
commonly encountered and accounts for most ampicillin resistance in
E. coli. Another class A
enzyme, SHV-1, is often found in
K. pneumonia and is highly homologous to TEM-1. Both of
these confer resistance to penicillins such as ampicillin, but not to expanded-spectrum
cepahlosporins, carbapenems, or cephamycins. The more distantly related CTX-M is noted for
its greater activity against oxyimino-beta-lactam antibiotics including ceftiofur. The class A KPC
enzyme is the most common form of carbapenem resistance in
Klebsiella sp.
Class B enzymes are called metallo-β-lactamases because the bivalent metal ion, Zn2+, is
required for activity(23). In addition to providing resistance to penicillins and cephalosporins,
they also confer resistance to carbapenemases and are a rising threat to public health. The two
most common families of class B β-lactamases are IMP and VIM. These were identified in
Pseudomonas and
Acinetobacter are not commonly found in Enterobacteriacea. However, the
class B enzyme NDM-1 is becoming a growing threat because of its wider presence in other
bacteria such as Enterobacteriacea(24).
Class C and D enzymes are like class A enzymes in that they also have a serine residue at
their active-site. However, they have their own distinct amino acid sequences and do not share
homology with each other. Class C enzymes are also called AmpC β-lactamases because the
gene coding for these enzyme was originally identified from a stepwise mutation experiment
investigating the genetics of ampicillin resistant
E. coli(25). In addition to ampicillin and other
penicillins, some AmpC enzymes confer resistance to cephalosporins and cephamycins but not
carbapenems. This is especially the case among plasmid-mediated AmpC β-lactamases. The
CMY-2 AmpC is the most widespread plasmid-mediated Class C enzyme and is an important
cause of resistance in
E. coli and
Salmonella strains(26). The most significant class D group
enzymes are the OXA β-lactamases which exhibit carbapenemase activity(27). In addition, they
are highly hydrolytic against oxacillin and cloxacillin and are poorly inhibited by clavulanic acid.
These are usually found in
Acinetobacter, but have also been found in
Klebsiella and rarely in
other
Enterobacteriaceae(28-30).
Antibiotic Resistance in Beef Cattle
The use of antimicrobials in animal agriculture and their role in promoting AMR have
become a significant concern since the 1960s. Numerous organizations have published reports
that identify antimicrobial use, or sometimes phrased "abuse", in animal agriculture as a
potential risk to human health. In particular, the use of antimicrobials as growth promoters is
often the most commonly identified practice of "abuse" that greatly contributes to the burden of
AMR. For example, in the WHO Global Principles for the Containment of Antimicrobial
Resistance in Animals Intended for Food, several principles were laid out as a framework of
recommendations to prevent the misuse of antimicrobials. Among these principles was the
specific recommendation that the usage of antimicrobial growth promoters that belong to
antimicrobial classes also used for treatment should be stopped in the absence of risk-based
Beef cattle production is one sector of animal agriculture that regularly uses
antimicrobials for both treatment and growth promotion. The extent of this use is generally
considered to be widespread in beef cattle. However, aside from professional opinion, there are
very few quantitative estimates of the quantity and patterns of use (1). Ironically, despite the
specific concern over the impact of growth promoters on AMR and the regular use of growth
promoters in beef cattle, relatively little research has been conducted regarding AMR in beef
cattle when compared to swine, poultry, and dairy cattle production systems(31). The current
understanding of AMR in beef cattle is primarily based on testing from national surveillance
programs. The US National Antimicrobial Surveillance System (NARMS) regularly tests
commercial pork, ground beef, and poultry samples for foodborne pathogens as well as AMR
patterns of found pathogens. Annual reports have been released since testing began in 2002 (32).
The two most significant bacteria found contaminating beef were
Escherichia coli and
Enterococcus.
Campylobacter was very rarely recovered from retail meat samples (<1% for all
years) and
Salmonella was also rarely recovered (<2%). This contrasted strongly with poultry
where
Campylobacter and
Salmonella were regularly recovered from meat samples (>30% and
>9% respectively from retail chicken samples) . The lower prevalence of foodborne pathogens in
beef samples may partially explain why swine and poultry are often focused on instead of cattle
when investigating AMR.
Among commensal
Enterococcus isolates recovered, AMR levels were found to be much
lower in beef cattle compared to pork and poultry. Tetracycline resistance was common in both
Enterococcus and
E. coli (roughly 20-30% of isolates) and aminoglycoside resistance was also
found in both organisms but only rarely (<10%). Among commensal
E. coli, uncommon
resistances (<10%) found were ampicillin, cepham, and phenicol resistances. While
E. coli
isolates recovered from poultry displayed an increasing trend for resistance to cephalosporins
from 2002 to 2011 (7.1% to 12.3% for ceftiofur), this trend was not observed in ground beef
samples. However, low level cephalosporin resistance was detected in ground beef from 2003
onwards (0.3-0.9%). Multidrug resistance in
E. coli was relatively low in ground beef with
roughly 70-80% of isolates recovered being pan-susceptible, 10% of isolates being resistant to
≥3 antimicrobial classes, and 2-6% of isolates being resistant to ≥4 antimicrobial classes.
Aside from NARMS, there are few large scale reports on antimicrobial resistance,
particularly in beef cattle. However, there are smaller studies that have incorporated beef cattle
sampling in cross species investigations. Sayah et al. 2005 (33) looked at antimicrobial resistance
in
E. coli isolated from multiple sources such as domestic and wild animals as well as human
septage and surface water. A total of 89 beef cattle from 7 farms were included in their sampling.
Unfortunately, despite finding that beef and dairy cattle had different antimicrobial exposures
through treatment, they ended up grouping all isolates as "cattle" in their analysis. Because dairy
cattle tended to be much more likely to be treated with ceftiofur (20%) compared to beef cattle
(1%), the reported percentage and odds ratio for finding antibiotic resistances in
E. coli,
especially cephalosporin resistance (21.87%, OR=1.13), may be significantly biased toward
dairy cattle. However, their analysis on resistance presence in different sub-environments within
beef cattle farms does give an indication on the general presence of resistance on beef farms.
They found that common resistances such as tetracycline, ampicillin, and streptomycin were
found in isolates recovered from cattle fecal samples as well as the farm environment and
septage. However there were some exceptions to this in that neomycin, gentamicin, and
sulfamethoxazole-trimethoprim resistance was only found in either the fecal, farm environment,
or septage. This finding differed from what they observed on dairy and poultry farms. However,
they did not indicate which of these three categories the resistance was found.
Alexander et al. 2008 (34) investigated the effect of subtherapeutic administration of
antibiotics on the prevalence of antibiotic resistance in
E. coli shed from feedlot cattle. They
tested the five most common substances that are administered subtherapeutically in the industry
for their treatment groups. These treatments were chlortetracycline, chlortetracycline plus
sulfamethazine, virginiamycin, monensin, and tylosin. Surprisingly, they found that
subtherapeutic treatment with tetracycline alone did not increase the prevalence of tetracycline
resistance in
E. coli. Rather, the prevalence of tetracycline resistance actually decreased over the
first 40 days in unison with the control group. However, when treated with sulfamethazine in
addition to tetracycline, the prevalence of tetracycline and ampicillin resistance was drastically
higher than the control group. Other treatments did not impact either tetracycline or ampicillin
resistance prevalence. Over the course of sampling, the cattle were switched from a silage based
diet over to a grain based diet. Unexpectedly, switching to a grain based diet increased the
prevalence of both tetracycline and ampicillin resistance as much as the tetracycline-
sulfamethazine treatment. Ampicillin resistant isolates were further investigated by pulsed-field
gel electrophoresis. They found that when the prevalence of ampicillin resistance increased in a
pen, resistant isolates were clonal and tended to be shed in surges by most of the animals in the
pen. However, isolates were not clonal from one surge to another. This may indicate some form
of cross-colonization among animals through common contact or environment. However,
without any environmental sampling this suggestion is conjecture.
There are also some studies that investigated the effects of therapeutic treatment with
antibiotics on the gut flora of beef cattle. Lowrance et al. 2007 (35) treated cattle with several
different treatment regimens of ceftiofur and observed that treatment resulted in a drastic
increase in ceftiofur resistance from less than 10% to over 60% of the
E. coli population shortly
after administration. It is important to note that the total E. coli population also decreased
following treatment meaning that the observed increase in resistant fraction of bacteria was part
expansion of that fraction, and part contraction of the susceptible fraction. Ceftiofur resistant
isolates were also resistant to other antibiotics. These were tetracycline, ampicillin, sulfisoxazole,
chloramphenicol, streptomycin, cefoxitin, and amoxicillin-clavulanic acid. The increase in
ceftiofur resistance was transient and within two weeks ceftiofur resistance dropped back to pre-
treatment levels. Singer et al. 2008 (36) reported similar findings that the drastic spike in
ceftiofur resistance following treatment resulted in an unstable population that returned to pre-
treatment levels in a short time span. On the other hand, Platt et al. 2008 (37) explored whether
treating cattle with chlortetracycline at therapeutic dosages impacted the antimicrobial
susceptibility of
E. coli. Tetracycline exhibited a similar pattern to ceftiofur in that treatment
with tetracycline resulted in a significant increase in tetracycline resistance. Unlike ceftiofur,
treatment with tetracycline did not appear to select for highly multidrug resistant strains. While
there was some co-selection for resistance to sulfisoxazole, streptomycin, and ampicillin,
treatment paradoxically resulted in a significantly lower proportion of isolates resistant to
ceftiofur. This paradox has yet to be fully explained, but one speculation is that strains
possessing fewer drug resistances, in addition to tetracycline, may have a competitive advantage
considering that there are many different resistance mechanisms to tetracycline while ceftiofur
has relatively few resistance mechanisms.
While there are relatively few reports of AMR in beef cattle, there are even fewer studies
that have attempted to go beyond exploring the phenotypic state of antimicrobial resistance in
beef cattle and actually look at the genes that are harbored in resistant bacteria. This is at least
partly due to a lack of standardization in the identification and nomenclature of distinct
resistance mechanisms. Historically, tetracycline resistance mechanisms were only defined by
their relative genetic relationships based on their ability to hybridize with each other. However,
the advent of accessible gene sequencing, PCR testing, and openly accessible repositories of
gene data has been closing many of the communication gaps and has resulted in increasingly
consistent nomenclature for resistance genes (38). Alexander et al. 2009 (39) followed up their
early research into sub-therapeutic effects of antimicrobials on resistance by characterizing many
of the recovered isolates. This was done by testing isolates for a large number of resistance
genes. Of the determinants screened,
tet(A), tet(B), tet(C),
blaTEM1,
sul1, and
sul2 were the most
frequently found.
Bridging the Research Gap
No doubt, the dynamics of antibiotic resistance in commensal organisms requires further
study across the entire spectrum of food animals as well as environments surrounding them.
However, the common multipurpose use of antimicrobials in beef cattle coupled with the fact
that there is relatively little research regarding resistance in beef cattle highlights the specific
need for more studies further investigating the impact of antimicrobial use on commensal flora in
cattle as well as further characterizing the patterns of resistance present in beef cattle systems.
While most of our current understanding of AMR in cattle is based on phenotypic data and has a
crude view of what general patterns of resistance are currently present, more in depth studies are
needed that investigate resistance at the molecular level for any hope of explaining why and how
these patterns have emerged in cattle and may change in the future. The limited body of research
regarding AMR in cattle has found some consistent patterns, but requires more in depth
investigation into the origins and genetic nature of these patterns to better explain natural AMR
phenomena. First, NARMS found several types of resistance were commonly present in cattle
populations in the past decade but have not been increasing in prevalence. Tetracycline
resistance is the primary example of this, but sulfisoxazole and streptomycin resistances could
also be considered to be following this pattern. NARMS also reported on some forms of
resistance that have been increasing in prevalence in other animal production systems, but have
yet to increase in cattle despite resistance being at least rarely present in cattle. Ampicillin and
ceftiofur resistance are two examples of this pattern. Secondly, short-term treatment with
antimicrobials appears to transiently select for resistant isolates among commensal flora but that
populations tend to return to a pre-treatment "baseline" state over time. This suggests that the
relative fitness of resistant bacteria compared to susceptible bacteria may play some role in
whether a particular form of resistance persists. Despite the fact that there are some bacteria that
possess resistance in cattle, there may be environmental selection pressures capable of
preventing them from dominating the commensal flora in cattle unless an animal is actively
being treated with antimicrobials. The two experimental studies in this thesis approach this
notion that environmental selection pressures may create some form of "baseline" that unstable
commensal populations return to between antibiotic treatment events, at least in the relatively
short term (days and weeks). Over the longer term (months to years), upward trends suggest that
the return to baseline provides as false sense of security.
Chapter 2 - Surveillance of tetracycline and ceftiofur resistance in
Canadian beef cattle 2002-2011
This intent of this study was to evaluate using selective media to determine whether the
sample-level and isolate-level prevalence of antimicrobial resistance (AMR) to ceftiofur and
tetracycline increased from 2002 to 2013 among commensal
E. coli residing in cattle entering the
Canadian food supply.
The Canadian Integrated Program for Antimicrobial Resistance Surveillance (CIPARS)
was established in 2002 as an integrated national surveillance program with the purpose of
documenting the extent and variation of antibiotic resistance occurring geographically and
temporally in both human and animal populations. Sampling and AMR testing methods were
designed to generate AMR results that were both representative of the systems investigated as
well as comparable to data gathered from other national surveillance counterparts such as the
United States' National Antimicrobial Resistance Monitoring System (NARMS). More
importantly, the program was designed with expectation that the changing landscape of scientific
knowledge regarding AMR would benefit from being able to revisit archived samples as well as
isolates. This is unique in that most isolate-based surveillance systems (such as NARMS) retain
only the bacterial isolate and not the sample from which it arose. With this mindset, CIPARS
produces a continual report(40) on AMR in Canadian systems as well as an ever growing sample
bank that broadly represents multiple systems where AMR is a growing concern.
Several recent studies have demonstrated that the prevalence of bacteria harboring genes
coding for cephalosporin resistance has generally increased in several systems over the last
decade (28, 41-43). The presence of these genes is cause for concern because they are capable of
enhancing resistance to third-generation cephalosporins. These drugs have historically been
useful in treating hospital-acquired infections, but are fast becoming ineffective due to increasing
levels of resistance. ESBL genes as well as class C β-lactamase genes have been isolated from
numerous sources ranging from hospital infections to community water supplies (44, 45).
Identifying environmental reservoirs is important in developing any future intervention strategies
to reduce further dissemination. Cattle have been suggested as a reservoir for resistance to
cephamycin and cephalosporin (41). Multiple β-lactamase genes have been found from bovine
sources and
E. coli is a common species identified as harboring containing AmpC determinants,
namely CMY-2 (46-48). Often, the use of selective media containing a cephalosporin is required
to isolate ESBLs from cattle, which suggests that bacteria harboring these resistances may
comprise only a very small proportion of the total commensal bacteria population in healthy
animals. Because the general screening methodology employed by the CIPARS program does
not use selective media, the prevalence of ESBL-producing bacteria in Canadian cattle may have
been under-reported because resistance was not present in sufficient quantities above the
detection threshold. This study re-tested the CIPARS collection of cattle samples from 2002-
2012 using a selective media containing ceftiofur. The purpose of this was to test whether there
were samples with populations of ESBL producing
E. coli that were not detected using the
original nonselective approach and to compare the sample versus isolate prevalence of ceftiofur
In addition to ceftiofur resistance, tetracycline resistance was also further examined in
detail beyond the capabilities of the original CIPARS surveillance methods. Samples were re-
tested using selective media containing tetracycline to see whether tetracycline resistance also
occurred at levels below original detection methods. Although tetracycline resistance is already
known to be well established in cattle, there is little reporting on the relative abundance of
particular tetracycline genes in commensal flora. Therefore,
E. coli isolates recovered from
caecal samples were also tested for four tetracycline genes likely to be present in commensal
E.
coli. Furthermore, the relationship of any tested genes to particular resistance phenotypes was
also examined. As for ceftiofur, the sample versus isolate prevalence of resistance was also
Materials and Methods
Sample Collection
A two-stage sample design was used to obtain a representation of Canadian slaughter
cattle, which comprised both fed beef and dairy beef in unknown proportions. In the first stage,
abattoirs were randomly selected from a list of federally inspected slaughter plants with the
probability of being selected proportional to its annual production volume. Abattoirs on this list
account for over 90% of beef production in Canada. CIPARS began sampling in 2002 and has
continued up until 2013. In this study, only samples from 2002 to 2011 were used.
The second stage was a systematic selection of animals on the slaughter line in each
plant. The number of animals sampled in each abattoir was proportional to its production
volume. For each abattoir, an annual target number of samples to be collected was divided by
five with the result determining the number of annual sampling periods. Within 5 days in each
collection period, five animals were sampled by taking a small portion of the caecal contents
from discarded offal. These animals were from different lots to minimize lot clustering bias.
Collection periods were uniformly distributed over each year. The sampling process for each
plant was based on the same protocol, but differences in production line setup required slight
modification for each plant. Samples were collected by industry employees under the oversight
of the Canadian Food Inspection Agency (CFIA) Veterinarian-in-Charge. Following collection,
each sample was placed in Brucella Broth containing 15% glycerol and frozen at -80oC.
Original Surveillance Testing
The original surveillance testing protocols used similar methodology as those in this
study in regards to bacterial isolation and MIC determination. However no selective media was
used in the isolation step and there was no further investigation into tetracycline gene presence.
In brief, caecal samples were plated on MacConkey agar and a single
E. coli colony was isolated.
MIC values were determined for each isolate using the TREK Sensititre® NARMS commercial
panel of 15 different antibiotics (Figure 2-2).
Bacterial Re-isolation
Starting in 2012, caecal samples originally positive for
E. coli growth were re-plated,
producing a new set of bacterial isolates for downstream analysis. Two selective agar plates
containing tetracycline or ceftiofur were used in addition to a nonselective MacConkey plate.
This was done to potentially select for resistant bacteria populations at too low of a concentration
to be isolated using the original nonselective methods, and also to better estimate the sample-
level prevalence of resistance. Caecal samples were removed from storage and thawed. 1ml was
inoculated into three MacConkey broth (Difco) tubes containing either no supplement,
tetracycline (16ug/ml), or ceftiofur (8ug/ml). Then 10ul of each enriched sample was plated onto
a MacConkey agar plate containing the same supplement. Not all caecal samples resulted in
growth on all three plates. When growth occurred, one colony was selected from each of the
three selective plates and spread on a Trypticase Soy Agar plate (Difco) as a purification step.
Indole and citrate tests were performed to ensure that purified isolates were actually
E. coli.
Confirmed
E. coli isolates were then stored in 1ml BB+15% glycerol for further analysis. A
general outline of this procedure is presented in Figure 2-1.
All
E. coli isolation and antimicrobial susceptibility testing was conducted at the
Laboratory for Foodborne Zoonoses, St. Hyacinthe, Quebec. Because downstream genotyping of
tetracycline resistance genes was done at another institution, the caecal samples were not
processed in the serial order that they were originally obtained. Instead, samples were processed
from the fringe sampling years stepwise towards the median year.
Antimicrobial Susceptibility Testing
Antimicrobial susceptibility testing was performed using the Sensititre (Trek Diagnostic
Systems, Cleveland, Ohio, USA) automated broth microdilution system, as per CIPARS 2008
(40). The custom NARMS panel CMV2AGNF (Figure 2-2) was used with
E. coli ATCC 25922
and ATCC 35218 as quality control organisms.
Bacterial isolates were tested to obtain their minimum inhibitory concentration for the 15
antibiotics included in the panel using breakpoints determined by the Clinical and Laboratory
Standard Institute. For antibiotics without a CLSI breakpoint, NARMS consensus breakpoints
were used. To ease further analysis, antibiotics that include an intermediate classification
between resistant and susceptible were collapsed into binary classification with intermediate
isolates being recorded as susceptible.
Tetracycline Resistance Gene Determination
Samples collected from years 2002, 2003, 2010, and 2011 were further investigated to
determine tetracycline resistance genotype. These years were chosen because they are at the
fringes of the sampling timeframe available. Tetracycline resistance conferring genes were
detected in isolates using a polymerase chain reaction based (PCR) approach. Total DNA was
extracted from each isolate via boiling lysis. DNA was then screened for tetracycline resistance
genes
tet(A),
tet(B),
tet(C), and tet(E) as described by Ng et al. (49) using referent strains
provided by Dr. Marilyn Roberts (University of Washington). PCR assays were optimized using
QIAGEN HotStarTaq® master mix. The Qiagility® benchtop robot was used for PCR setup, and
the Qiaxcel® microcapillary electrophoresis system was used to identify the weights of the
amplified PCR products. All genotyping was conducted at the Molecular Epidemiology/
Microbial Ecology Laboratory (ME2), Kansas State University, Manhattan, KS.
Analysis
With the samples having been frozen and stored since the original CIPARS surveillance
study, it was important to determine whether the recoverability of
E. coli using historical samples
was affected by the freezing time. This was done using a simple logistic regression with the
dependent variable being the retested detection of
E. coli on the plain MacConkey plate with the
number of years frozen as the independent variable. Because only originally positive
E. coli
samples were retested, all of them should have tested positive had they been unaffected by
freezing. Assuming no other differences between the two tests, there were no other measured
variables that could have reasonably have affected the second test outcome other than the length
of time they were frozen.
Logistic predictions of the freezing effect were used to estimate the reduced detection
sensitivity for each year frozen using the original test result as a gold standard. While specificity
could not be estimated since only originally positive samples were followed up in this study, it
seems implausible that freezing would cause samples to produce
E. coli colonies when they
originally did not. Therefore, the specificity was fixed at one. These testing parameters were then
used to estimate the annual true prevalence of tetracycline and ceftiofur resistance at the sub-
population level during the sampling period. The annual number of caecal samples that produced
colonies on plain MacConkey was compared to the number producing colonies on selective agar
containing the antibiotics. True prevalence was estimated from these counts by adjusting for the
freezing effect using the publicly available Epitools software package (50).
The crude isolate counts of all possible log2 MICs for each antibiotic included in the
Sensititre panel were used to generate a distribution table across the entire sampling period.
These counts were stratified by the agar type generating a distribution for all NTS
E. coli at the
within caecum population level (N=1,268), and a more specific distribution for phenotypically
tetracycline resistant NTS
E. coli recovered from MacConkey containing tetracycline at the
within caecum population level (N=916). A distribution table was not calculated for isolates
recovered from MacConkey agar containing ceftiofur because there were so few isolates
recovered (n=26).
For the analysis of tetracycline gene detection results, the year variable was collapsed
into a binary decadal variable because only isolates from 2002, 2003, 2010, and 2011 were used.
Frequency distributions for all three genes were tabulated based on decade and agar type. These
distributions were used to determine whether recovered
E. coli populations changed over the first
millennial decade as well as any differences seen between populations recovered from
nonselective and selective methods. The relationship between harbored
tet genes and resistance
to antibiotics other than tetracycline was also evaluated. A multidrug resistance variable was
calculated for each isolate by taking the total number of antibiotics on the panel that had an MIC
above the established breakpoints and were classified as "resistant". Antibiotics that utilize a
three tier classification system were collapsed into a binary variable with "intermediate" isolates
being coded as "susceptible". Based on histograms of multiresistance number for either
tet(A) or
tet(B), a cutpoint was established splitting isolates with any phenotypic resistance into drug
categories of ‘1-3 drug resistances', and ‘>4 resistances'. This was then used to logistically
model whether agar type (i.e., selective versus non-selective) and the harboring of either
tet(A) or
tet(B) impact the likelihood of it having >3 drug resistances. Because there were no
tet(C)
isolates with >3 drug resistances that did not also harbor
tet(A) or
tet(B),
tet(C) was not included
in the model. This full-factorial model included
tet(A),tet(B), and broth type as covariates to
predict multiresistance as an outcome. A second bivariate logistic model was run using both
tet(A) and tet(B) as dual outcomes which included multiresistance coded as an ordinal variable
and broth for covariates. All statistical analyses were carried out using STATA® SE Release
Freezing Effect
Because archived samples had been frozen for multiple years, the freezing time was
tested as a potential confounder in that if older samples had overall reduced bacterial recovery,
prevalence estimates would also appear lower. The freezing effect was logistically modeled
using
E. coli recovery as the dependent variable with time frozen as an integer coded
independent variable. Indeed, freezer storage time did have a significant impact on the recovery
of
E. coli from the caecal samples (P<0.05). Samples frozen for shorter periods of time resulted
in higher recovery than older samples stored for extended lengths. Each year of storage time
resulted roughly in a 6% reduction in recoverability (Figure 2-3).
Prevalence of tetracycline and ceftiofur resistance
After cross-tabulating each apparent prevalence and adjusting for the associated reduction
in test sensitivity, the true prevalence of caecal samples exhibiting any growth on media
containing tetracycline ranged from 74% in 2002 to 90% in 2011 (Figure 2-4). This adjustment
inherently assumed that freezing was equally detrimental to all
E. coli both susceptibles and
resistants alike. Likewise the estimated true prevalence of any growth on MAC containing
ceftiofur was 2.5% in 2002 and 3.8% in 2011 (Figure 2-5). Because there were so few isolates
recovered from agar supplemented with ceftiofur (n=26), this agar category was not included in
downstream analysis when stratifying by agar type.
MIC distribution
Of 1,268 isolates recovered from nonselective MacConkey agar, 481 (37%) were
phenotypically resistant to at least one antibiotic in the Sensititre panel (Table 2-3). The most
common drug resistances were tetracycline (n=361 [28%]), sulfisoxazole (n=164 [13%]),
streptomycin (n=164 [12%]), ampicillin (n=37 [3%]), and chloramphenicol (n=33 [3%]).
Ciprofloxacin was the only drug with no isolate MIC recorded above the CLSI resistance
The MIC distribution pattern of isolates recovered from MacConkey containing
tetracycline was largely in agreement with the plain MacConkey distribution even though the
relative proportions were different (Table 2-4). In total, 70% (n=641) of the 916 isolates were
phenotypically resistant to at least one other drug in addition to tetracycline. As with isolates
recovered from nonselective agar; sulfisoxazole (n=477 [52%]), streptomycin (n=449 [49%]),
ampicillin (n=97 [11%]), and chloramphenicol (n=79 [9%]) were the most common resistances.
In this case, every antibiotic had at least 3 isolates with an MIC above its respective CLSI or
NARMS breakpoint; however, ciprofloxacin resistance was again the rarest phenotype recorded.
Multidrug Resistance
The majority of isolates recovered from plain MacConkey were pan-susceptible (62%)
(Figure 2-5). Unsurprisingly, isolates with a single resistance phenotype comprised the next
largest category (20%). This single resistance phenotype was almost always tetracycline
resistance. Notably, there was little difference in the proportion of isolates with 2 or 3 resistances
(7.2% and 7.9% respectively). After removing the pan-susceptible isolates, the proportions of
single, double, and triple resistances among isolates recovered from plain MacConkey were
47%, 22%, and 22% respectively (Figure 2-6). The multidrug resistance distribution of isolates
recovered on MacConkey containing tetracycline differed greatly from those recovered on
nonselective agar with the single, double, and triple resistance proportions being 31%, 27%, and
30% respectively (Figure 2-7). Aside from the obvious agar selection pressure eliminating
recovery of pan-susceptible isolates (i.e., all isolates were necessarily resistant to tetracycline in
the media at CLSI breakpoint of 16 µg/ml); the relative ratios indicate a selection bias against
singly resistant bacteria in favor of higher order multi-resistance numbers. This can be better
seen by plotting the proportional difference for each multiresistance category (Figure 2-8).
Tetracycline gene distribution
Of the four tetracycline genes tested, only
tet(A),
tet(B), and
tet(C) were found. The tet(E)
gene was not found in any of the isolates. Despite there being significant differences between
agar types, prevalence did not significantly change over the decade for any gene (Figure 2-9).
Among all
E. coli isolates recovered from plain MacConkey agar, isolates harboring only
tet(A),
tet(B), or
tet(C) were 9%, 13%, and 19% respectively. This was unexpected since
tet(B) is the
most commonly reported tetracycline gene and is considered to be the most widely disseminated.
However, the MIC distributions for each gene differed in that most
tet(C) isolates had an MIC
ranging from 4 to 16 ug/ml while
tet(A) isolates MICs were usually =32 or >32,
tet(B) isolates
always had a MIC of >32 µg/ml. Therefore, while nearly all
tet(A) and
tet(B) isolates were
phenotypically resistant, many isolates harboring
tet(C) were actually phenotypically susceptible
to tetracycline at breakpoint values (or intermediate before collapse of categories). When
comparing the relative proportions of only phenotypically resistant isolates, the
tet(A),
tet(B), and
tet(C) proportions were 27%, 40%, and 23% respectively (Figure 2-10). Among isolates
recovered from MacConkey supplemented with tetracycline, the proportion of
tet(A),
tet(B), and
tet(C) isolates were 17%, 67%, and 2% respectively. There were several isolates that harbored
multiple tetracycline genes, especially among isolates recovered from MacConkey containing
tetracycline. Multi-gene isolates were predominantly either AC or BC. However the AB
combination was rare. Only two isolates were found to harbor all three tetracycline genes.
Relationships between tet genes and multidrug resistance
The distribution of multiresistance in
tet(A) containing isolates was different enough from
those harboring
tet(B) to suggest that one may be more associated with higher orders of
multiresistance. The bimodal phenotypic resistance distribution of
tet(A) isolates showed that a
majority of these were singly resistant, but also there were some isolates with 9-12 resistances
(Figure 2-11). The distribution of
tet(B) differed in that single, double, and triple resistant
isolates were roughly equal in proportion (Figure 2-12) and represented a predominant mode to
the left of the scale from 0-15 resistances. Furthermore, the bimodal hump in the 9-12 resistances
category was not as pronounced as the
tet(A) distribution. The full-factorial logistic regression of
the association of tetracycline genes with high varieties of drug resistance (≥4 drug resistances)
confirmed that
tet(A) isolates were much more likely to harbor high numbers of phenotypic
resistance (Figure 2-13). In addition, the use of selective agar appeared to further increase the
probability of a
tet(A) isolate being multiresistant. This was further confirmed by the ordered
logistic model which demonstrated that while singly resistant isolates were equally as likely to be
of
tet(A) or
tet(B) genotype, double and triple resistant isolates were likely
tet(B) and
multiresistance greater than 3 were more likely to be
tet(A) (Figure 2-14).
Discussion
Tetracycline and Ceftiofur prevalence
There were two distinct estimates of antibiotic resistance prevalence for both tetracycline
and ceftiofur. The first is an isolate-level estimate of resistance among
E. coli populations in a
given caecal sample and this is what was determined and published in the annual CIPARS
reports. This is based off the MIC value of the single isolate taken from growth on nonselective
agar. When considering the case that the entire
E. coli population in a caecal sample will be a
mixture of both sensitive and resistant bacteria, the most dominant phenotypes are likely to be
selected when taking one colony from all colonies that grow on nonselective agar. Therefore, an
isolate with a MIC above the breakpoint suggests that resistant bacteria are in the caecal sample
at high enough proportions to be selected from the total bacteria population including
susceptibles. The second estimate is an animal/sample-level estimate of resistance. By using
media containing an antibiotic at the breakpoint value, the presence of growth indicates that a
caecal sample harbors at least one resistant bacterium regardless of whether it is only a very
small proportion of the total
E. coli in a caecal sample. In effect, the first predicts the prevalence
of resistance
E. coli among populations in caecal samples with seemingly high levels of
resistance (i.e., above some threshold) while the second predicts the prevalence of any resistant
E. coli in samples with any levels of resistance.
In the case of tetracycline resistance, the animal/sample-level prevalence was much
higher than the crude bacterial-level estimates. Even though 916 out of 1,368 (72%)
E. coli
positive caecal samples grew on Mac supplemented with tetracycline, only 361 out of 1,268
(28%) of isolates recovered from plain Mac exhibited an MIC above the breakpoint. This
suggests that tetracycline resistance was often present at low levels and went undetected in the
isolate-level screening. Further, while estimated animal-level resistance did not significantly
change, the bacterial-level prevalence did steadily increase between 2009 and 2011.
The confirmed low and stable prevalence of ceftiofur resistance is encouraging from a
human health perspective, and also of some comfort to beef cattle sectors of agriculture
(including fed beef and dairy beef) in Canada. The hypothesis that ceftiofur resistance was
increasing in prevalence, but was occurring at a level below the detection threshold of the
original CIPARS methodology did not hold true. This is perplexing given that it suggests that
when present, it is above the threshold of detection for surveillance using plain agar, and when
apparently absent using plain agar, it really is absent and not simply below limit of detection.
While indeed the sample-level prevalence of ceftiofur resistance was higher than the bacterial
population level prevalence, both were quite low and neither indicated any increase in resistance
over the decade. While 26 out of 1,368 (2%) of
E. coli positive caecal samples grew on Mac
containing ceftiofur, only 3 out of 1,264 (0.24%) isolates collected from nonselective agar had an
MIC above the breakpoint. The population level prevalence was effectively negligible and there
was no increase over the decade. The sample-level prevalence also relatively very low and did
not change over the decade.
Freezing effect
Before estimating resistance prevalence, it was important to account for any loss in test
sensitivity due to the samples having been frozen for many years. The effect of freezing on
caecal tissue samples was testable because results from the original surveillance tests could be
compared to post-freezing tests performed in this study.
There were 100 out of 1,368 samples in which no
E. coli was recovered, even though all
caecal samples used in this study originally had growth on nonselective Mac before being frozen
in a sample bank. Importantly, these were not evenly distributed across the sampling years.
Instead, older samples were more likely to have degraded to the point where
E. coli could not be
recovered at all. Had this effect not been quantified and treated as a reduction in sensitivity,
prevalence predictions for earlier years would have been underestimated and annual changes
would have artificially appeared to increase over time. Because the original testing only used
nonselective agar, it was not possible to determine whether the 6% sample loss per-year-of-
freezing is the same for nonselective media. However, a conservative assumption would be that
it is approximately the same. Nevertheless, there is a strong possibility that antibiotic pressures
on growth of free-compromised bacteria in caecal samples might further limit sensitivity and this
remains unknown.
It is quite uncommon for studies to account for the effects of freezing when using
historical samples. This is mostly because the historical unit of concern is usually the bacterial
isolate and not the sample matrix the isolate was recovered from; therefore the possibility of
determining reduced recoverability is not usually feasible. Even though there was sufficient
historical data regarding the samples in this study to estimate a freezing effect, most historical
sample databases probably do not have enough background data to do this. It is uncertain how
generalizable these intrinsically determined freezing effect estimates are given that no extensive
study has been done on the long-term viability of
E. coli in frozen faecal specimens. There is
research that demonstrates that by using a buffered glycerol-saline additive, viability is
drastically increased in frozen fecal samples(51). Larger volumes of sample likely also help; the
CIPARS samples were very small (1 ml) and so there is little protective effect of the sample for
bacteria in the core of the sample. In addition, freeze/thaw effects are more likely when freezer
doors are left open with small samples. Perhaps if other caecal samples were collected and stored
in a similar manner, the effect may be comparable. However, other materials such as tissue or
swabs would be affected very differently by freezing. Regardless, it is evident that storing and
freezing samples has clear potential to bias results, at least diagnostic sensitivity, and should
always be addressed and compensated for when possible.
Multidrug resistance
The top three drug resistance phenotypes found were tetracycline, sulfisoxazole, and
streptomycin. These drugs have been in use in animal agriculture for decades, and
E. coli is
already known to commonly be resistant to them. Likewise, their co-resistance with each other is
well established. It was perhaps unexpected that the levels of resistance were relatively low when
compared to other studies looking at resistance in commensal bacteria (52). Nonetheless, beef
cattle and dairy cattle
E. coli isolates are almost uniformly of lower resistance prevalence around
the world, especially among slaughter-age animals (31).
Distribution of tetracycline resistance genes
Though few, there are earlier studies that have also examined the relative distributions of
tetracycline resistance genes in various animal sources including cattle. Bryan et. al. (2004) (53)
conducted a study looking at tetracycline resistance in
E. coli isolated from different sources
including humans, pigs, chickens, turkeys, sheep, cows, and goats using a nonselective approach
to see what tetracycline resistance genes were present in nonclinical environments. They found
that roughly 30% of
E. coli isolated from cattle were resistant to tetracycline using a population-
level approach. This closely agrees with the 28% population-level estimate found in this study.
When they looked at genotype distributions, they found both
tet(A) and
tet(B) in cattle derived
isolates at a ratio of roughly 1:2. Even though
tet(C) was not found in any of the cattle isolates, it
was found to be significant in horses, dogs, humans, pigs, and sheep. Unfortunately, because the
authors only tested isolates that had a very high tetracycline MIC (≥93 ug/ml), the gene
distributions were likely biased, given
tet(C) appears to have MIC values much lower than their
exclusion cut-point. They were also not able to detect tet(E) in any of their isolates. Therefore, it
seems that tet(E) is probably extremely rare in
E. coli and does not contribute significantly to
tetracycline resistance levels, though its MIC distribution could also have precluded its
identification in this study.
The high occurrence of
tet(C) isolates is interesting because despite having a lower MIC,
it seems able to consistently persist in the commensal bacteria in cattle. The relatively low MIC
associated with
tet(C) does not seem to be restricted to only cattle and has been shown to be
potentially a widespread phenomenon for this specific resistance gene (54). It is peculiar that a
tetracycline resistance gene that often fails to actually provide resistance would be maintained in
the intestinal flora when there are many other tetracycline genes that provide resistance to higher
concentrations of tetracycline. One possible explanation for this is that while
tet(C) may not have
a selective advantage in the intestinal environment and may even have a marked disadvantage
when the animal is treated with tetracycline, and it may especially have an advantage in soil.
Most enteric bacteria spend a considerable amount of time between hosts in the ambient
environment. When Schmitt et. al. (2006) (55) looked at tetracycline resistance present in
agricultural soils fertilized with animal manure, they found that not all tetracycline resistance
genes present in animal manure were able to persist in the soil microbiome. In particular, despite
both
tet(B) and
tet(C) being clearly present in pig manure, only
tet(C) was found in the soil two
hours after applying manure to the landscape. While speculative, it may be that the ability of
tet(C) to persist in a soil or soil-like environment after being excreted may have something to do
with its relatively high prevalence in cattle. Volkova et. al. (2012) (56) comprehensively
modeled the dynamics of ceftiofur-resistance in commensal
E. coli living in the intestines of
cattle. In addition to variables such as bacterial population size, growth rate
in vivo, plasmid
fitness cost, and the concentration of antibiotic metabolites, they included an "in-flow" variable
that represented bacteria ingested by the cattle. Ultimately they found that this "in-flow"
component was an important factor in determining the burden of resistance in the commensal
E.
coli. Admittedly their model primarily focused on ceftiofur resistance but their conclusions also
may apply to tetracycline resistance. Due to the limited variety of ceftiofur resistance
determinants, they only were really concerned with the frequency of resistance and not the
diversity of resistance as an output. Nevertheless, this "in flow" effect may also have a similar
significant impact on the diversity of resistance exhibited when there are many possible
determinants such as the case of tetracycline resistance.
The notion that bacteria ingested by cattle significantly affect the intestinal flora may go
beyond explaining why
tet(C) was found at such a high prevalence and also help explain why the
relative proportion of tetracycline genes were stable over the course of a decade. Even without
data regarding the levels and diversity of tetracycline resistance present in the environments the
cattle in this study were exposed to, it is not unreasonable to assume that these environments are
considerably more stable in regards to the tetracycline resistance levels than the intestinal
environment in cattle. Numerous studies have shown that bacterial communities in soil are very
resilient to the selective effects of antibiotics. Hund-Rinke et. al. (2004) (57) investigated this by
spiking soil with bacterial resistance laden pig manure and then treating the soil with tetracycline
at varying concentrations to see whether strong selection can help establish resistance genes that
are present in the feces. They concluded that even very high concentrations (50mg/kg) of
tetracycline had little effect on the soil communities and that the environmental change from
manure to soil had a much larger impact on whether a particular resistance gene would persist in
Agar selective effect
The extreme difference in tetracycline resistance gene distributions based on which agar
the isolates were recovered from clearly demonstrates the dangers of introducing bias into a
study aiming to quantify the relative abundance of tetracycline genes in a bacterial population.
When grown on selective Mac containing tetracycline, very few isolates harbored only
tet(C)
despite it actually being the most common gene in isolates obtained nonselectively. In addition,
isolates that did harbor
tet(C) were more likely to also harbor
tet(A) or
tet(B). However, co-
resident
tet(A) and
tet(B) in any isolates was very uncommon which suggests an incompatibility
between the two genes or their associated plasmids. Comparing gene proportions between
nonselective and selective agars indicates that MacConkey agar with tetracycline strongly favors
isolates harboring
tet(B). Perhaps even more importantly, selective agar also was biased towards
recovering multidrug resistant bacteria. There was roughly a 30% reduction in isolates
possessing a single drug resistance while the two-, three-, and four-antibiotic categories were
respectively enriched by 10%, 9%, and 7%. There was also a slight enrichment for isolates with
>4 drug resistances, though these bacteria rarely harbored
tet(B). This finding certainly
demonstrates that isolates obtained from selective agar are not representative of the general
resistant population and should probably not be used as inference to the population as a whole.
Tetracycline co-resistance
When testing associations with resistances other than tetracycline,
tet(A) and
tet(B) were
both found to be highly associated with sulfisoxazole and streptomycin, while
tet(C) was not as
strongly associated with other resistances. Multiresistance histograms for
tet(A) and
tet(B)
indicate that
tet(A) may have a stronger association with phenotypes exhibiting >3 drug
resistances. When modeling the multiresistance variable using a cutpoint of >3 drugs,
tet(A) was
significantly more positively associated with MDR than
tet(B). The most common 4-drug
phenotype was streptomycin, sulfisoxazole, tetracycline, and chloramphenicol. Out of all isolates
genotyped that were phenotypically resistant to chloramphenicol, 48 out of 55 of them harbored
tet(A) while only 15 harbored
tet(B). This does seem to suggest an underlying correlation
between
tet(A) and chloramphenicol resistance that further molecular analysis would be able to
discern as to chromosomal or plasmid based biological genetic linkage. The common
cmlA
chloramphenicol gene and tetracycline and sulfamethoxazole resistance has already been
determined to be co-localized on transferable plasmids(58). However, particular associated
tetracycline genes were not identified. Given that
tet(A) and chloramphenicol are both plasmid
based, their correlation suggests that they may be localized on the same plasmid. The potential
for chloramphenicol resistance plasmids to preferably also harbor the
tet(A) gene specifically has
yet to be studied and warrants further inquery.
Conclusion
Historical samples obtained through the CIPARS program provided the opportunity to re-
evaluate antimicrobial resistance occurring in Canadian beef cattle over the past decade. The
core hypothesis was that ceftiofur and tetracycline resistances in Canadian beef cattle were
changing in both prevalence and diversity, albeit at levels below the detection threshold of the
original testing methods. Ceftiofur resistance did not appear to increase in prevalence over the
decade while tetracycline resistance at the sub-population level did increase from 2010 to 2011,
but has remained stable at the bacterial population level for the past decade. While multiple
tetracycline resistance determinants were detected, they were not evenly distributed. The
unexplained persistent success of
tet(C), despite having a lower MIC, and the possible
association between
tet(A) and chloramphenicol and other antibiotic resistances should be further
investigated because of their potential to explain these uneven distributions and perhaps take
advantage of such features to manage bacterial populations and select against multiple resistance
Figure 2-1 Bacterial isolation pipeline demonstrating how multiple bacterial isolates were
recovered from a single caecal sample
The original CIPARS surveillance testing consisted of plating a caecal sample on plain
MAC agar. If the sample exhibited growth, the MIC for one E. coli isolate selected from the
plate was tested via Sensititre. Caecal samples were then frozen and stored in a sample bank.
When re-evaluated, only caecal samples originally testing positive for E. coli growth were used.
These samples were parallel plated on MAC containing no antibiotic, tetracycline, or ceftiofur. If
there was growth on a plate, one isolate was selected and tested for resistance.
Figure 2-2 Custom NARMS plate CMV2AGNF
The custom NARMS plate CMV1AGNF tests for the minimum inhibitory concentration
to 15 different antibiotics. Each well contains a pre-determined concentration of antibiotic in
µg/ml. An appropriate range of log2 dilution concentrations are used for each antibiotic.
Figure 2-3 Model predictions for freezing effect
Freezing effect on E. coli recovery
* Because of the testing schedule, no samples were frozen for 3 years
The impact of freezing on recovery of
E. coli was logistically modeled. Because samples were
non-sequentially process, there were no samples that were frozen for 3 years.
Figure 2.4 Estimated True Prevalence of tetracycline resistance
The animal level prevalence (expressed as a proportion) of tetracycline resistance was
calculated after accounting for a varied reduction in test sensitivity due to freezing time.
Figure 2-4 Estimated True Prevalence of ceftiofur resistance
The animal level prevalence of ceftiofur resistance was calculated after accounting for a
varied reduction in test sensitivity due to freezing time.
Figure 2-5 Multiresistance Distribution of isolates recovered from plain MAC
Nonselective MacConkey (n=1268)
Number of phenotypic resistances from NARMS plate
The distribution of the multiresistance number calculated as the sum of drugs with an MIC above
breakpoint values for all isolates recovered from plain MAC
Figure 2-6 Multiresistance distribution of isolates recovered from plain MAC
(without pan-susceptible isolates)
Multiresistance Distribution (without pan-susceptible)
Nonselective MacConkey (n=401)
Number of phenotypic resistances from NARMS plate
The distribution of multiresistance calculated as the sum of drugs with an MIC above breakpoint
values for all isolates recovered from plain MAC not including pan-susceptible isolates
Figure 2-7 Multiresistance Distribution of isolates recovered from MAC+tetracycline
MacConkey+tetracycline 16 ug/ml (n=916)
Number of phenotypic resistances from NARMS plate
The distribution of the multiresistance number calculated as the sum of drugs with an MIC above
breakpoint values for all isolates recovered from MAC containing tetracycline
Figure 2-8 Proportional differences of multiresistance categories between agar types
(Pan-susceptible isolates were not included)
Agar differences in multiresistance number proportions
Multiresistance number
The proportional difference for each multiresistance category between plain MAC and MAC+tet
distributions. For example, singly resistant isolates were roughly 50% of the resistant population
recovered on plain MAC but were only 30% of the resistant population recovered on MAC+tet.
Figure 2-9 Tetracycline genotype proportions by decade and agar
Proportions of tetracycline genotype are stratified by agar and decade.
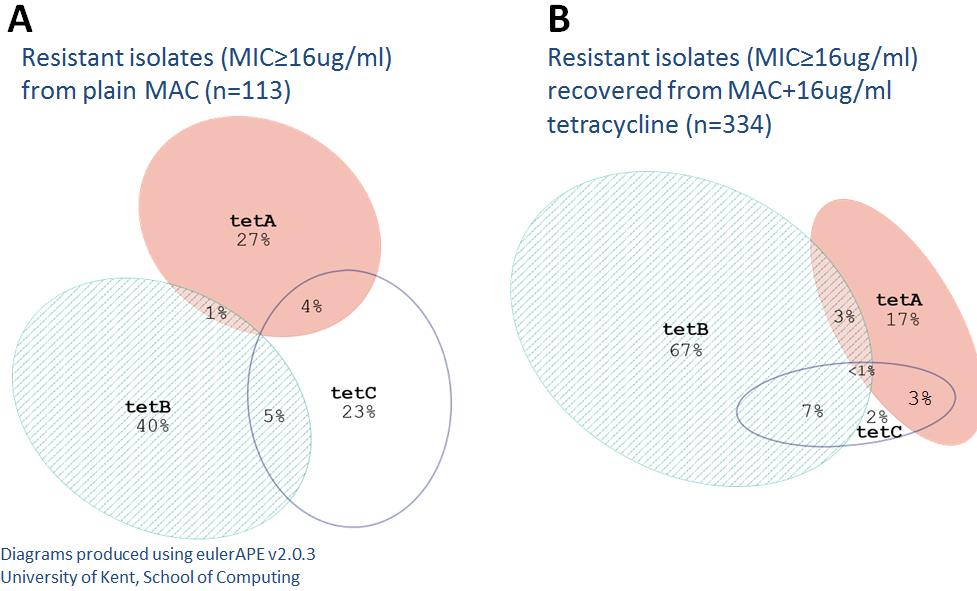
Figure 2-10 Proportional Venn diagrams of joint tetracycline genotype distributions
Isolates recovered from plain MAC (A) and isolates recovered from MAC+tetracycline (B)
Proportional venn diagrams demonstrate the difference in tetracycline gene distributions between
non-selective and selective MAC.
Figure 2-11 Multiresistance distribution of tet(A) positive isolates (n=130) to the 14 drugs
on the NARMS CMV2AGNF MIC plate
Multiresistance distribution of tetA positive isolates
Figure 2-12 Multiresistance distribution of tet(B) positive isolates (n=320) to the 14 drugs
on the NARMS CMV2AGNF MIC plate
Multiresistance distribution of tetB positive isolates
Figure 2-13 Probability of tetra-resistance (multiresistance ≥4)
Figure 2-14 Bivariate marginal predictions of tetA and tetB based on multiresistance and
Bivariate modeling of tetA and tetB
Multiresistance number
Neither tetA nor tetB
Table 2-1 Tabulated annual caecal samples positive for growth
No. samples used
growth positive on growth positive on
Table 2-2 Tabulated annual prevalence of positive growth adjusted for freezing effects
Samples Prevalence of
that grew that grew
Year Sensitivity annual
samples MAC+cef MAC+tet MAC+cef
Table 2-3 MIC distribution of isolates recovered from plain MAC
Table 2-4 MIC distribution of isolates recovered from MAC+tetracycline (16µg/ml)
Chapter 3 - Short-term population selection effects of
chlortetracycline and ceftiofur treatment on growth parameters of
commensal E. coli
Introduction
Despite evolutionary models growing increasingly complex, "survival of the fittest"
remains the core axiom of evolutionary theory. In a most basic sense, antimicrobials seem
capable of providing the motive force to drive evolution. The presence of both natural antibiotic
producers and antibiotic resistance genes in natural environments does suggest this has been in
existence for epochs of both bacterial and higher order life form existence (59). There is no
doubt that in an environment containing an antimicrobial, possessing resistance is massively
beneficial to the survival of a bacterium. However, what are the costs of having resistance genes
when that antimicrobial is not present? The synthesis of superfluous nucleic acids and proteins
theoretically should result in some reduction in growth potential. Yet, there is experimental
evidence suggesting that certain resistance determinants can persist in environments even after
antibiotics are removed, and for extended periods of time (60). At least some of these
determinants have been found to possess compensatory mutations or regulatory pathways that
could significantly alleviate fitness costs (61, 62). Even more surprising, multiple different
resistance determinants to the same antibiotic have been seen to co-exist in both antibiotic
pressured and naïve bacterial communities, such as is the case for tetracycline efflux genes (53).
Even though all three detected tetracycline genes in the CIPARS study maintained stable
prevalence proportions at the isolate-level, the strong selective effect of the agar as well as the
drastic difference in MIC distribution between the three genes seemed to indicate that short-term
selective pressure may differentially select for particular tetracycline genes at the animal-level.
This was not testable in the CIPARS isolates because none of the animals sampled would have
been undergoing antibiotic treatment due to a regulated withdrawal period before slaughter and
pre-withdrawal treatment history was unknown.
The primary objective of this second study was to investigate whether a strong short-term
selection pressure from antibiotic treatment with tetracycline or ceftiofur resulted in a differential
selection of gut flora in favor of bacteria with relatively higher fitness associated with the
antibiotic pressure. Further, the bacteria arising from different selection pressures were tested to
see whether particular resistance genes or phenotypic multi-drug resistance patterns were
associated with higher fitness values.
Materials and Methods
Previous studies
The E. coli isolates used in this study are the same isolates used in Kanwar et al. (2013)
(63). That previous study was designed to test whether co-administering chlortetracycline to
cattlefollowing ceftiofur treatment would impact the levels of ceftiofur and tetracycline
resistance among commensal E. coli. The researchers' findings and how they relate to the
isolates' relative fitness will be presented in the discussion section.
Field trial
88 steers were evenly distributed among eight pens. This process was a blocked
randomization procedure so that all pens had similar average weights. Two potential intervention
strategies were employed in a full two-way factorial design for a total of four treatment groups.
Pens were randomly assigned to one of four treatment groups (Figure 3-1). The four treatment
groups are as follows; all steers in pens 1 and 2 were treated with ceftiofur first and then
chlortetracycline, one steer in pens 3 and 4 was treated with ceftiofur and then all steers in pens 3
and 4 were treated with chlortetracycline, steers in pens 5 and 6 followed that of pens 1 and 2,
steers in pens 7 and 8 followed that of pens 3 and 4. Ceftiofur crystalline-free acid (6.6mg/kg)
was administered via a single subcutaneous injection on day 0 according to label
recommendations. Chlortetracycline (22mg/kg) was top-dressed on feed in three 5-day periods
starting on days 4, 10, and 16, with a one day break on days 9 and 15. Cattle were followed up
for 26 days with fecal samples being collected per rectum every other day starting on day 0
(figure 3-2). These fresh samples were mixed 1:1 with glycerol, placed in 5ml cryo-vials, and
stored at -70°C.
Samples subjected to isolation
Due to time and labor constraints, not all fecal samples underwent further bacterial
isolation. Only samples from days 0, 4, 12, and 26 were used. These days were chosen based on
the antibiotic dosing timeline. On day 0, neither antibiotic would have affected the gut flora yet.
Ceftiofur was administered starting on day 0 and would have exhibited full effect by day 4, when
the chlortetracycline was added to the feed, though no tetracycline effects was expected until day
12. Both antibiotics would have taken effect by day 12 and left the system by day 26.
Isolation of commensal E. coli
Selected fecal samples were thawed and 200 milligrams of each fecal sample were
diluted in 1.8 milliliters of buffered peptone water. Fifty microliter aliquots of the suspensions
were surface plated onto 10cm plates containing MacConkey agar (BL Difco™) using a spiral
plater (Eddy Jet; IUL Instruments). Colony forming unit counts were converted based on the
spiral plater settings to determine original CFU concentration. Three separate E. coli colonies
were picked from the original fecal sample spiral plate and further plated onto fresh MAC plates.
The purified E. coli isolates were then plated one more time on a trypticase™ soy agar plate (BL
Difco™) before further testing.
MIC determination
Antimicrobial susceptibility testing of pure isolates was performed using the Sensititre
(Trek Diagnostic Systems, Cleveland, Ohio, USA) automated broth microdilution system. The
custom National Antimicrobial Resistance Monitoring System (NARMS) panel CMV1AGNF
was used. Briefly, isolate colonies were taken from a trypticase soy agar plate and diluted to a
0.5 McFarland standard. This was added with Mueller Hinton broth to the 96-well plate
containing a panel of 15 antibiotics (Figure 3-3). These plates were incubated for 24 hours at
37°C and then read using the Sensititre ARIS® and Vizion™ systems (Trek Diagnostic Systems,
Cleveland, Ohio, USA). Antibiotic resistance was determined by first using CLSI guideline
breakpoints; however, not all antibiotics on the panes had established breakpoints. For these,
consensus breakpoints for enteric bacteria established by NARMS were used. Using described
breakpoints, isolates were coded as either resistant, intermediate, or susceptible. This three tier
system was later collapse into a binary classification to simplify downstream analysis. Isolates
that tested as having an intermediate resistance were recoded as susceptible. To ensure quality
control, the following strains were tested with each batch of Sensititre plates: E. coli ATCC
25922, E. coli ATCC 35218, Pseudomonas aeroginosa ATCC 27853, Staphylococcus aureus
ATCC 29213, and Enterococcus faecalis ATCC 29212.
Determining bacterial fitness
To obtain a general measurement of fitness cost incurred by bacteria harboring resistance
genes, a methodology was developed that allowed the testing of a large number of bacterial
isolates that was both cost and labor efficient.
Numerous studies have attempted to quantify the fitness cost associated with antibiotic
resistance (62, 64-66). The most common approach to assessing fitness cost is to use a
competitive growth assay. This process consists of inoculating a medium with an experimental
strain and a reference strain. The ratio of one strain to another is then measured over a specified
length of time. However, this method usually requires insertion of a resistance gene into a
laboratory adapted strain with some form of reporter to allow detection. Because of this, strains
used typically are not very representative of naturally resistant strains. Therefore, the results of
these experiments have very limited external validity.
While uncommon in antimicrobial resistance research, the use of growth curves is very
common in food microbiology (67, 68). The bacterial growth curve is characterized by a
succession of phases (Figure 3-4). After being inoculated into a broth or onto an agar plate,
bacteria will not divide for a brief time. This period is usually termed the lag phase. Once
division begins to occur, the rate of division slowly increases. This is usually called the
acceleration phase. Once maximum growth rate is reached, division continues at the constant
maximum rate for a period called the exponential phase. Then the growth rate starts decreasing
during the retardation phase until the bacterial population no longer increases and stabilizes. This
period is called stationary phase. Eventually, bacteria start to die off and the population decreases
during the death phase. No doubt, this generalized process is not without variation. Often, it is
difficult to identify when one phase ends and another begins. This is not overly surprising given
the vast number of physiological processes that culminate in biological growth. Furthermore,
complex growth cycles can occur, resulting in multi-modal curves (Figure 3-5). Many of these
phenomena can be explained by the selective metabolization of energy sources when there are
multiple sources in the environment, or as nutrient resources of certain types begin to dwindle
Historically, the gold standard for growth curve measurement is the change in colony
forming units (CFU) over time. However, manual counting is labor intensive and not conducive
to large sample sizes and high-throughput studies. Instead of CFU counting, spectrophotometric
values in the form of optic densities (OD) are used as a replacement or surrogate form of
measurement. Historically, there have been several reservations to using OD values instead of
CFU values. The primary concern is that a maximum growth rate determined from CFU values
can be clearly defined as the biological doubling rate while the maximum rate of increase in
optic density is not as directly linked to a biological rate. To address this concern, there has been
considerable effort to determine whether there is a clear correlation between growth rates
determined via CFU counts and growth rates determined via OD measurements. Due to the
complex shape of the growth curve, multiple differential equation models have been used to
generate values that allow CFU based curves to be compared to OD curves (70, 71). Ironically,
while the two rates are generally correlated, there is just as much disagreement about which
model equations are best as whether it is even beneficial to correlate the two rates for conversion.
There are several theoretical explanations as to why the two might differ, but the most likely
reasons are the impact of clumping and variability in cell size. Fortunately, using
spectrophotometric growth curves for the purposes of assessing fitness cost associated with
antibiotic resistance does not necessarily require a clear biologically defined growth rate. Instead
of requiring absolute growth parameters, relative differences in growth parameters may be just as
helpful in investigating different resistance determinants. Having ready access to an automated
spectrophotometer, several simple experiments were performed to assess the possibility of using
growth curves measured via OD to assess the relative fitness of antibiotic resistant bacteria
grown under different conditions.
Because minimum inhibitory concentration (MIC) determination is commonplace in
antibiotic resistance research, there was great value in identifying a way to incorporate growth
curve measurement into the general MIC protocol to allow for efficient parallel processing of
isolates. Shortly before inoculating a microbroth plate to determine MIC values, bacterial isolates
were diluted to a 0.5 McFarland standard. This standardized dilution step was identified as a
potential point for parallel processing because at this point, all isolates would be diluted to the
same concentration. To test whether this dilution step would provide reproducible results, eight
0.5 McFarland standards were prepared using ATCC laboratory control strains EC25922 and
EC35218. These dilutions were then successively diluted 1:2 eight times. An optical plate was
inoculated with these dilutions and McConkey broth was added. OD measurements were taken at
10 minute intervals for 24 hours using the Bioscreen C™ (Growth Curves USA, Piscataway, NJ)
automated spectrophotometer. Growth curves followed a simple monoauxic growth pattern and
did not exhibit any complex growth patterns such as diauxic curves. The replicate effect was
non-significant to the point that OD readings were essentially on top of each other from one
replicate to the next (Figure 3-6). Furthermore, the 2:1 dilutions were spaced at regular intervals.
Most importantly, it was easy to distinguish one strain from another.
Measurement of bacterial growth curves
The same bacterial isolates used to inoculate Sensititre plates were also used to inoculate
100-well optical plates. Isolates diluted to a 0.5 McFarland standard were added to plain
MacConkey broth in a 1:9 ratio for a final concentration of roughly 1.5*10 7 CFU/ml. In parallel
fashion, isolates were also added to MacConkey broth (BL Difco™) supplemented with
tetracycline at a concentration of 16 µg/ml, using the same dilution ratio. Optical plates were
incubated at 37°C and optic density was measured at 10 minute intervals with the plates being
shaken between measurements. Both incubation and spectrophotometric tasks were done using
the Bioscreen C™ (Growth Curves USA) automated microbiology growth curve analysis
system. Optic Density (OD) was measured using a wideband filter (420-480nm) to minimize
sensitivity to color changes in broth.
Qualitative detection of resistance genes
Previously described E. coli isolates were tested for the presence of multiple different
resistance genes that confer resistance to either tetracycline or ceftiofur. DNA from bacterial
isolates was prepared by boiling multiple pure colonies suspended in nuclease-free water.
Tetracycline resistance genes tet(A), tet(B), and tet(C) were detected using PCR methods
previously described (11). The third generation cephalosporin resistance gene blaCMY-2 was also
detected via PCR. Primers for all PCR reactions are listed in Table 3-1. The PCR processing
pipeline consisted of multiple automated laboratory machines. Plate preparation was carried out
using the QIAgility™ (Qiagen, Venlo, Netherlands) benchtop robot. Reactions were facilitated
using the Eppendorf Mastercycler® gradient thermal cyclers (USA Scientific, Inc., Ocala, FL).
Resulting PCR product was detected using the QIAxcel™ (Qiagen, Venlo, Netherlands)
microcapillary electrophoresis system. DNA extracted from the following strains was used for
quality control: E. coli ATCC 47042 (known to harbor tet(B)), E. coli XL1-Blue (known to
harbor tet(A)), and E. coli M1 (known to harbor blaCMY-2).
Statistical analysis
Because the bacterial growth curves were simply a set of OD measurements taken at
specified intervals, it was important to extract specific growth parameters that could be used in
downstream analysis. Based on initial tests with ATCC quality control strains EC25922 and
EC35218, two aspects of the growth curves were identified as being important for differentiating
one strain from another. These were the maximum growth rate during exponential phase and the
upper asymptotic OD reached at stationary phase (and its difference from the baseline OD value
at time = 0). Values appeared to be conserved for a particular strain over multiple replicates and
did not appear to be affected by the starting concentration of bacteria (Figure 3-6). To calculate
the maximum growth rate, the difference in OD between each interval was calculated and the
maximum increase was recorded as the max ΔOD/10 minutes. The stationary OD was calculated
by recording the maximum OD reached throughout the entire growth curve. To ease later
analysis, the starting OD was then subtracted from the maximum OD to give the parameter a
base of zero and can be thought of as the global ΔOD from lag phase to stationary phase. A
sample growth curve with estimated parameters is illustrated in Figure 3-7.
After the maximum slope and global ΔOD were determined for each isolate based on
their growth curve, these two parameters were studied first by assessing whether the animal level
treatment affected the overall distribution of growth parameters of the isolates. Multivariate
linear regression analysis was done using both growth parameters as dependent variables and
using the administration of ceftiofur and tetracycline, the selective media (tetracycline versus no
tetracycline), as well as day of collection as independent variables. All three covariates were
included as a full-factorial model. Additionally, both growth parameters were tested to see
whether any particular tet genes could be identified as having significantly different growth
parameters. Neither treatment nor day of collection was included in this latter model. All
statistical analysis was carried out using STATA® SE Release version 12.1.
MIC distributions
The MIC distributions of all 1,050 isolates to each of 15 antibiotics included in the
NARMS panel are presented in Table 4-2. Of all isolates, at least 1 antimicrobial resistance was
detected in 710 (67.62%) isolates; 340 (32.38%) isolates were found to be susceptible to all 15
antimicrobials. Tetracycline was the most common drug resistance (61.14%) with ampicillin
(37.24%), sulfisoxazole (31.33%), and streptomycin (29.33%) also being fairly common.
Tetracycline resistance gene selection
As reported in Kanwar et al. (2013), a generalized estimating equation (GEE) logistic
model was run to test whether treatments preferentially selected for tet(A) or tet(B) (Figure 3-8).
The likelihood of recovering isolates harboring tet(A) or tet(B) increased with ceftiofur treatment
(Figure 3-8A) . Cattle in the treatment group that received ceftiofur, but no chlortetracycline saw
an increase in tetracycline resistance prevalence for both tet(A) and tet(B) between day 0 and day
4 (5% to 25% for tet(A) and 5% to 35% for tet(B). The increased prevalence of tetracycline
resistance did not persist past day 4 and byi day 26, prevalence was roughly at the same value as
day 0.Cattle receiving only chlortetracycline, but no ceftiofur saw an increase in tetracycline
resistance prevalence for both tet(A) and tet(B) between day 4 and day 12 (20% to 35% for tet(A)
and 15% to 60% for tet(B). Combined treatment with ceftiofur and chlortetracyclineresulted in
an increase in resistance prevalence for both tet(A) and tet(B) between day 0 and day 4, as well
as a second increase between day 4 and day 12 (30% to 50% to 60% for tet(A), 10% to 25% to
30% for tet(B)) (Figure 3-8C). While ceftiofur treatment more favorably selected for tet(A) over
tet(B), whether or not chlortetracycline was co-administered, treatment with chlortetracycline
alone favorably selected for tet(B) over tet(A) (Figure 3-8D).
Growth curve parameter values
In total, growth parameters for 1,056 bacterial isolates were determined from their growth
curves. Because each isolate was grown in both plain MAC broth and MAC broth containing
tetracycline, two sets of parameters were calculated for each isolate. Overall histograms of
growth parameters for each broth are presented in Figures 3-9 and 3-10. While all isolates were
capable of growing in plain MAC broth, not all isolates grew in MAC broth containing
tetracycline. This resulted in both maximum slope and global ΔOD distributions for the
MAC+tet broth to have a strong zero inflation characteristic. However, aside from this inflation,
growth parameters appeared reasonably normally distributed conditioned on them being capable
of growing in the broth (Figure 3-10).
Treatment effect on growth parameters
While the treatments did not impact the ΔOD parameter of sensitive and resistant isolates
when grown in plain MAC broth (all had ΔODs around 1.5 with 95% CI's completely
overlapping), all treatments resulted in increased ΔODs for resistant isolates when grown in
MAC broth containing tetracycline (Figure 3-11). As expected, the ΔODs for susceptible isolates
when grown in MAC+tet broth were zero because the antibiotic inhibited any growth. The
predicted increase in ΔOD for resistant isolates grown in MAC+tet broth closely matches the
dosing timeline with there being little overlap in 95% confidence intervals when a treatment
effect was observed. E. coli recovered from cattle treated with ceftiofur on day 0 (0.48
[0.29,0.68]) exhibited an increase in ΔOD on day 4 when grown in MAC+tet broth (1.23
[1.12,1.34]). E. coli recovered from cattle treated only with chlortetracycline exhibited an
increase in ΔOD between day 4 (0.834 [0.70-0.97]) and day 12 (1.32 [1.22-1.43]).
Administration of ceftiofur on day 0 and then chlortetracycline on day 4 resulted in a ΔOD
pattern similar to cattle only treated with ceftiofur and the additional treatment with
chlortetracycline did not further increase ΔOD values (day 0: 1.13 [1.00,1.25], day 4: 1.36
[1.25,1.46], day 12: 1.42 [1.32,1.52].
Marginal predictions for the maximum growth rate followed a pattern similar to
predictions for ΔOD (Figure 3-12 & Figure 3-13). Phenotypically resistant isolates recovered
after animals were treated with antibiotics had a higher growth rates in broth containing
tetracycline than those recovered pre-treatment. Like ΔOD, both tetracycline and ceftiofur
treatment selected for isolates with higher growth rates, but dual administration with ceftiofur
and tetracycline did not result in increased growth rates beyond day 4 of treatment with ceftiofur
Growth parameters based on tetracycline resistance genotype
When collapsed across days and treatment, growth parameters differed based on which
tetracycline genes were present (Figures 3-14 & 3-15). Most significantly, tet(C) exhibited a
drastically reduced ΔOD and maximum growth rate (ΔOD: 0.16 [0.10,0.23]) compared to tet(A)
(ΔOD: 1.34 [1.29,1.38]) and tet(B) (ΔOD: 1.40 [1.35,1.45]) with there being no overlap in 95%
CIs. However, isolates harboring tet(C) and either tet(A) or tet(B) did not have reduced growth
parameters compared to those with only tet(A) or tet(B).However, because isolates containing
multiple tet genes were so rare, 95% confidence intervals were much wider for these genotypes.
Interestingly, isolates harboring only tet(B) had higher maximum growth rate values than
tet(A)when grown in MAC+tet (tet(B)= 0.23 [0.21,0.24], tet(A)=0.19 [0.18,0.20]). The
diminished growth parameter estimates for tet(C) were partly due to a lower MIC compared to
tet(A) an stet(B), but tet(C) still had lower growth parameters even when phenotypically
susceptible isolates were excluded from the model with there being no overlap in 95%
confidence intervals (Figures 3-16 & 3-17).
Discussion
The primary goal of this project was to investigate whether treating an animal with either
chlortetracycline or ceftiofur affected the relative fitness of commensal E. coli recovered
throughout the treatment. Further, the growth parameters of isolates carrying any combination of
tet(A), tet(B),or tet(C) were compared. This aim of quantifying the effect of short-term antibiotic
use on the ecological fitness of commensal bacteria using growth curves is unprecedented.
However, before observed differences in growth parameters can be properly discussed, it is
important to explore a few prior studies that gave rise to the hypotheses tested in this study.
Platt et al. (2008) (37) found that the selective effects of treating cattle with
chlortetracycline on commensal E. coli resulted in a significantly increased likelihood to recover
tetracycline resistant isolates from cattle treated with chlortetracycline (37). This increase was
temporary and by 33 days post-treatment, the ratio of recovered sensitive and resistant bacteria
returned to pre-treatment levels. Importantly, the levels of ceftiofur resistance were also
measured and chlortetracycline treatment was shown to drastically reduce the likelihood of
recovering ceftiofur resistant E. coli during the treatment period. Given that ceftiofur resistance
is seldom found without a co-resistance to tetracycline, the paradoxical selection against
ceftiofur resistance during chlortetracycline treatment suggested that the possession of ceftiofur
resistance may result in a lower overall relative fitness compared to tetracycline resistant strains
without ceftiofur resistance; that is, when grown in the presence of tetracycline.
In an unpublished follow-up study, simple growth curves were generated for all
previously obtained isolates. Even without a more in-depth analysis by calculating specific
growth parameters, there were several observations that allowed comment regarding the impact
of chlortetracycline treatment on growth curves of commensal E. coli. Growth curves of isolates
recovered post-treatment appeared to be roughly similar to pre-treatment isolates when grown in
plain MacConkey broth (Figure 3-18). However, when grown in MacConkey broth containing
tetracycline, growth curves of post-treatment isolates had a much tighter grouping pattern than
pre-treatment and control group isolates (Figure 3-19). A reasonable hypothesis for these
observations is that a variety of tetracycline resistance determinants in E. coli populations have
relatively equivalent fitness in non-selective environments but may not be equally as fit to grow
in environments containing tetracycline. When the cattle were treated with tetracycline, the most
fit tetracycline genes may have dominated both susceptible isolates and resistant isolates that had
lower fitness. This may explain the paradoxically reduced recovery of ceftiofur resistant bacteria
from cattle treated with chlortetracycline despite ceftiofur resistance being strongly linked to
tetracycline resistance.
Kanwar et al. (2013) explored whether chlortetracycline's seemingly paradoxical
negative selective potential against ceftiofur resistance could be used to reduce the selective
effect of treatment with ceftiofur. The researchers ultimately found that chlortetracycline did not
have the same effect found by Platt et al. (2008). Ultimately, further administering
chlortetracycline following ceftiofur treatment only seemed to further select for ceftiofur
resistant bacteria and further delayed the temporary window that ceftiofur resistance dominated
the commensal E. coli.
The growth curves from the Platt et. al. (2008) trial provided a framework to generate a
general hypothesis regarding the selective effects of chlortetracycline treatment on the
population dynamics of commensal E. coli. First, the initial passage of antibiotic through the gut
would not only result in an expansion of resistant bacteria, but would also preferentially select
for the fittest bacteria among the latent resistant populations present before selection. However,
as the antibiotic leaves the animal, the fitness advantage of these dominating bacteria wanes and
the population returns to its original equilibrium.
Under the assumption that the parameters estimated in this study are a surrogate of
bacterial fitness, our results confirm this, at least in part. Indeed, both the global ΔOD and the
maximum growth rate increased among the recovered resistant populations of E. coli following
antibiotic treatment when grown in broth containing tetracycline. This increase closely
corresponded to the dosing timeline and was followed by a slow return towards pre-treatment
values. This rise and fall pattern was not specific to chlortetracycline treatment and also occurred
with ceftiofur treatment as well.
Generalized estimating equation models of tet(A) and tet(B) prevalence following
treatment presented in Kanwar et. al. 2013 suggested chlortetracycline does have favorably select
for tet(B). This observation is in agreement with what was observed in Platt et. al. (2008) even
though this favorable selection was unable to provide sufficient counter-selection against
ceftiofur resistance in the Kanwar trial. However, both genes seemed to be equally capable of
growing in MAC+tet broth with tet(B) only having a slightly higher maximum growth rate than
tet(A). While the drastically lower growth parameters for tet(C) was no surprise, this resistance
gene also was the only gene to have significantly reduced fitness in MAC broth without
The lack of any difference in growth parameters between resistant and susceptible
isolates when grown in plain MAC broth may have an actual biological basis. Given that
tetracycline efflux pump genes generally have tightly controlled regulators (6, 62), it is possible
that the carriage of these genes do not carry a high fitness cost. Nguyen et. al. (1989) (62)
actually attempted to test the fitness effect of Tn10 tetracycline-resistance operons by artificially
introducing different elements into E. coli K12. They found that while induced and constitutive
expression of the resistance protein did incur a fitness reduction, carriage of the plasmid itself
had only a minimal impact on fitness. However, this fails to explain why resistant bacteria only
transiently dominate the commensal community following a strong drug selection and after the
pressure is removed, susceptible bacteria return. Instead, the lack of differences in growth
parameters may be because of how the growth curves were generated. Keep in mind that the
isolates were grown in a nutrient rich aerobic environment. While the growth parameters provide
a surrogate measure of fitness, they are not all-encompassing. Given that energy production and
conservation is much more important in anaerobic growth conditions, planktonic aerobic growth
curves may not be an accurate representation of anaerobic fitness. In the case of using plain
MAC broth, relative fitness differences (or lack thereof) seem especially non-representative in a
biological sense. Therefore it doesn't really make sense to equate growth in plain MAC to an
intestinal environment without any antibiotic selection pressure. Ironically though, the
observation that all isolates behaved very similarly in plain MAC broth may actually give more
credence to the differences seen when grown in MAC+tet. This is because the differences can be
more attributed to the antibiotic effect and not the broth itself. Examining growth curves of these
isolates when grown in anaerobic conditions may reveal fitness differences to explain why
susceptible bacteria repopulate after a short-term antibiotic treatment in the case of ceftiofur and
tetracycline resistance.
In conclusion, there does in fact seem to be some selection favored toward particular
tetracycline genes at least when either tetracycline or ceftiofur is present. While the selection
advantage of tet(B) over tet(A) is arguable, both of these genes clearly have a huge advantage
over tet(C). Suprisingly, ceftiofur is just as capable of selecting bacteria with a high fitness when
grown in media containing tetracycline. Ultimately, the use of simple growth curves is unable to
explain why the highly fit resistant bacteria cannot persist at high numbers and are ultimately
replaced by susceptible bacteria as soon as the selection pressure is removed. This may be due to
the methodology not being sensitive to smaller differences in fitness. Nevertheless, it is clear that
a much better understanding of bacterial fitness will be required to fully explain the transient
selection effect of antibiotic treatment.
Figure 3-1 Schematic diagram of the study design adapted from Kanwar et. al. 2013
88 steers were randomly allocated to one of four treatment groups divided into eight
pens. The four treatment groups are as follows; all steers in pens 1 and 2 were treated with both
ceftiofur and chlortetracycline, all steers in pens 3 and 4 were treated with ceftofur and none
received chlortetracycline, one steer in pens 5 and 6 were treated with ceftiofur and all steers
were treated with chlortetracycline, one steer in pens 7 and 8 were treated with ceftiofur and
none received chlortetracycline.
Figure 3-2 Antibiotic treatment dosing timeline adapted from Kanwar et. al. 2013
Ceftiofur treatment consisted of a 6.6mg/kg dose of Excede ceftiofur crystalline free acid
subcutaneously on day 0. Chlortetracycline was top-dressed on feed (22mg/kg) in three 5-day
periods starting on days 4, 10, and 16. Chlortetracycline treatment periods are shown in dark
Figure 3-3 Custom NARMS plate CMV1AGNF
The custom TREK® NARMS plate tests for minimum inhibitory concentration values
for 14 different antibiotics. Antibiotic concentration ranges (in µg/ml) encompass current CLSI
Figure 3-4 Simplified Monoauxic Growth Curve
This is a simplified example of a monoauxic growth curve of bacteria grown in broth
measuring the optic density over time. This illustrates the basic phases of the bacterial growth
curve: lag phase, acceleration phase, exponential growth phase, stationary phase, and death
Figure 3-5 Simplified Diauxic Growth Curve
This is a example of a more complicated diauxic growth curve in which bacteria goes
through two cycles of phases. This is usually due to multiple sources of energy being present in
the growth medium, but can also be due to many other factors.
Figure 3-6 Growth curves of ATCC strains EC25922 and EC35218
Two different ATCC quality control strains were grown in plain MacConkey agar using a
scheme of successive 1:2 serial dilutions. Each dilution was done in seven replicates. Each
growth curve was fit using a modified Gompertz equation (compliments of Stephan Guillossou)
for illustration purposes. Replicates had very little variation to the point that the curves stacked
on top of each other. A change in inoculation concentration (dilution) affected neither the
maximum slope nor the maximum OD reached but did increase the lag time.
Figure 3-7 Sample growth curve with estimated growth parameters
Simple growth parameters were estimated from the entire bacterial growth curve. The
maximum slope was estimated by recording the maximum increase in optic density over a single
10 minute interval. The global change in optic density (ΔOD) was estimated by taking the
difference between the maximum and minimum optic densities recorded throughout the entire 24
Figure 3-8 Prevalence of tetracycline-resistant E. coli isolates, modeled as marginal
predicted probabilities, over days adapted from Kanwar et. al. 2013
Solid line represents the proportion of NTS E. coli isolates expressing phenotypic tetracycline
resistance; dashed line represents the proportion of NTS E. coli isolates harboring the tet(A)
gene; dotted line represents the proportion of NTS E. coli isolates harboring the tet(B) gene. The
4 treatment groups are: (A) CCFA administered to all steers within pens without subsequent
CTC administration at pen level; (B) CCFA administered to 1 out of 11 steers within pens
without subsequent CTC administration at pen level; (C) CCFA administered to all steers within
pens followed by CTC administered at pen level; (D) CCFA administered to 1 out of 11 steers
within pens followed by CTC administered at pen level.
Results provided compliments of Neena Kanwar, Kansas State University
Figure 3-9 Histogram of the global difference in OD stratified by broth
Histograms of the global difference in OD when stratified by broth demonstrate that
overall, isolates capable of growing in the broth have a reasonably normal distribution. However,
isolates susceptible to tetracycline create a strong zero inflation when grown in MAC+tet.
Figure 3-10 Histogram of the maximum slope stratified by broth
Histograms of the maximum slope when stratified by broth demonstrate that overall,
isolates capable of growing in the broth have a reasonably normal distribution. However, isolates
susceptible to tetracycline create a strong zero inflation when grown in MAC+tet.
Figure 3-11 Marginal predictions of ΔOD based on animal treatment
Predicted global change in optic density throughout treatment
Susceptible isolates (MIC<16) grown in plain MAC
Susceptible isolates (MIC<16) grown in MAC+tet
Resistant isolates (MIC>=16) grown in plain MAC
Resistant isolates (MIC>=16) grown in MAC+tet
Only chlortetracycline
Both chlortetracycline and ceftiofur
The four sub-graphs represent modeled marginal predictions of the mean global change
in optic density factored on treatment, broth, tetracycline resistance, and day. The two left graphs
provide a comparison of fitness between susceptible and resistant isolates when grown in plain
MAC. Both susceptible and resistant groups had a ΔOD around 1.5 with 95% CIs heavily
overlapping when grown in plain MAC. The two right graphs provide a comparison of fitness
between susceptible and resistant isolates when grown in MAC containing tetracycline. The
upper right graph demonstrates that all phenotypically susceptible isolates had no change in ΔOD
which accounts for the negative inflation seen in Figure 3-9. In the bottom right graph, the
selective effect of ceftiofur and chlortetracycline appear to select for isolates with higher ΔOD.
From day 0 to day 4, the mean ΔOD of resistant E. coli in cattle receiving only ceftiofur
increased from 0.48 [0.29,0.68] to 1.23 [1.12,1.34]. This increase between day 0 and 4 was not
observed in cattle not receiving ceftiofur with no overlap in 95% confidence intervals. From day
4 to day 12, the mean ΔOD of resistant E. coli in cattle receiving only chlortetracycline increased
from 0.83 [0.70,0.97] to 1.32 [1.21,1.43].
Figure 3-12 Marginal predictions of maximum slope based on animal treatment
Predicted maximum slope throughout treatment
Susceptible isolates (MIC<16) grown in plain MAC
Susceptible isolates (MIC<16) grown in MAC+tet
Resistant isolates (MIC>=16) grown in plain MAC
Resistant isolates (MIC>=16) grown in MAC+tet
Only chlortetracycline
Both chlortetracycline and ceftiofur
The four sub-graphs represent modeled marginal predictions of the maximum slope
factored on treatment, broth, tetracycline resistance, and day. The two left graphs provide a
comparison of fitness between susceptible and resistant isolates when grown in plain MAC. The
two right graphs provide a comparison of fitness between susceptible and resistant isolates when
grown in MAC containing tetracycline. The upper right graph demonstrates that all
phenotypically susceptible isolates had no change in OD which accounts for the negative
inflation seen in Figure 3-10. The bottom right graph is enlarged and presented more in-depth in
Figure 3-13 Marginal predictions of maximum slope of resistant isolates grown in
MAC+tet based on animal treatment (enlarged)
Predicted maximum slope throughout treatment
Resistant isolates (MIC>=16) grown in MAC+tet
Only chlortetracycline
Both chlortetracycline and ceftiofur
Marginal predictions of the maximum slope factored on treatment, broth, tetracycline
resistance, and day for phenotypically tetracycline resistant isolates have been enlarged to better
show the treatment effect on resistant isolates as well as the clear separation in 95% confidence
intervals. Marked increases in mean maximum slope correspond closely to the treatment
timeline. Ceftiofur injections were given on day 0 and E. coli recovered from cattle receiving
ceftiofur had significantly higher maximum slopes on day 4 when ceftiofur would have had full
effect (p<0.05). Likewise, chlortetracycline treatment began on day 4 and E. coli recovered from
cattle receiving chlortetracycline had significantly higher maximum slopes on day 12 when
chlortetracycline would have had full effect (p<0.05).
Figure 3-14 Marginal predictions of ΔOD based on tetracycline genotype
Predicted global change in OD based on tetracycline genotype
Tetracycline resistance genes
Modeled marginal predictions of the global change in optic density were factored by
tetracycline genotype and broth. All isolates were included in this analysis including
phenotypically sensitive isolates. However, not all isolates that tested positive for a tetracycline
resistance gene also tested phenotypically resistant to tetracycline (MIC≥16µg/ml).
Figure 3-15 Marginal predictions of maximum slope based on tetracycline genotype
Predicted maximum slope based on tetracycline genotype
Tetracycline resistance genes
Modeled marginal predictions of the maximum slope were factored by tetracycline
genotype and broth. All isolates were included in this analysis including phenotypically sensitive
isolates. However, not all isolates that tested positive for a tetracycline resistance gene also tested
phenotypically resistant to tetracycline (MIC≥16µg/ml).
Figure 3-16 Marginal predictions of ΔOD based on tetracycline genotype (only
phenotypically resistant isolates)
Predicted maximum slope based on tetracycline genotype
only phenotypically resistant isolates (MIC>=16)
Tetracycline resistance genes
Modeled marginal predictions of the global change in optic density were factored by
tetracycline genotype and broth. Only phenotypically resistant isolates (MIC≥16µg/ml) were
included in this analysis.
Figure 3-17 Marginal predictions of maximum slope based on tetracycline genotype (only
phenotypically resistant isolates)
Predicted global change in OD based on tetracycline genotype
only phenotypically resistant isolates (MIC>=16)
Tetracycline resistance genes
Modeled marginal predictions of the maximum slope were factored by tetracycline
genotype and broth. Only phenotypically resistant isolates (MIC≥16µg/ml) were included in this
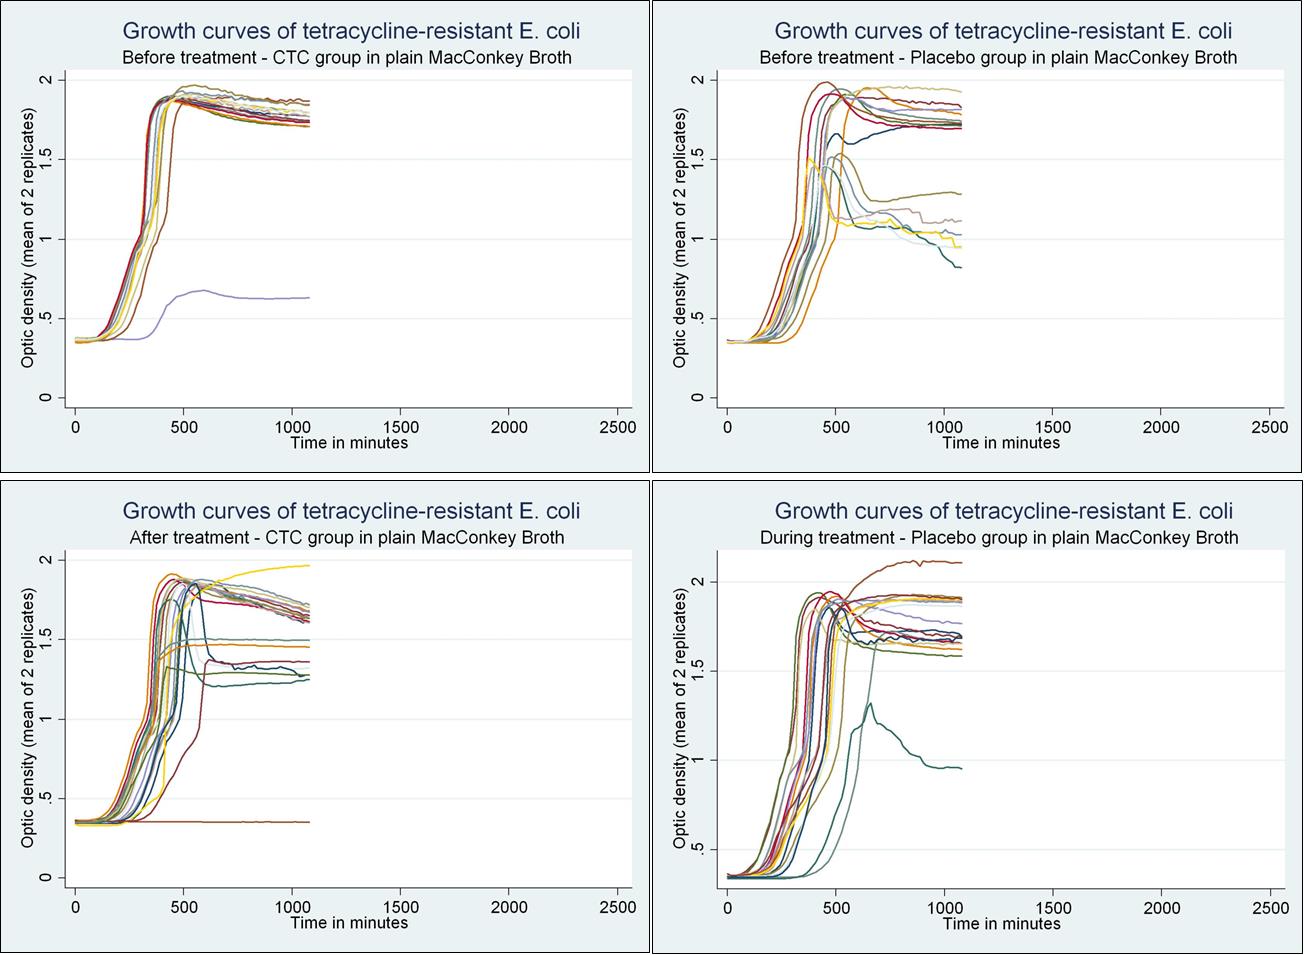
Figure 3-18 Unpublished Growth curves of isolates recovered from Platt et. al. 2008 when
grown in plain MAC broth (provided by Dr. Javier Vinasco, Kansas State University)
Analysis provided compliments of Javier Vinasco, Kansas State University
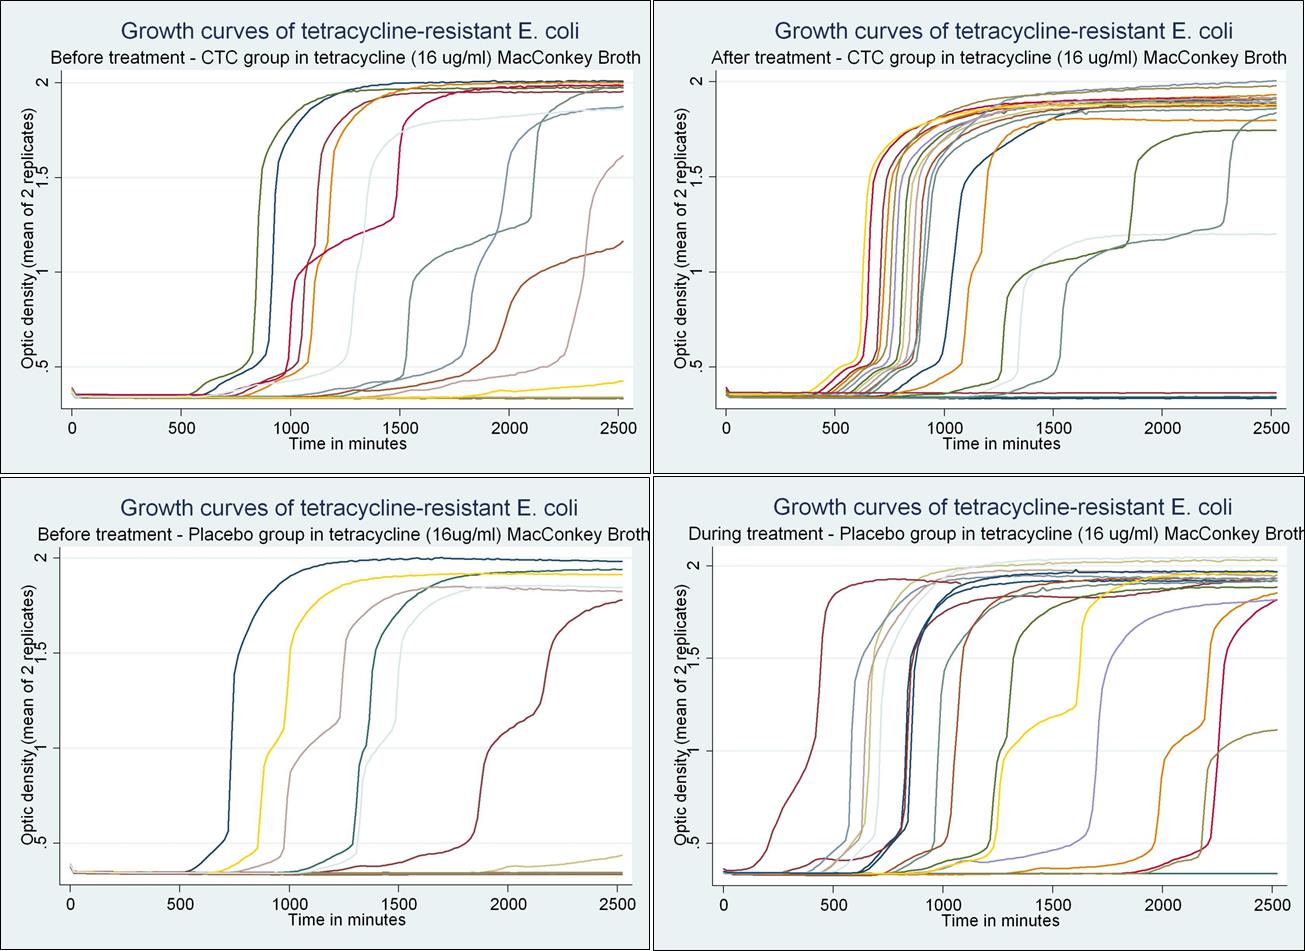
Figure 3-19 Unpublished Growth curves of isolates recovered from Platt et. al. 2008 when
grown in MAC broth containing tetracycline (16µg/ml) (provided by Dr. Javier Vinasco,
Kansas State University)
Analysis provided compliments of Javier Vinasco, Kansas State University
Table 3-1 PCR primers used for PCR reactions
5'- CAG ACG CGT CCT GCA ACC ATT
5'- TAC GTA GCT GCC AAA TCC ACC
tet(A)(F) 5' -GCTACATCCTGCTTGCCTTC- 3'
tet(A)(R) 5' -CATAGATCGCCGTGAAGAGG- 3'
5' -TTGGTTAGGGGCAAGTTTTG- 3'
5' -GTAATGGGCCAATAACACCG- 3'
tet(C)(F) 5' -CTTGAGAGCCTTCAACCCAG- 3'
tet(C)(R) 5' -ATGGTCGTCATCTACCTGCC- 3'
aPrimer set used is from Alali et. al. (2009) (72)
bPrimer set used is from Ng et. al. (2001) (49)
*Sequence used for primer design
Table 3-2 Distributions of minimum inhibitory concentrations of 1,050 E. coli isolates to NARMS antibiotic panel
CMV1AGNF
% Resistant 95% CI2
Distribution of MICs in ug/ml (%)
<0.015 0.015 0.03 0.06 0.125 0.25
128 256 512 1024 >1024
0.10 5.43 80.29 14.00 0.19 0.00 0.00 0.00
8.57 27.33 22.10 2.57 2.19 3.24 34.00
/Clavulanic Acid*
5.81 15.05 43.43 13.52 3.52 15.52 3.14
70.38 2.67 0.86 0.67 4.48 9.05 3.24 1.81 4.95 1.90
5.05 47.33 20.57 3.62 2.67 20.76
87.62 1.90 0.38 1.05 5.33 0.48 0.10 0.00 0.10 3.05
/Sulfamethoxazole** 4.00
54.00 37.81 4.00 0.00 0.19 0.29 3.71
0.00 3.33 11.14 43.52 19.71 3.24 10.86 8.19
1.24 67.33 22.10 0.95 3.52 3.90 0.29 0.67
86.95 3.05 5.43 2.10 2.48
0.19 7.90 75.71 4.86 0.86 0.86 0.95 8.67
61.52 4.57 0.76 0.86 0.95 31.33
70.67 9.24 20.10
30.67 8.19 5.62 12.19 43.33
4.86 18.38 47.43 2.10 1.14 3.14 9.43 13.52
Chapter 4 - Final Conclusions and Implications
Conclusions
The core objective of this thesis were to explore and identify epidemiological properties
of tetracycline and ceftiofur resistant commensal E. coli present in the intestines of cattle. Both
ceftiofur and tetracycline were focused on not only because of their medical importance, but also
because both drugs were hypothesized to be undergoing evolutionary patterns that could be
identified in the two experiments presented. Cattle were focused on partially to fill in the
research gap regarding AMR in cattle when compared to more heavily researched animal
agricultural systems such as pork and poultry, but also because tetracycline and ceftiofur
resistance are not currently as widespread in cattle.
In the first experiment presented, the aim was to determine basic epidemiological
properties of tetracycline and ceftiofur resistance in the Canadian beef production system beyond
what the current CIPARS surveillance program is capable of. This was done by using selective
media containing tetracycline and ceftiofur. This allowed for the estimation of both an animal
and isolate level prevalence for both ceftiofur and tetracycline resistance. The hypothesis was
that ceftiofur resistance was present in cattle at levels below the detection threshold of the isolate
level surveillance being done by CIPARS. Ultimately, ceftiofur resistance was not found to be
clandestinely present below current detection limits and had a low animal level prevalence that
did not change from 2002 to 2011 (<4% of caecal samples). Tetracycline resistance however did
have a higher animal level prevalence compared to the isolate level prevalence (74%-90% for the
animal level prevalence and 28% for the isolate level prevalence). Furthermore, while the isolate
level prevalence did not increase over the decade, the animal level prevalence rose between 2009
In addition to investigating phenotypic resistance, the first study dove deeper and looked
at the genotypic variation in tetracycline genes by testing all isolates for four resistance genes
commonly found in E. coli (tet(A), tet(B), tet(C), and tet(E)). While tet(A), tet(B), and tet(C) were
found, tet(E) was not detected in any of the isolates. When the relative abundance of tetracycline
genes was tested to see whether there was change over the decade, it was found that the relative
proportions of genes did not change. However, the usage of selective agar was found to bias
genes recovered and result in much higher proportions of isolates harboring tet(B). When tet(A)
and tet(B) were tested for correlation to multidrug resistance, tet(A) was found to have a higher
association with multidrug resistance phenotypes. In particular, tet(A) was specifically associated
with chloramphenicol resistance which warrants further molecular investigation.
In the second study presented, the aim was to see whether the growth curves of E. coli
recovered from cattle undergoing antimicrobial treatment would explain the transient rise and
fall of AMR observed in commensal bacteria during an antimicrobial treatment regimen. Two
core hypotheses to explain this were that resistant isolates were more fit in the presence of
antimicrobials, but had reduced fitness when the antimicrobial was absent. A supporting
hypothesis was that even among different tetracycline genes, particular genes incurred lower
fitness costs than others.
While it was not surprising that tetracycline resistant bacteria had growth parameters that
were higher than susceptible bacteria when grown in the presence of tetracycline, it was
interesting that treating cattle with tetracycline or ceftiofur resulted in selecting among resistant
bacteria for those with higher growth parameters when grown in the presence of tetracycline.
More importantly, when looking at the mean growth parameters of different tetracycline
resistance genotypes, tet(B) was found to be more fit than tet(A) and both were more fit than
tet(C). This finding is in agreement with how tetracycline genes appeared to be selected for in
vivo when cattle were treated with chlortetracycline in Platt et. al. 2008 as well as Kanwar et. al.
2013. Furthermore, this was also in agreement with the agar bias effect observed in the first
There are several unexplained findings from these experiments that should be further
explored. First, the strong association between tet(A) and chloramphenicol resistance has yet to
be described in literature. Given that chloramphenicol is not used in veterinary medicine, the link
between the two is particularly perplexing. Also, it was not clear why multiple tetracycline genes
maintained stable relative proportions over the decade studied, especially given that the genes
were determined to not have equal fitness values. One potential realm of explanation may lie in
environmental pressures that ultimately play a much larger role in the selection of resistance in
the long-term rather than the short-term selection provided by antimicrobial treatment.
Nevertheless, the results from both experiments have served to further current knowledge of
AMR in cattle and provide mortar for the founding of new hypotheses to continue the ever
ongoing scientific process.
References
Sarmah AK, Meyer MT, Boxall AB. 2006. A global perspective on the use, sales,
exposure pathways, occurrence, fate and effects of veterinary antibiotics (VAs) in the
environment. Chemosphere 65:725-759.
Courtheyn D, Le Bizec B, Brambilla G, de Brabander HF, Cobbaert E, van de
Wiele M, Vercammen J, de Wasch K. 2002. Recent developments in the use and abuse
of growth promoters.
Gadberry S. 2009. Feed Additives for Beef Cattle. In University of Arkansas CES (ed.),
vol. 3012.
Swartz MN. 1989. Human Health Risks with the Subtherapeutic Use of Penicillin Or
Tetracyclines in Animal Feed. National Academies.
Thorsteinsdottir TR, Haraldsson G, Fridriksdottir V, Kristinsson KG, Gunnarsson
E. 2010. Broiler Chickens as Source of Human Fluoroquinolone-Resistant Escherichia
coli, Iceland. Emerg Infect Dis 16:133-135.
Chopra I, Roberts M. 2001. Tetracycline Antibiotics: Mode of Action, Applications,
Molecular Biology, and Epidemiology of Bacterial Resistance. Microbiol Mol Biol Rev
65:232-260.
Mendez B, Tachibana C, Levy SB. 1980. Heterogeneity of tetracycline resistance
determinants. Plasmid 3:99-108.
Roberts MC, Schwarz S. 2009. Tetracycline and Chloramphenicol Resistance
Mechanisms.183-193.
Connell SR, Tracz DM, Nierhaus KH, Taylor DE. 2003. Ribosomal Protection
Proteins and Their Mechanism of Tetracycline Resistance. Antimicrobial Agents and
Chemotherapy 47:3675-3681.
Speer BS, Bedzyk L, Salyers AA. 1991. Evidence that a novel tetracycline resistance
gene found on two Bacteroides transposons encodes an NADP-requiring oxidoreductase.
J Bacteriol 173:176-183.
Harvey R, Funk J, Wittum TE, Hoet AE. 2009. A metagenomic approach for
determining prevalence of tetracycline resistance genes in the fecal flora of
conventionally raised feedlot steers and feedlot steers raised without antimicrobials. Am J
Vet Res 70:198-202.
Chee-Sanford JC, Aminov RI, Krapac IJ, Garrigues-Jeanjean N, Mackie RI. 2001.
Occurrence and diversity of tetracycline resistance genes in lagoons and groundwater
underlying two swine production facilities. Appl Environ Microbiol 67:1494-1502.
Roberts MC. 2005. Update on acquired tetracycline resistance genes. FEMS Microbiol
Lett 245:195-203.
Salyers AA, Shoemaker NB, Stevens AM, Li LY. 1995. Conjugative transposons: an
unusual and diverse set of integrated gene transfer elements. Microbiol Rev 59:579-590.
Jones CS, Osborne DJ, Stanley J. 1992. Enterobacterial tetracycline resistance in
relation to plasmid incompatibility. Mol Cell Probes 6:313-317.
Symposium CF. 2008. Antibiotic Resistance: Origins, Evolution, Selection and Spread,
No. 207.
Hornish RE, Kotarski SF. 2002. Cephalosporins in veterinary medicine - ceftiofur use
in food animals. Curr Top Med Chem 2:717-731.
Yancey RJ, Jr., Kinney ML, Roberts BJ, Goodenough KR, Hamel JC, Ford CW.
1987. Ceftiofur sodium, a broad-spectrum cephalosporin: evaluation in vitro and in vivo
in mice. Am J Vet Res 48:1050-1053.
Perez-Llarena FJ, Bou G. 2009. Beta-lactamase inhibitors: the story so far. Curr Med
Chem 16:3740-3765.
Thomson KS. 2010. Extended-Spectrum-β-Lactamase, AmpC, and Carbapenemase
Issues.
Hall BG, Barlow M. 2005. Revised Ambler classification of {beta}-lactamases, p. 1050-
1051, J Antimicrob Chemother, vol. 55, England.
Yang Y, Rasmussen BA, Shlaes DM. 1999. Class A beta-lactamases--enzyme-inhibitor
interactions and resistance. Pharmacol Ther 83:141-151.
Bush K. 2013. Proliferation and significance of clinically relevant beta-lactamases. Ann
N Y Acad Sci 1277:84-90.
Bushnell G, Mitrani-Gold F, Mundy LM. 2013. Emergence of New Delhi metallo-
beta-lactamase type 1-producing enterobacteriaceae and non-enterobacteriaceae: global
case detection and bacterial surveillance. Int J Infect Dis 17:e325-333.
Jacoby GA. 2009. AmpC beta-lactamases. Clin Microbiol Rev 22:161-182, Table of
Contents.
Arlet G, Barrett TJ, Butaye P, Cloeckaert A, Mulvey MR, White DG. 2006.
Salmonella resistant to extended-spectrum cephalosporins: prevalence and epidemiology.
Microbes Infect 8:1945-1954.
Walther-Rasmussen J, Hoiby N. 2006. OXA-type carbapenemases. J Antimicrob
Chemother 57:373-383.
Canton R, Akova M, Carmeli Y, Giske CG, Glupczynski Y, Gniadkowski M,
Livermore DM, Miriagou V, Naas T, Rossolini GM, Samuelsen O, Seifert H,
Woodford N, Nordmann P. 2012. Rapid evolution and spread of carbapenemases
among Enterobacteriaceae in Europe. Clin Microbiol Infect 18:413-431.
Opazo A, Dominguez M, Bello H, Amyes SG, Gonzalez-Rocha G. 2012. OXA-type
carbapenemases in Acinetobacter baumannii in South America. J Infect Dev Ctries
6:311-316.
Pitout JD. 2013. Enterobacteriaceae that produce extended-spectrum beta-lactamases
and AmpC beta-lactamases in the community: the tip of the iceberg? Curr Pharm Des
19:257-263.
Mathew AG, Cissell R, Liamthong S. 2007. Antibiotic resistance in bacteria associated
with food animals: a United States perspective of livestock production. Foodborne Pathog
Dis 4:115-133.
System NARM. 2011. NARMS retail meat annual report (Online).
Sayah RS, Kaneene JB, Johnson Y, Miller R. 2005. Patterns of antimicrobial
resistance observed in Escherichia coli isolates obtained from domestic- and wild-animal
fecal samples, human septage, and surface water. Appl Environ Microbiol 71:1394-1404.
Alexander TW, Yanke LJ, Topp E, Olson ME, Read RR, Morck DW, McAllister
TA. 2008. Effect of Subtherapeutic Administration of Antibiotics on the Prevalence of
Antibiotic-Resistant Escherichia coli Bacteria in Feedlot Cattle▿. Appl Environ Microbiol
74:4405-4416.
Lowrance TC, Loneragan GH, Kunze DJ, Platt TM, Ives SE, Scott HM, Norby B,
Echeverry A, Brashears MM. 2007. Changes in antimicrobial susceptibility in a
population of Escherichia coli isolated from feedlot cattle administered ceftiofur
crystalline-free acid. Am J Vet Res 68:501-507.
Singer RS, Patterson SK, Wallace RL. 2008. Effects of therapeutic ceftiofur
administration to dairy cattle on Escherichia coli dynamics in the intestinal tract. Appl
Environ Microbiol 74:6956-6962.
Platt TM, Loneragan GH, Scott HM, Norby B, Thomson DU, Brown MS, Ives SE,
Brashears MM. 2008. Antimicrobial susceptibility of enteric bacteria recovered from
feedlot cattle administered chlortetracycline in feed. Am J Vet Res 69:988-996.
Karami N, Nowrouzian F, Adlerberth I, Wold AE. 2006. Tetracycline resistance in
Escherichia coli and persistence in the infantile colonic microbiota. Antimicrob Agents
Chemother 50:156-161.
Alexander TW, Reuter T, Sharma R, Yanke LJ, Topp E, McAllister TA. 2009.
Longitudinal characterization of resistant Escherichia coli in fecal deposits from cattle
fed subtherapeutic levels of antimicrobials. Appl Environ Microbiol 75:7125-7134.
Canada Go. 2008. Canadian Integrated Program for Antimicrobial Resistance
Surveillance (CIPARS).
Carattoli A. 2008. Animal reservoirs for extended spectrum beta-lactamase producers.
Clin Microbiol Infect 14 Suppl 1:117-123.
Canton R, Novais A, Valverde A, Machado E, Peixe L, Baquero F, Coque TM. 2008.
Prevalence and spread of extended-spectrum beta-lactamase-producing
Enterobacteriaceae in Europe. Clin Microbiol Infect 14 Suppl 1:144-153.
Wieler LH, Ewers C, Guenther S, Walther B, Lubke-Becker A. 2011. Methicillin-
resistant staphylococci (MRS) and extended-spectrum beta-lactamases (ESBL)-producing
Enterobacteriaceae in companion animals: nosocomial infections as one reason for the
rising prevalence of these potential zoonotic pathogens in clinical samples. Int J Med
Microbiol 301:635-641.
Winters HA, Parbhoo RK, Schafer JJ, Goff DA. 2011. Extended-spectrum beta-
lactamase-producing bacterial infections in adult solid organ transplant recipients. Ann
Pharmacother 45:309-316.
Lu SY, Zhang YL, Geng SN, Li TY, Ye ZM, Zhang DS, Zou F, Zhou HW. 2010.
High diversity of extended-spectrum beta-lactamase-producing bacteria in an urban river
sediment habitat. Appl Environ Microbiol 76:5972-5976.
Clemente L, Manageiro V, Ferreira E, Jones-Dias D, Correia I, Themudo P,
Albuquerque T, Canica M. 2013. Occurrence of extended-spectrum beta-lactamases
among isolates of Salmonella enterica subsp. enterica from food-producing animals and
food products, in Portugal. Int J Food Microbiol 167:221-228.
Geser N, Stephan R, Hachler H. 2012. Occurrence and characteristics of extended-
spectrum beta-lactamase (ESBL) producing Enterobacteriaceae in food producing
animals, minced meat and raw milk. BMC Vet Res 8:21.
Geser N, Stephan R, Kuhnert P, Zbinden R, Kaeppeli U, Cernela N, Haechler H.
2011. Fecal carriage of extended-spectrum beta-lactamase-producing Enterobacteriaceae
in swine and cattle at slaughter in Switzerland. J Food Prot 74:446-449.
Ng LK, Martin I, Alfa M, Mulvey M. 2001. Multiplex PCR for the detection of
tetracycline resistant genes. Mol Cell Probes 15:209-215.
Seargeant E. 2014. Epitools epidemiological calculators, p. Available
at:et Animal Health Services and Australian
Biosecurity Cooperative Research Centre of Emerging Infectious Disease.
Dan M, Richardson J, Miliotis MD, Koornhof HJ. 1989. Comparison of preservation
media and freezing conditions for storage of specimens of faeces. J Med Microbiol
28:151-154.
Tadesse DA, Zhao S, Tong E, Ayers S, Singh A, Bartholomew MJ, McDermott PF.
2012. Antimicrobial drug resistance in Escherichia coli from humans and food animals,
United States, 1950-2002. Emerg Infect Dis 18:741-749.
Bryan A, Shapir N, Sadowsky MJ. 2004. Frequency and distribution of tetracycline
resistance genes in genetically diverse, nonselected, and nonclinical Escherichia coli
strains isolated from diverse human and animal sources. Appl Environ Microbiol
70:2503-2507.
Chalmers G, Kozak GK, Hillyer E, Reid-Smith RJ, Boerlin P. 2010. Low minimum
inhibitory concentrations associated with the tetracycline-resistance gene tet(C) in
Escherichia coli. Can J Vet Res 74:145-148.
Schmitt H, Stoob K, Hamscher G, Smit E, Seinen W. 2006. Tetracyclines and
tetracycline resistance in agricultural soils: microcosm and field studies. Microb Ecol
51:267-276.
Volkova VV, Lanzas C, Lu Z, Grohn YT. 2012. Mathematical model of plasmid-
mediated resistance to ceftiofur in commensal enteric Escherichia coli of cattle. PLoS
One 7:e36738.
Hund-Rinke K, Ecology FIfMBaA, [email protected], Simon M,
Ecology FIfMBaA, Lukow T, Ecology FIfMBaA. 2014. Effects of tetracycline on the
soil microflora: function, diversity, resistance. Journal of Soils and Sediments 4:11-16.
Bischoff KM, White DG, Hume ME, Poole TL, Nisbet DJ. 2005. The chloramphenicol
resistance gene cmlA is disseminated on transferable plasmids that confer multiple-drug
resistance in swine Escherichia coli. FEMS Microbiol Lett 243:285-291.
Davies JE. 1997. Origins, acquisition and dissemination of antibiotic resistance
determinants. Ciba Found Symp 207:15-27; discussion 27-35.
Andersson DI. 2003. Persistence of antibiotic resistant bacteria. Curr Opin Microbiol
6:452-456.
Chaslus-Dancla E, Gerbaud G, Lagorce M, Lafont JP, Courvalin P. 1987.
Persistence of an antibiotic resistance plasmid in intestinal Escherichia coli of chickens in
the absence of selective pressure. Antimicrob Agents Chemother 31:784-788.
Nguyen TN, Phan QG, Duong LP, Bertrand KP, Lenski RE. 1989. Effects of carriage
and expression of the Tn10 tetracycline-resistance operon on the fitness of Escherichia
coli K12. Mol Biol Evol 6:213-225.
Kanwar N, Scott HM, Norby B, Loneragan GH, Vinasco J, McGowan M, Cottell
JL, Chengappa MM, Bai J, Boerlin P. 2013. Effects of ceftiofur and chlortetracycline
on antimicrobial susceptibility and on tet(A), tet(B), and blaCMY-2 genes among E. coli
isolated from cattle, p. 50.
Lenski RE. 1998. Bacterial evolution and the cost of antibiotic resistance. Int Microbiol
1:265-270.
Srivastava A, Degen D, Ebright YW, Ebright RH. 2012. Frequency, spectrum, and
nonzero fitness costs of resistance to myxopyronin in Staphylococcus aureus. Antimicrob
Agents Chemother 56:6250-6255.
Brandis G, Hughes D. 2013. Genetic characterization of compensatory evolution in
strains carrying rpoB Ser531Leu, the rifampicin resistance mutation most frequently
found in clinical isolates. J Antimicrob Chemother 68:2493-2497.
Francois K, Devlieghere F, Standaert AR, Geeraerd AH, Cools I, Van Impe JF,
Debevere J. 2005. Environmental factors influencing the relationship between optical
density and cell count for Listeria monocytogenes. J Appl Microbiol 99:1503-1515.
Pope CF, McHugh TD, Gillespie SH. 2010. Methods to determine fitness in bacteria.
Methods Mol Biol 642:113-121.
Kompala DS, Ramkrishna D, Tsao GT. 1984. Cybernetic modeling of microbial
growth on multiple substrates. Biotechnol Bioeng 26:1272-1281.
Zwietering MH, Jongenburger I, Rombouts FM, van 't Riet K. 1990. Modeling of the
bacterial growth curve. Applied and environmental microbiology 56:1875-1881.
Dalgaard P, Koutsoumanis K. 2001. Comparison of maximum specific growth rates
and lag times estimated from absorbance and viable count data by different mathematical
models. Journal of Microbiological Methods 43:183-196.
Alali WQ, Scott HM, Norby B, Gebreyes W, Loneragan GH. 2009. Quantification of
the bla(CMY-2) in feces from beef feedlot cattle administered three different doses of
ceftiofur in a longitudinal controlled field trial. Foodborne Pathog Dis 6:917-924.
Source: http://krex.k-state.edu/dspace/bitstream/handle/2097/17641/MatthewMcGowan2014.pdf;sequence=3
www.rsc.org/csr Chemical Society Reviews Artemisinin and its derivatives: a novel class of anti-malarialand anti-cancer agentsw Devdutt Chaturvedi, Abhishek Goswami, Partha Pratim Saikia, Nabin C. Barua*and Paruchuri G. Rao Received 3rd February 2009First published as an Advance Article on the web 24th August 2009DOI: 10.1039/b816679j In this tutorial review, an effort towards presentation of a comprehensive account of the recentdevelopments on various kinds of artemisinin derivatives including artemisinin dimers, trimersand tetramers has been made and their efficacy towards malaria parasites and different cancercells lines was compared with that of artemisinins, and various other anti-malarial and anti-cancerdrugs. It is expected that this review will provide first-hand information on artemisinin chemistryto organic/medicinal chemists, and pharmacologists working on anticancer and anti-malarial drugdevelopment.
PRODUCT TECHNICAL DOSSIER TRIBULUS TERRESTRIS EXTRACT 95% SAPONINS Product Code: P20046 Raw Material Full Name: Tribulus Terrestris Extract 95% Saponins Raw Material Full Botanical/Chemical/Latin/Trade Name/Synonyms: Tribulus Terrestris L This material is Food Grade Assay (by UV): Min 95.0% Saponins Ratio of Material: Approx. 10:1 Solubility in Water: 40-50% Soluble in Water Solubility in Alcohol: The Solubility of this product in 75-80% Alcohol 80% Particle Size: 100% pass through 80 Mesh Bulk Density: 40g/ml – 60g/ml Loss on Drying: Max 5% Ash: Max 5.0%


