Nutricaodeplantas.com.br

AJCS 10(2):161-168 (2016) ISSN:1835-2707
Influence of row spacing and plant population density on management of "white mould" in
soybean in southern Brazil
David de Souza Jaccoud-Filho1, Felipe Fadel Sartori1,2, Miguel Manosso-Neto1, Cláudio Maurício
Vrisman1,3, Marcelo L. da Cunha Pierre1, Ayrton Berger-Neto1, Hamilton Edemundo Túllio1, Altair
Justino1, Adriel Ferreira da Fonseca1, Sérgio Zanon2
1Universidade Estadual de Ponta Grossa (UEPG), Departamento de Fitotecnia e Fitossanidade, Grupo de
Fitopatologia Aplicada, Brasil
2Universidade Estadual de São Paulo (Esalq/USP), Departamento de Produção Vegetal, Grupo de Fisiologia
Aplicada e Sistemas de Produção, Brasil
3The Ohio State University at Wooster (OSU), Department of Plant Pathology, USA
*Corresponding author: [email protected];[email protected]
Abstract
White mould is a disease caused by the fungus Sclerotinia sclerotiorum (Lib.) de Bary and it has become a major problem for
soybean in Brazil, mainly due to the use of contaminated seeds and machinery, monoculture, and the use of susceptible species as
crop rotation. This study aimed to evaluate the influence of different row spacing and plant population densities on soybean crop in
relation to the levels of incidence and the severity of S. sclerotiorum. Field trials were carried out during 2010-2012 crop seasons.
Row spacings of 0.35, 0.45, 0.60 and 0.75 metres, and plant population densities of 150,000, 200,000, 250,000 and 300,000 plants
ha-1 were used. The incidence and severity of white mould, the yield, and the thousand grain weight were evaluated. Spacing at 0.35
metres increased yield but it caused greater incidence of the disease. A reduced number of plants in the crop rows reduced the
severity of the disease. Farmers with a history of problems with S. sclerotiorum should avoid narrow row spacings and high plant
population densities.
Keywords: Glycine max; Sclerotinia sclerotiorum; incidence; severity; yield.
Abbreviation: TWG_thousand grain weight.
Introduction
White mould (Sclerotinia sclerotiorum (Lib.) de Bary) is one
the wind and can infect plants in a range of 50-100 m from
of the most important plant diseases nowadays because it
source (Steadman, 1983). Apothecia can germinate well in
attacks several crops, including soybean. This disease, which
moist soils as well as dry soils, depending on the
is difficult to control, is aggravated by the production of
temperatures of the soil, according to results found by
resistance structures (sclerotia) inside and outside the plants,
Matheron and Porchas (2005) in laboratory tests. There are a
which return to the soil at the end of the disease cycle. The
number of factors related to the time of viability, the potential
period of viability of these sclerotia is still uncertain, but
for infection, and the spatial distribution of sclerotia in the
there have been reports of more than eight years (Adams and
soil (Clarkson et al., 2003; Sun and Yang, 2000; Wu and
Ayers, 1979). Another important fact that can complicate the
Subbarao, 2008).
management of the disease is that it has populations that are
Plant canopy management been studied because it is a good
resistant to fungicides (Gossen et al., 2001), which limits one
option for managing diseases like white mould in various
of the main ways of managing the pathogen.
crops. Soybean varieties with reduced height and lodging,
White mould causes an estimated loss of 83.2 to 229 kg.ha-
and early cycle showed a reduction of 74% in the appearance
1 for every 10% incidence of the disease in soybean, with
of Sclerotinia scletotiorum apothecia and an 88% reduction
average losses of 136 kg ha-1 (Danielson et al., 2004). Among
in incidence (McDonald et al., 2013). In Canada, crop
the environmental factors that can lead to carpogenic
management of the disease has been part of the control of
germination of sclerotia, the ambient temperature and the
white mould for over 25 years; short cycle crops (which
depth at which the sclerotia are in the ground stand out (Sun
require less heat units) are recommended for areas with a
and Yang, 2000; Wu and Subbarao, 2008). Sun & Yang
history of the disease (McDonald et al., 2013).
(2000) found that low and high light intensities may influence
The reduction of moisture in the soil surface interferes with
the optimum temperature for the germination of apothecia,
the formation of apothecia and ascospores (Saindon et al.,
and these were produced more rapidly when exposed to high
1995; Schwartz and Steadman, 1978).In crops such as beans,
light intensity treatments. The apothecia result from the
air circulation between the rows hampers the development of
carpogenic germination of the sclerotia and they are the
S. sclerotiorum because it prevents the development of
largest source of inoculum of the disease because they
moisture, reducing the levels of incidence and severity of the
produce a lot of ascospores, which are easily transported by
disease (Tu, 1988). Plant population density and growth habit
(in the case of beans) has a direct effect on the moisture
which was favourable to the disease and which was created
between the rows. Plants with an upright growth habit allow
by the denser canopy in relation to larger row spacings. The
greater air circulation and greater penetration of sunlight,
authors also mentioned that, according to Adams (1975),
when compared to semi-erect or prostrate plants, which
sclerotia on the soil surface deteriorate with alternating
results in a rapid drop in humidity. Upright cultivars have
moisture and drought in the soil, a situation that occurs with
straighter lines of plants and, depending on the row spacing,
larger row spacings because smaller row spacings retain more
plants in adjacent lines do not touch each other (Napoleão et
moisture in the soil. Severity significantly lower than that
al., 2006). A denser canopy provides ideal moisture and
found in row spacings of 0.45 metres was observed in the
temperature conditions for the development of S.
row spacings of 0.35 metres (Table 1). A different result was
sclerotiorum (Blad et al., 1978; Boland and Hall, 1988).
observed by Macena et al. (2011) in beans, where increased
The aim of the present study was to evaluate how different
row spacing led to a reduction in the severity of white mould.
row spacings and plant population densities of soybean may
Plant population density only influenced the severity of white
influence the incidence and severity of white mould.
mould during the 2011-2012 crop season. 150,000 plants.ha-1
showed significantly lower levels of severity than the other
Results and Discussion
plant population densities (Table 1). In experiments with
beans, Vieira et al. (2005) and Paula Junior et al. (2009)
In the 2010-2011 crop season, disease was only observed in
observed reductions in the severity of the disease in low plant
the experiment in the two last assessments, at the R5.4 and
population densities. Vieira et al. (2010) observed that a
R5.5 phenological stages (Fehr et al., 1971). In the 2011-
decrease in plant population density from 240,000 plants.ha-1
2012 crop season, the disease was observed from the R5.1
to 80,000 plants.ha-1 was effective in reducing white mould in
phenological stage (Fehr et al., 1971) onwards during the
beans, also increasing crop yield in areas with high pressure
experiment. Results from R5.5 phenological stage (Fehr et
of the disease. According to Heiffig et al. (2006) and Herbert
al., 1971) are showed.
and Litchfield (1982), low plant population densities have
lower rates of leaf area in the same space, which may lead to
Incidence and severity levels of white mould
increased air circulation and light penetration between the
plants and, hence, a lower severity of the disease due to
The two crops seasons showed large differences between
moisture reduction and increased temperature. Vieira et al.
each other regarding the values for the incidence and severity
(2012) observed similar results in beans, where broad row
of the disease. Unfavourable climate conditions for the
spacing and low plant population density showed to a
development of the disease (Tmax.=26 ºC; Tave.=21 ºC;
promisor spatial arrangement for manage white mould when
Tmin.=17 ºC) during the period of susceptibility of the crop
fungicide is not used.
(R1 and R2) (Fehr et al., 1971) resulted in low values for
incidence and severity in the 2010-2011 crop season, which
Yield and Thousand grain weight (TGW)
led to large variation in the data and distortion in the surface
plot (see Fig 1 and 3). For variables (incidence and severity),
There was no interaction between row spacings and plant
smaller row spacings and plant population densities presented
population densities for yield in any of the two field trials on
the highest levels, although they were lower than 1% (Fig 1
both crop seasons. All treatments showed average yields
higher than 4,000 kg.ha-1 (Fig 5 and 6). Differences were
There was no interaction between row spacing and plant
only observed between row spacings for both crop seasons.
population density for incidence and severity in the 2011-
Row spacing of 0.35 metres resulted in improved yield in
2012 crop season (table 1). Unlike the 2010-2011crop season,
both crop seasons, differing significantly from row spacings
all treatments showed incidence of the disease (Fig 2) and
of 0.60 and 0.75 metres in the first crop season and from all
averages of severity above 40% (Fig 4). Differences in
others in the second crop season (Table 1). A reduction in
incidence were only observed between the different row
row spacing resulted in increased yield in both crop seasons
spacings, where 0.45 metres and 0.75 metres differed
(Table 1). However, there was no influence of plant
significantly between each other; the 0.45 metres row spacing
population density on the yield in either of the years (Table
had the highest values and the 0.75 metres row spacing had
1). According to Knebel et al. (2006) and Rambo et al.
the lowest values. Differences in severity were observed
(2003), the factor that has the greatest impact on yield is row
between row spacings and plant population densities. For the
spacing. Nakagawa et al. (1986) did not observe an increase
former, only row spacings of 0.35 metres to 0.45 metres
in yield due to increased plant population density. The higher
differed significantly, where the first had lower level of
yield where reduced row spacings were used may have been
severity than the second (Table 1). Regarding plant
due to greater interception of solar radiation during the
population density, 150,000 plants.ha-1 differed significantly
growing season (Board and Harville, 1992; Taylor, 1980).
from all others, presenting lower severity level (Table 1).
Regarding TGW, all treatments showed weights higher
Row spacing of 0.45 metres are most commonly used in
than 160 grams in both crop seasons (Fig 7 and 8). In the
soybean in Brazil. However, this size resulted in the highest
2010-2011 crop season there was no interaction between row
incidence and severity levels of white mould during the 2011-
spacings and plant population densities. Differences were
2012 crop seasons. Significantly lower incidence than 0.45
only observed between the different row spacings, where
metres treatments was only found for row spacing of 0.75
0.75 metres presented higher weight and were significantly
metros (Table 1). This may have been related to the fact that
different from the others row spacings (Table 1). For the
larger row spacings provide increased air circulation, light
2011-2012 crop season there was interaction between the
penetration, drier soil, fewer apothecia and shorter leaf
factors; the lowest TGW was obtained for the row spacing of
wetness duration (McDonald et al., 2013), thereby resulting
0.45 metres associated with a plant population density of
in a reduction in the incidence of the disease. In soybean field
250,000 plants ha-1 (Table 1). In a similar way to yield, the
trials carried out in the USA by Grau and Radke (1984),
different row spacings also influenced the TGW values. Row
smaller row spacings led to high levels of white mould. The
spacing of 0.75 metres resulted in the largest values during
authors explained that this fact was due to the microclimate,
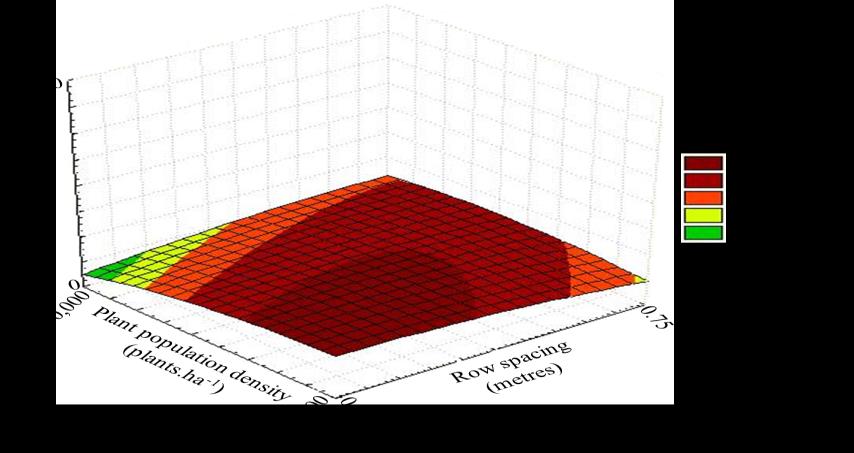
Table 1. Tukey's multiple-comparison analysis at 5% of: yield 2010/2011 (Yld 10/11), thousand grain weight 2010-2011 (TGW
10/11), incidence 2011-2012 (Inc 11/12), severity 2011-2012 (Sev 11/12), sclerotia.plants-1 2011-2012 (Scl.plt-1), yield 2011-2012
(Yld 11/12) and thousand grain weight 2011-2012 (TGW 11/12). Values of incidence and severity represent the last assessment of
the disease. Values marked with "*"represent the coefficient of variation for each analysis.
1 Values with different letters significantly different by Tukey s multicomparison analyses at a confidence level of 95%. 2 Lower case letters refer to row spacings; Upper case letters refer to plant population densities.
Fig 1. Response surface plot relating interactions between incidence of white mould of 2010-2011 crop season at R5.5 phenological
stage. Different colours in the legend mean significantly different values in the chart.
Table 2. Combinations of different row spacings and plant population densities, resulting in each of the sixteen treatments.
150,000 plants.ha-1
200,000 plants.ha-1
250,000 plants.ha-1
300,000 plants.ha-1
150,000 plants.ha-1
200,000 plants.ha-1
250,000 plants.ha-1
300,000 plants.ha-1
150,000 plants.ha-1
200,000 plants.ha-1
250,000 plants.ha-1
300,000 plants.ha-1
150,000 plants.ha-1
200,000 plants.ha-1
250,000 plants.ha-1
300,000 plants.ha-1
Fig 2. Boxplot relating incidence in 2011-2012 crop season at R5.5 phenological stage. Averages of treatments are represented by
"*".
the 2010-2011 crop season and they also resulted in one of
Materials and Methods
the highest values during the 2011-2012 crop season (Table
1). Different plant population densities did not alter the TGW
values during the 2010-2011 crop season (Table 1). However,
there was interaction between this factor and row spacing in
The experiments were carried out in the city of Arapoti, state
the second crop season. These results disagree with those
of Parana, Brazil (Alfisol CEC0-10 cm = 8.98 cmol.dm-3;
found by Vazquez et al. (2008), where the variations in the
organic matter 0-10 cm = 30.89 g.dm-3; altitude = 966 metres) in
spatial arrangement did not affect the thousand grain weight.
an area naturally infested by the disease. Prior to the
installation of the experiments, the soil was sampled at4
Sclerotia per plant production
points of 0.25 m² and 0.05 m depth (Jaccoud-Filho et al.,
2010) in the area in order to determine the number of
There was no measurement of this variable in the 2010-2011
sclerotia.m-2: 55 sclerotia.m-² was found in the 2010-2011
crop season due to low incidence and severity of the disease.
crop season and 31 sclerotia.m-² in 2011-2012 crop season.
All treatments presented production of sclerotia per plant
higher than 10 (Fig 9). There was no interaction between the
Sowing and plant material
factors or significant differences between the row spacings
and plant population densities (Table 1). Neither row
In the first year of the experiment, sowing was performed on
spacings nor plant population densities showed an influence
December 10th, 2010 and in the second year, on October 11st,
on the variable of number of sclerotia per plant (Table 1),
2011. The cultivar used in both years of the experiment was
contrary to the findings of Macena et al. (2011), where
Apollo RR® (susceptible to white mould, of indeterminate
production of sclerotia decreased as the row spacings
growth, and maturation stage of 5.5) and crop management
was performed according to the standards of the farm where
the experiments were performed, except for the application of
products whose target was the white mould.

Fig 3. Response surface plot relating interactions between severity of white mould of 2010-2011 crop season at R5.5 phenological
stage. Different colours in the legend mean significantly different values in the chart.
Fig 4. Boxplot relating severity in 2011-2012 crop season. Averages of treatments are represented by "*".
Fig 5. Boxplot relating yield in 2010-2011 crop season at R5.5 phenological stage. Averages of treatments are represented by "*".
Fig 6. Boxplot of data relating to yield in 2011-2012 crop. Averages of treatments are represented by "*".
Fig 7. Boxplot of data relating to thousand grain weight in 2010-2011 crop. Averages of treatments are represented by "*".
Treatments and traits measured
was performed. To evaluate the yield, four lines of four metres in length per plot (the same that was assessed for
The treatments consisted of four row spacings (0.35, 0.45,
incidence and severity of white mould) were harvested in
0.60 and 0.75 metres) and four plant population densities
both crop seasons. Assessments of yield and thousand grain
(150,000, 200,000, 250,000 and 300,000 plants.ha-1) (Table
weight (TGW) were made in the laboratory after correction
2). The incidence and severity assessments of the disease
of grain water content to 130g.kg-1.
started at R1 phenological stage (Fehr et al., 1971) in four rows of four metres length in each plot and were made
weekly until the crop reached the R5.5 phenological stage
Experimental design and statistical analyses:
(Fehr et al., 1971) in both crop seasons. The measurement of
the incidence values was made using the percentage of
The experimental design was a randomized complete block in
infected plants per metre, and in terms of severity,
a 4x4 factorial scheme (row spacings X plant population
percentages of 1 to 100 were awarded, in accordance with
densities), totalling sixteen treatments (table 2) with four
Juliatti et al. (2013). Thus, the incidence values presented in
replications. Each plot had twelve lines, ten metres long,
this article refer to the percentage of diseased plants per
varying the width of the plot depending on the spacing used.
metre. The severity values shown are averages of infected
Variance analyses, Shapiro-Wilk test, Bartlett test and
plants. During the evaluations in 2011-2012, five plants per
Tukey s multicomparison test was performed on all variables
plot that showed the presence of the disease were randomly
using R® software (R Core Team, 2013). The Shapiro-Wilk
marked with coloured tape to quantify the sclerotia.plant-1,
and Barltlett tests indicated the necessity for data
opening up the five plants which were marked with tape to
transformation for incidence and severity of both crop
count the resistance structures in the same day that harvest
seasons. The 2010-2011 incidence and severity could not be
Fig 8. Boxplot relating TGW in 2011-2012 crop season. Averages of treatments are represented by "*".
Fig 9. Boxplot relating sclerotia.plant-1 in 2011-2012 crop season. Averages of treatments are represented by "*".
transformed by any method. 2011-2012 incidence was
Conclusions
transformed by Box-Cox transformation (Box and Cox,
1964) and 2011-2012 severity was transformed by the
The use of row spacing of 0.75 metres was effective in
equation x=1/cos(x). As 2010-2011 incidence and severity
reducing the incidence of disease. However, such row
could not be transformed, it was decided to perform response
spacing led to a large reduction in the soybean yield. Farmers
surface analyses, which consisted of variance analyses of the
with a history of disease in their area should not adopt
regression of row spacings and plant population densities to
reduced row spacing to increase productivity, due to high risk
each variable. The response surface analysis showed a
of incidences of this disease. A reduction in plant population
uniform covariance matrix, a necessary condition according
density is a good strategy to reduce the severity of Sclerotinia
to Huynh-Feldt (H-F), to carry out univariate statistical
sclerotiorum.
analysis for an assay in randomized blocks. Functions of the
type Y = b0 + b1X1 + b2X2 + b11X12 + b22X22 + b12X1X2 were
adopted, where Y was the dependent variable, b0 to b12 were
the regression coefficients, X1 corresponded to the spacing
The authors would like to thank the National Research
and X2 corresponded to the populations of plants. The
Council (CNPq) and the Ministry of Agriculture, Livestock
estimates were made with p≤.05 using STATISTICA 10®
and Supply (MAPA) for financing this project. We would
software (Stat-Soft, 2010).
also like to thank the Fazenda Mutuca for all their support
during the development of the experiments and Sérgio Zanon,
viability of sclerotia of Sclerotinia minor and S.
crop scientist and MSc candidate at Esalq/USP, for his help
sclerotiorum. Plant Dis. 89:50- 54.
regarding the statistical analysis.
McDonald MR, Gossen BD, Kora C, Parker M, Boland G
(2013) Using crop canopy modification to manage plant
References
disease. Eur J Plant Pathol. 135:581-593.
Nakagawa J, Machado JR, Rosolem CA (1986) Efeito da
Adams PB (1975) Factors affecting survival of sclerotia of
densidade de plantas e época de semeadura na produção e
Sclerotinia sclerotiorum in soil. Plant Dis. 59:599-603.
qualidade de sementes de soja. Rev bras sementes. 8:99-
Adams PB, Ayers WA (1979) Ecology of Sclerotinia species.
112. (in Portuguese).
Phytopathology. 69 (8):896-899.
Napoleão R , Café Filho AC , Lopes CA , Nasser LCB (2006)
Blad BL, Steadman JR, Weiss A (1978) Canopy structure and
Efeito do espaçamento e da cultivar de feijoeiro sobre a
irrigation influence white mould disease and microclimate
intensidade do mofo-branco e a sanidade de sementes.
of dry edible beans. Phytopathology. 68:1431- 1437.
Summa Phytopathol. 32:63-66. (in Portuguese).
Board JE, Harville BG (1992) Explanations for greater light
Paula Junior TJ, Vieira RF, Rocha PRR, Bernardes A, Costa
interception in narrow-vs. wide-row soybean. Crop Sci.
EL, Carneiro JES, Vale FXR, Zambolim L (2009) White
mould intensity on common bean in response to plant
Box GEP, Cox DR (1964) An analysis of transformations
density, irrigation frequency, grass mulching, Trichoderma
(with discussion). J Roy Stat Soc B. 26:211–252.
spp., and fungicide. Summa Phytopathol. 35:44-48.
Boland GJ, Hall R (1988) Epidemiology of sclerotinia stem
Rambo L, Costa JA, Pires JLF, Parcianello G, Ferreira FG
rot of soybean in Ontario. Phytopathology. 78:1241-1245.
(2003) Rendimento de grãos da soja em função do arranjo
Clarkson JP, Staveley J, Phelps K, Young CS, Whipps JM
de plantas. Cienc Rural. 33:405-411. (in Portuguese).
(2003) Ascospores release and survival in Sclerotinia
R Development Core Team (2013). R: A language and
sclerotiorum. Mycol Res. 107:213–222.
environment for statistical computing. R Foundation for
Danielson GA, Nelson BD, Helms TC (2004) Effect of
Statistical Computing. Vienna, Austria.
sclerotinia stem rot on yield of soybean inoculated at
Saindon G, Huang HC, Kozub GC (1995) White mould
different growth stages. Plant Dis. 88:297-300.
avoidance and agronomic attributes of upright common
Fehr WR, Caviness CE, Burmood DT, Pennington JS (1971)
beans grown at multiple planting densities in narrow rows.
Stage of development descriptions for soybeans, Glycine
J Am Soc Hortic Sci. 120:843-847.
max (L.) Merrill. Crop Sci. 11 (6):929-931.
Schwartz HF, Steadman JR (1978) Factors affecting
Grau CR, Radke VL (1984) Effects of cultivars and cultural
sclerotium populations of, and apothecium production, by
practices on sclerotinia stem rot of soybean. Plant Dis.
Sclerotinia sclerotiorum. Phytopathology. 68:383-388.
Stat-Soft, Inc (2010). STATISTICA software. Tulsa, OK,
Gossen BD, Rimmer SR, Holley JD (2001) First report of
Sclerotinia
Steadman JR (1983) White mould - a serious yield-limiting
sclerotiorum. Plant Dis. 85:1206.
disease of bean. Plant Dis. 67:346-350.
Herbert SJ, Litchfield GV (1982) Partitioning soybean seed
Sun P, Yang XB (2000) Light, temperature, and moisture
yield components. Crop Sci. 22:1074-1079.
Sclerotinia
Heiffig LS, Câmara GMS, Marques LA, Pedroso DB,
sclerotiorum. Plant Dis. 84:1287-1293.
Piedade SMS (2006) Fechamento e índice de área foliar da
Taylor HM (1980) Soybean growth and yield as affected by
cultura da soja em diferentes arranjos espaciais. Bragantia.
row spacing and by seasonal water supply. Agron J.
65:285-295. (in Portuguese).
Jaccoud-Filho DS, Manosso Neto MO, Vrisman CM,
Tu JC (1988) The role of white mould-infected white bean
Henneberg L, Grabicoski EMG, Pierre MLC, Berger Neto
(Phaseolus vulgaris L.) seeds in the dissemination of
A, Sartori FF, Demarch VB, Rocha CH (2010) Análise,
Sclerotinia slcerotiorum (Lib.) de Bary. J Phytopat. 12140-
distribuição e quantificação do "mofo branco" em
diferentes regiões produtoras do estado do Paraná.
Vazquez GH, Carvalho NM, Borba MMZ (2008) Redução na
(Resumo). In: XXXI Reunião de Pesquisa de Soja da
população de plantas sobre a produtividade e a qualidade
Região Central do Brasil – Resumos. Londrina: Embrapa
fisiológica da semente de soja. Rev Bras Sementes. 30:01-
Soja, 2010b. 226-228. (in Portuguese).
11. (in Portuguese).
Juliatti FC, Crato FF, Juliatti FC, Couto KR, Juliatti BCM
Vieira RF, Pinto CMF, Paula Júnior TJ (2005) Fungicide,
(2010) Escala diagramática para avaliação da severidade de
row widths and plant densities affecting white mould
mofo branco em soja. Biosci J. 29:676-680.
intensity. Annu Rep Bean Improv. Coop. 48:128-129.
Knebel JL, Guimaraes VF, Andreotti M, Stangarlin JR (2006)
Vieira RF, Paula Júnior TJ, Teixeira H, Carneiro JES (2010)
Influência do espaçamento e população de plantas sobre
White mould management in common bean by increasing
doenças de final de ciclo e oídio e caracteres agronômicos
within-row distance between plants. Plant Dis. 94:361-367.
em soja. Acta Sci Agron. 28:385-392. (in Portuguese).
Vieira RF, Paula Junior TJ, Carneiro JES, Teixeira H,
Macena AMF, Canteri MG, Ferreira Junior JP (2011)
Queiroz TFN (2012) Management of white mold in type III
Espaçamento e manejo de restos culturais para o controle
common bean with plant spacing and fungicide. Trop Plant
de Sclerotinia sclerotiorum em feijoeiro. Cienc Rural.
Pathol. 37:95-101.
41:1871-1873. (in Portuguese).
Wu BM, Subbarao KV (2008) Effects of soil temperature,
Matheron ME, Porchas M (2005) Influence of soil
moisture, and burial depths on carpogenic germination of
temperature and moisture on eruptive germination and
Sclerotinia sclerotiorum and S. minor. Phytopathology. 98:1144-1152.
Source: http://www.nutricaodeplantas.com.br/lab/arquivos/publicacoes/Jaccoud%20Filho%20et%20al_2016.pdf
"CALL ATIC ON TOLL FREE NUMBER : 0800200055 FOR FREE ADVICE ON PATIENT MANGEMENT. YOU CAN ALSO BEEP OR SMS ATIC ON 0717326500 VOLUME : 8 JUNE 2011 Quarterly Newsletter of the AIDS Treatment Information Centre, Infectious Diseases Institute, Makerere University, Kampala Case Report: Skin Reaction to Tenofovir By Dr. Gyaviira Makanga (Mmed Int.Med) & Dr. Stella Zawedde - Muyanja (MBChB)
retóriCa en tomÁS de aquino Arte liberal y ciencia especulativa José María Felipe Mendoza Resumen Es sabido que Tomás de Aquino no dedicó un tratado específico al arte retórico ni a pensar especulativamente y en forma detenida qué sea la retórica. Su posición apenas figura en forma dispersa entre numerosos tratados suyos, y en varios pasajes con ocasión de aclarar lo que di-


