Thermografie-centrum.nl


This article appeared in a journal published by Elsevier. The attached
copy is furnished to the author for internal non-commercial research
and education use, including for instruction at the authors institution
and sharing with colleagues.
Other uses, including reproduction and distribution, or selling or
licensing copies, or posting to personal, institutional or third party
websites are prohibited.
In most cases authors are permitted to post their version of the
article (e.g. in Word or Tex form) to their personal website or
institutional repository. Authors requiring further information
regarding Elsevier's archiving and manuscript policies are
encouraged to visit:


Author's personal copy
Infrared Physics & Technology 52 (2009) 42–47
Contents lists available at ScienceDirect
Infrared Physics & Technology
Normalized methodology for medical infrared imaging
J.V.C. Vargas a,*, M.L. Brioschi a, F.G. Dias b, M.B. Parolin c, F.A. Mulinari-Brenner d, J.C. Ordonez e, D. Colman c
a Programa de Pós-Graduação em Engenharia Mecânica, Departamento de Engenharia Mecânica, Universidade Federal do Paraná, Curitiba, PR, 81531-980, Brazilb Programa de Pós-Graduação em Engenharia, Universidade Federal do Paraná, Curitiba, PR, 81531-980, Brazilc Transplante Hepático, Hospital de Clínicas da Universidade Federal do Paraná, Curitiba, Paraná, 80060-160, Brazild Departamento de Medicina Interna, Universidade Federal do Paraná, Curitiba, Paraná, 80060-160, Brazile Center for Advanced Power Systems and Department of Mechanical Engineering, Florida State University, Tallahassee, FL 32310, USA
A normalized procedure for medical infrared imaging is suggested, and illustrated by a leprosy and hep-
Received 7 August 2008
atitis C treatment follow-up, in order to investigate the effect of concurrent treatment which has not been
Available online 7 December 2008
reported before. A 50-year-old man with indeterminate leprosy and a 20-year history of hepatitis C wasmonitored for 587 days, starting from the day the patient received treatment for leprosy. Standard ther-
apy for hepatitis C started 30 days later. Both visual observations and normalized infrared imaging were
conducted periodically to assess the response to leprosy treatment. The primary end points were effec-
Skin thermography
tiveness of the method under different boundary conditions over the period, and rapid assessment of the
Indeterminate leprosy
response to leprosy treatment. The patient achieved sustained hepatitis C virological response 6 monthsafter the end of the treatment. The normalized infrared results demonstrate the leprosy treatment suc-cess in spite of the concurrent hepatitis C treatment, since day 87, whereas repigmentation was visuallyassessed only after day 182, and corroborated with a skin biopsy on day 390. The method detected theeffectiveness of the leprosy treatment in 87 days, whereas repigmentation started only in 182 days. Hep-atitis C and leprosy treatment did not affect each other.
Ó 2008 Elsevier B.V. All rights reserved.
consists of the average skin temperature at the affected re-gion ± the standard deviation of the measurements [13], (ii) a com-
According to Wallace [1], medical thermography was conceived
pound thermographic index (CTI) in correlation with low density
and first applied to patients by Lawson [2] in Montreal, and
lymphocytes (LDL) [14,15], (iii) a normalized thermographic index
reported on two patients with breast cancers, showing increased
(DTn), which consists of the evaluation of the TI at the affected re-
temperature over the tumor site. Williams et al. [3,4] reported on
gion minus the TI of a normal selected region [16], and (iv) a ds in-
an infrared survey of 200 cases of breast cancer, also detecting
dex (difference between temperatures of tissues of a breast tumor
increased temperature on the affected skin regions. These studies
and normal tissues) [17]. Inoue et al. [18] evaluated patients with
might be considered the starting points of medical infrared
rheumatoid arthritis after 20 min of thermal stabilization in a room
thermal imaging.
at 20 °C showing that the HDI results correlated better with clinical
In an attempt to provide objective means to analyze skin sur-
observations than the TI.
face temperature readings, Collins et al. [5–7] developed the ther-
An alternative to medical infrared imaging is the so called skin-
mographic index to quantify infrared thermal imaging. The method
contact thermography. Recently, a wearable device for skin-con-
was then utilized in several studies with different disorders [8–12].
tact thermography using silicon sensors was studied by Giansanti
All studies showed the effect of medications on the thermographic
[19], who designed a cubic–spline interpolation procedure to im-
index, which returned to basal levels with the symptoms remis-
prove the spatial resolution of the device. The methodology does
sion. In general, the results established the concept of a stable envi-
not compare to infrared imaging in terms of spatial resolution,
ronment as one of a number of essentials to reliable technique.
but it is required when subjects need to be monitored for 24 h,
Other methods for medical infrared imaging quantification have
since the infrared camera cannot be affixed to a body segment or
been proposed, such as: (i) a heat distribution index (HDI), which
to a breast for 24 h.
The previously proposed methods for medical thermography
(TI, HDI, CTI, DTn, ds, and skin-contact thermography) measure lo-cal temperatures that are significantly affected by ambient temper-
* Corresponding author. Tel.: +55 41 3361 3307; fax: +55 41 3361 3129.
ature and patient metabolism. A way to normalize temperature
E-mail address: [email protected] (J.V.C. Vargas).
1350-4495/$ - see front matter Ó 2008 Elsevier B.V. All rights reserved.
doi:10.1016/j.infrared.2008.11.003
Author's personal copy
J.V.C. Vargas et al. / Infrared Physics & Technology 52 (2009) 42–47
area of the affected region, m2
thermographic index, °C
compound thermographic index, °C
central body temperature, °C
difference between temperatures of tissues of a breast
ambient temperature, °C
tumor and normal tissues, °C
cartesian coordinates, m
heat distribution index, °C
low density lymphocytes
multidrug therapy
normalized thermographic index, °C
rifampin, ofloxacin, and minocycline single dose inde-
dimensionless temperature, Eq. (2)
terminate leprosy treatment
average dimensionless temperature, Eq. (4)
affected region domain, Fig. 1
skin surface temperature at a point, °C
readings for any specific location would therefore be of much use
in medical practice. Normalized infrared imaging could provide
means for early and accurate detection of the response to treat-
The dimensionless temperature defined by Eq. (1) is expected to
ment, mainly when other treatments are conducted simulta-
deliver normalized temperature readings, independently of mea-
neously due to co-infections. The literature reports a relatively
suring units, for any particular skin location, whatever body and
high prevalence of hepatitis C combined with leprosy in several
ambient temperatures are registered. The dimensionless tempera-
countries [20,21], but, within the knowledge of the authors, does
ture, as defined by Eq. (1), was first introduced in engineering by
not document the resulting effect of combined peginterferon
Pohlhausen [23], who used it to present the normalized tempera-
alfa-2a and ribavirin on leprosy patients undertaking concurrent
ture profile solution to the thermal boundary layer problem of lam-
multidrug therapy (MDT) and vice versa.
inar forced convection on a flat plate.
In addition to the definition of a local measuring quantity, it is
1.1. Objectives of the paper
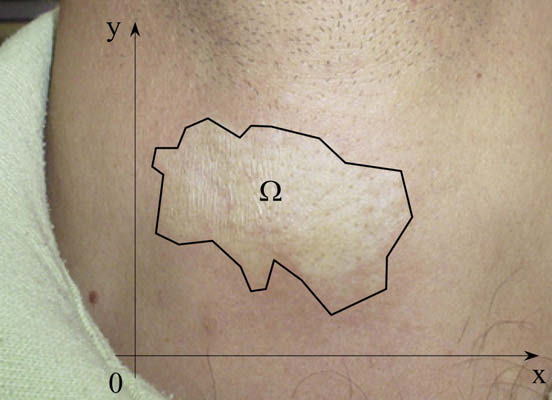
necessary to specify a representative quantity for the skin regionof interest, namely, the affected region. Fig. 1 shows a portion of
Two objectives were sought in this work: (i) to suggest a nor-
the affected skin, in which a polygonal line defines a domain X
malized methodology for general thermography interpretation,
with respect to two Cartesian axes x and y. The polygonal line
and (ii) to test the methodology in the treatment follow-up of an
should be appropriately specified to encompass the entire region
indeterminate leprosy and hepatitis C case, for early and accurate
of interest. Each region provides a dimensionless temperature field,
detection of leprosy skin lesion evolution.
which depends on x and y, i.e., h(x, y). Using the mean value theo-rem for integrals, the average dimensionless temperature for the
2. Materials and methods
entire region of interest is therefore evaluated by:
The methodological flow was divided in three steps:
� The development of the theoretical methodology for normalized
Eq. (2) defines the quantity to be obtained through the infrared
infrared imaging.
camera temperature readings in the entire selected region of inter-
� The experimental procedure for temperature data acquisition
est, and through the measured central body and ambient
and calculation of uncertainties, and
� The performance evaluation of the suggested normalized infra-
red imaging methodology with a case study of concurrent hep-
2.2. Temperature measurements
atitis C and indeterminate leprosy.
The infrared images were obtained using a SAT-S160 Infrared
camera, manufactured by SAT (Guangxhou SAT Infrared Technol-
The energy conservation principle [22] states that, for any time
interval, the variation of the energy of a system results from the ex-change of matter and energy with the exterior, and the system en-ergy variation is equal and opposite to the external world energyvariation. Considering the system as a portion of an individual skin(the region of interest), its energy variation is a result of the ex-change of matter and energy with the ambient and the rest ofthe individual's body. Therefore, since energy is directly relatedto temperature, a general methodology to interpret the tempera-ture readings obtained from an individual skin should considerthe local environmental conditions and the individual metabolism.
An appropriate dimensionless variable was identified to inter-
pret the infrared camera temperature readings. The variable is awell known dimensionless temperature in engineering heat trans-fer, and combines the locally measured temperature with the cen-tral body and ambient temperatures, as follows:
Fig. 1. The skin region of interest, namely, the affected region.
Author's personal copy
J.V.C. Vargas et al. / Infrared Physics & Technology 52 (2009) 42–47
ogy CO., LTD), with a spatial resolution of 2.2 mrad, 160 � 120 pix-
simultaneously and directly calculate the region of interest average
els, a bias limit of ±2% (temperature accuracy), and a temperature
resolution of 0.1 °C. The camera was placed at a horizontal distance
Before the beginning of the experiments, several tests were per-
of 1 m away from the region of interest on the patient's skin in or-
formed with three different ambient temperatures in an environ-
der to ensure the same view factor and dimensions for the selected
mentally controlled laboratory, i.e., T1 = 15.5, 20 and 26 °C. The
region of interest in all thermographs. Although the literature
tests consisted of, for the same individual, to perform the data
shows discrepancies for the values of human skin emissivity, it
acquisition of the temperature field on the selected region of inter-
was possible to attribute an emissivity of 0.975 to the human skin
est and body temperature. Then, the value of �
h was computed for
surface based on relatively recent work [24–26].
these three different conditions, resulting in approximately equal
The average of the measurements taken with four high preci-
h for all cases. Uncertainties were computed based on
sion thermistors of type YSI44004 (YSI Inc., USA), standard type
these three values, taken as the precision limit of the temperature
Bead I, with a maximum diameter of 2.4 mm, was utilized to esti-
measurements (two times the standard deviation [28]), since the
mate the ambient temperature close to the patient in the testing
temperature bias limit (±2% of the actually measured temperature
room, T1. A fifth and a sixth thermistor were placed under the
with the infrared camera and ±0.001 °C with the thermistors) was
two armpits of the individual being tested, and the average of
considered negligible in presence of the temperature precision lim-
the measurements was used to estimate the patient's central body
it (at least one order of magnitude smaller). In this way it was dem-
temperature, Tb ± 0.001 °C. All tests started at least ten minutes
onstrated that the dimensionless group really normalizes the
after the body temperature thermistors were placed, in order to
results, making them independent of the ambient and body tem-
read the actual body temperature of the subject.
perature conditions. For the sake of accuracy, in the present study,
The thermistors were immersed in a constant temperature bath,
the tests were all performed within the ambient temperature
and sixty-four temperature measurements were made at 20 °C,
range mentioned above, i.e., 15.5 °C 6 T1 6 26 °C.
30 °C, 40 °C, . . , 80 °C. The largest standard deviation of these mea-surements was 0.0006 °C, therefore the bias limit was considered
±0.001 °C for all the thermistors.
The experimental work involved the acquisition of temperature
A 50 year-old man was referred to an outpatient clinic for treat-
data in real time. This task was performed through the utilization
ment of a single lesion with the approximate shape of an ellipse
of a computational data acquisition system which consisted of a
(major axis: 6 cm, minor axis: 4 cm) in the cervical region, as
digital multimeter board, NI PCI-4060, a NI PCI-6703 analog output
shown in Fig. 1. Microscopy was conducted on a rectified lamellar
board, a SCXI-1127 32-channel high voltage multiplexer, and
and epidermis corneal layer, with preserved thickness, measuring
accessories, all manufactured by National Instruments, USA, which
0.3 � 0.3 � 0.3 cm, collected from the affected region. The superfi-
allows for the sequential data acquisition from 32 channels at
cial and deep dermis presented moderate lymphocyte inflamma-
interval times of 0.1 s. All the data were processed by a home made
tory infiltrate, with plasmocytes, predominantly perivascular and
Labview application (National Instruments, USA) to convert the
perineural, sometimes interstitial, with the presence of one acid-
sensors signals in readable temperatures. In this way, the temper-
fast bacillus. Therefore the patient was diagnosed with indetermi-
ature measurements originated from the six thermistors utilized in
nate leprosy. Because of his past history of an untreated chronic
the experiments were read almost simultaneously, i.e., in less than
hepatitis C and evidence of elevated liver enzymes and positive
a second. The program also generated files with the numerical data
qualitative HCV–RNA (Cobas Amplicor Hepatitis C Virus Test, ver-
measured for the patient, and allowed the calculation of the aver-
sion 2.0, Roche Molecular Systems, Branchburg, NJ, USA), a liver
age dimensionless temperature according to Eq. (2), with the re-
biopsy was performed before starting leprosy treatment. The liver
gion of interest temperature field data obtained with the infrared
specimens showed moderate necroinflammatory activity and ad-
camera and a bi-dimensional numerical integration procedure
vanced fibrosis (METAVIR stage F3). HCV genotyping was deter-
(Simpson's rule [27]). With the equipment described in this sec-
mined as 3a (Inno LipA HCV II, Innogenetics, Ghent, Belgium).
tion, it was possible to measure all required temperatures almost
The patient was then monitored for 587 days after receiving a
single dose of 600 mg of rifampin, 400 mg of ofloxacin, and100 mg of minocycline, i.e., the so called ROM treatment for inde-
terminate leprosy. Thirty days later, he started the current stan-dard therapy for hepatitis C [29,30], with 180 lg peginterferon
alfa-2a by subcutaneous injection once a week, plus 1000 mg oralribavirin daily for 24 weeks, achieving sustained virological re-
sponse 6 months after the end of the treatment, and thereafter
(negative quantitative HCV–RNA). Blood tests were utilized to fol-low the response to the hepatitis C treatment, and both visual and
normalized infrared imaging were conducted periodically (0, 15,28, 46, 59, 73, 87, 144, 182, 204, 257, 367 and 587 days) to assess
the response to leprosy treatment. On day 390, a biopsy was con-
ducted on a punch of pink–red skin tissue extracted from thescarred repigmented area, which was soft and elastic, measuring
0.3 � 0.3 � 0.3 cm, showing that the epidermis had no particulari-ties, and that in the mid and deep dermis there was disorganiza-
tion of thickened collagen groups, with the Ziehl–Neelsen
staining method showing no evidence of acid-fast bacilli. The pri-mary end points were the effectiveness of the normalized temper-
Fig. 2. The patient's response to hepatitis C treatment in time through blood tests:
ature readings under different boundary conditions over the test
—h— Fastingglucose [�102 mg/dl];
period, and the rapid assessment of the response to the leprosy
Platelet count [�1011/l];
Erythrocyte count
treatment through normalized infrared imaging, while undergoing
Hematocrit [�10];
Leucocyte count [�109/l];
Absolute neutrophil count [�109/l].
simultaneous hepatitis C treatment.
Author's personal copy
J.V.C. Vargas et al. / Infrared Physics & Technology 52 (2009) 42–47
hot and cold spots, or asymmetries; (ii) static images on occasionsseparated by substantial length of time to monitor disease progress
A recent study [31] still points out the need for an environmen-
or treatment or to detect and estimate the severity of inflamma-
tally controlled laboratory and a protocol to ensure consistency for
tion, and (iii) series of images over a period of minutes to monitor
comparing infrared images captured on different occasions (e.g.,
the recovery of skin temperature following a provocation such as
patient thermal equilibration with the ambient, absence of skin
thermal, mechanical, or chemical stress. The proposed normalized
creams). The protocol recommends the thermal equilibration of a
methodology has the potential to simplify and give more objectiv-
patient at a temperature too high for vasoconstriction to occur,
ity to infrared imaging protocols in all modes, thus improving the
but low enough not to mask the effects of inflammation or angio-
accuracy of image medical interpretation.
genesis, which adds a considerable deal of subjectivity to the exam,
The experimental results are shown in Figs. 2–4. The experi-
since no specific temperature levels are established. In time, pro-
mentally measured points were interpolated with cubic–splines,
gress has been made on producing open systems [32,33] for cap-
for a better visualization of the physical phenomena. The results
are organized in a logical sequence, i.e.: (i) regular blood tests to
thermal images relating a patient, suggesting three modes of image
assess the response to hepatitis C treatment; (ii) the physical and
treatment: (i) single static image at an instant in time to identify
infrared images comparison of the monitored leprosy skin lesion,
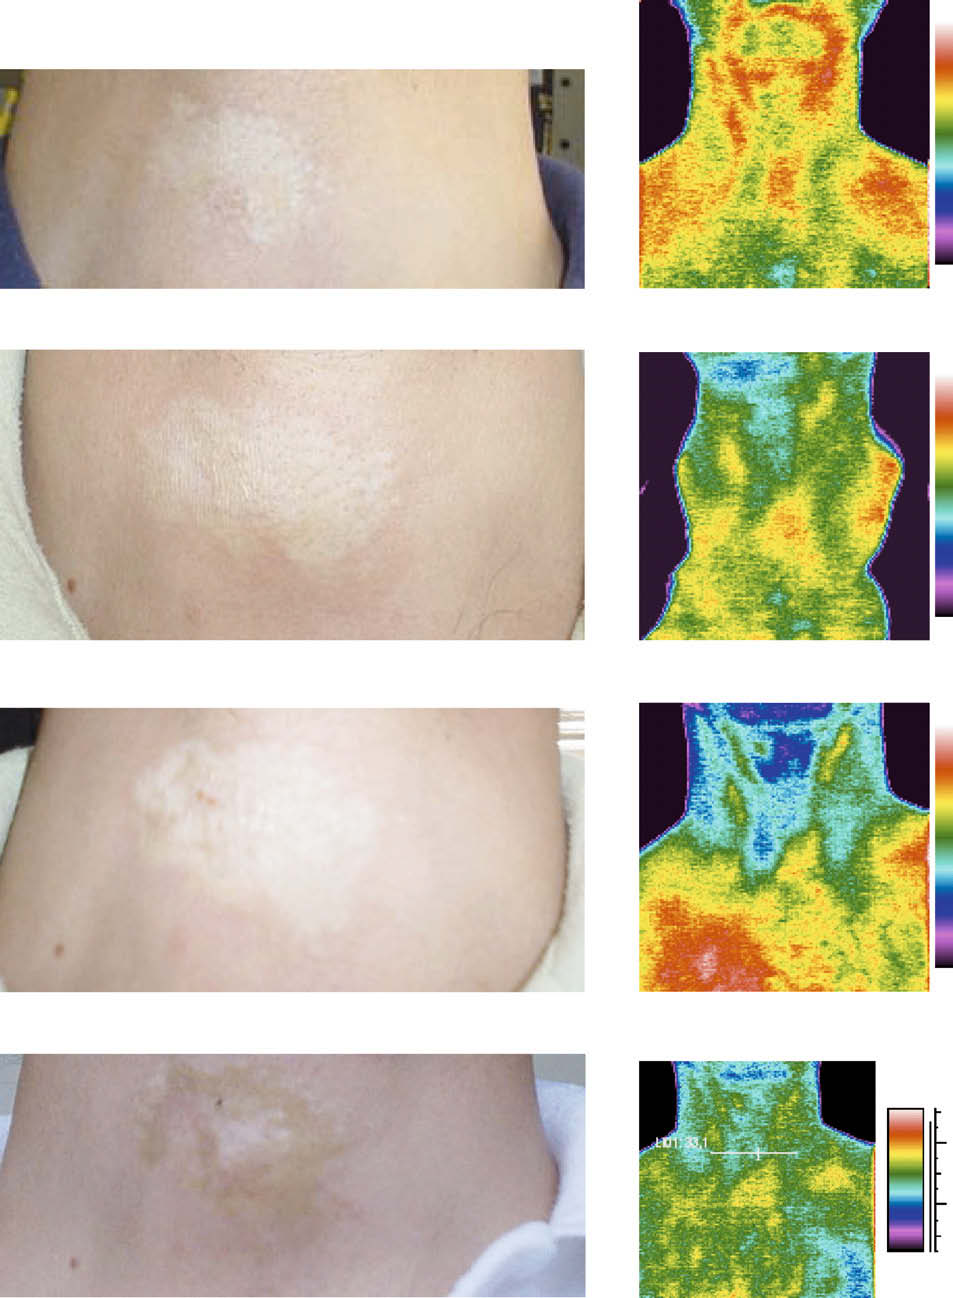
Fig. 3. The correspondence between actual photos and infrared images of the leprosy skin lesion captured on different occasions during treatment follow-up. From top tobottom: day 0, day 59, day 87, and day 257.
Author's personal copy
J.V.C. Vargas et al. / Infrared Physics & Technology 52 (2009) 42–47
the same value ð�h � 2%Þ on the day the image was taken, showingthat the value was indeed normalized in the range of tested ambi-ent temperatures. The procedure was repeated in different occa-sions (0, 15, 28, 46, 59, 73, 87, 144, 182, 204, 257, 367 and 587
days). The 2% uncertainty was the highest value obtained in allmeasurements, therefore it was the value used to compute the er-ror bars shown in Fig. 4, where the results are shown graphically. It
is observed clearly that after the single dose of the leprosy ROMtreatment the average dimensionless temperature started to drop,stabilizing at a lower level after day 87, approximately, and
remaining at that plateau until the end of the observation period.
The normalized infrared results therefore demonstrate the favor-able leprosy treatment outcome in spite of the concurrent hepatitisC treatment, since day 87, whereas repigmentation was visually as-
sessed only after day 182, and corroborated with a skin biopsy on
day 390. Since the hepatitis C treatment causes a significant drop
in leucocyte and absolute neutrophil count, it was not obvious
Fig. 4. The patient's average dimensionless temperature response at the skin
whether or not the leprosy treatment outcome would be affected
affected region in time.
by that. Although more concurrent leprosy and hepatitis C casesneed to be studied, in the absence of other documented cases,the single case herein studied represents a first assessment that
and (iii) the skin lesion average dimensionless temperature in
hepatitis C and indeterminate leprosy treatments did not affect
Fig. 2 presents a selection of the most representative blood tests
monitored during the hepatitis C treatment and the remaining per-iod of observation. Abnormal liver enzyme levels (AST and ALAT)
4. Discussion and conclusions
were present in the beginning of the hepatitis C treatment (day30), which dropped initially, elevated again (day 100), later show-
In this study, it was proposed and investigated the utilization of
ing a trend to normal ranges (day 180), i.e., the treatment end
an average dimensionless temperature for infrared imaging analy-
point, and indeed stabilizing at normal levels afterwards. Other
sis. For that, the methodology was theoretically presented and ap-
tests (platelet, erythrocyte, hematocrit, leucocyte, and absolute
plied to one case study of indeterminate leprosy and hepatitis C.
neutrophil) showed substantial drop during treatment, and stabi-
The bulk of the experimental results showed that normalized infra-
lizing at normal levels after the end of the treatment. Those results,
red imaging was able to detect the effectiveness of the leprosy
together with the negative quantitative HCV–RNA demonstrate the
treatment in 87 days, in spite of variable environmental conditions,
hepatitis C treatment success in spite of concurrent leprosy
whereas repigmentation started visually only in 182 days. Com-
bined peginterferon alfa-2a and ribavirin did not affect the patient
Actual photos and infrared images are shown in Fig. 3. The
response to indeterminate leprosy treatment and vice versa. How-
infrared images were obtained with the ambient temperature at
ever, for a better assessment of the effects of the leprosy and hep-
20 °C, and the central body temperature was 36.5 °C in all occa-
atitis C medications on each other, a larger sample of patients
sions to ensure consistency for comparing images captured on dif-
being treated simultaneously for both conditions should be
ferent days. Four occasions were selected to compare the direct
visual and infrared image assessments of the region of interest.
The key conclusion is that with a normalized methodology,
On day 0, i.e., when the ROM single dose was taken by the patient,
there is potential for production of analysis criteria for high resolu-
an elevated temperature distribution was observed on the skin le-
tion infrared imaging temperature readings for the diagnosis and
sion, in comparison with the cervical region around it. Since there
follow-up of skin lesions in leprosy treatment, independently of
is immunocytochemical evidence that the initial damage in leprosy
central body and local environmental temperatures, and possibly
is directed at distal, small, unmyelinated nerve fibers, peripheral
to all other skin-detectable pathologies, with no need for an envi-
autonomic dysfunction is expected, resulting in local hyperemia
ronmentally controlled laboratory and complex protocols.
and elevated skin temperature [34]. On day 15, it was seen quali-tatively that the temperature distribution on the region of interest
dropped to lower values, closer to the surrounding normal skin val-ues, but the lesion remained pale. On day 87, the infrared image
Additional research has been planned to show the effectiveness
shows even lower values than the previous ones, but no lesion
of the normalized thermography methodology for diagnosis and
repigmentation was observed. On day 257, the temperature distri-
follow-up of all forms of leprosy and possibly other skin-detectable
bution was very similar to the previous one, and repigmentation
pathologies, and to produce comprehensive dimensionless temper-
was also in progress. In sum, although a stabilized and fairly uni-
ature analysis criteria for them.
form temperature distribution was observed from day 87, the skinlesion did not show signs of repigmentation until day 182, which
Conflicts of interest statement
was the day when the skin repigmentation process was detectedin the laboratory (not shown in Fig. 3).
We declare that we have no conflict of interests.
Although Fig. 3 documented the decrease in temperature values
in the region of interest qualitatively, it would be more instructive
for clear medical interpretation if precise quantitative informationwere available. For that, the region of interest average dimension-
The authors acknowledge with gratitude the support of the Bra-
less temperature was calculated at 3 different ambient tempera-
zilian National Council of Scientific and Technological Develop-
ture levels, i.e., T
1 = 15.5,20 and 26 °C, obtaining approximately
Author's personal copy
J.V.C. Vargas et al. / Infrared Physics & Technology 52 (2009) 42–47
[18] K. Inoue, J. Nishioka, T. Kobori, Y. Nakatani, S. Hukuda, The use of
thermographic index and the heat distribution index, Ryumachi 30 (5)
[1] J.D. Wallace, C.M. Cade, Clinical Thermography, CRC, Cleveland, OH, 1975.
(1990) 356–361.
[2] R.N. Lawson, Implications of surface temperatures in the diagnosis of breast
[19] D. Giansanti, Improving spatial resolution in skin-contact thermography:
cancer, Can. Med. Assoc. J. 75 (1956) 309–315.
comparison between a spline based and linear interpolation, Med. Eng. Phys.
[3] K.L. Williams, F.L. Williams, R.S. Handley, Infrared radiation thermometry in
30 (2008) 733–738.
clinical practice, Lancet 2 (OCT29) (1960) 958–959.
[20] H. Rosa, R. Martins, B. Vanderborght, Short report: association between leprosy
[4] K.L. Williams, R.S. Handley, F.L. Williams, F. Infrared thermometry in the
and hepatitis C infection: a survey in a region of central Brazil, Am. J. Trop.
diagnosis of breast disease, Lancet 2 (721) (1961) 1378–1379.
Med. Hyg. 55 (1) (1996) 22–23.
[5] A.J. Collins, E.F.J. Ring, J.A. Cosh, P.A. Bacon, Quantitation of thermography in
[21] A.C.M. Braga, I.J.M. Reason, E.C.P. Maluf, E.R. Vieira, Leprosy and confinement
arthritis using multi-isothermal analysis. I. The thermographic index, Ann.
due to leprosy show high association with hepatitis C in southern Brazil, Acta
Rheum. Dis. 33 (2) (1974) 113–115.
Tropica 97 (2006) 88–93.
[6] E.F.J. Ring, A.J. Collins, P.A. Bacon, J.A. Cosh, Quantitation of thermography in
[22] I. Prigogine, D. Kondepudi, Thermodynamique, Éditions Odile Jacob, 1999. ch.
arthritis using multi-isothermal analysis. II. Effect of nonsteroidal anti-
inflammatory therapy on the thermographic index, Ann. Rheum. Dis. 33 (4)
(1974) 353–356.
flüssigkeiten mit kleiner reibung und kleiner wärmeleitung, Z. Angew Math.
[7] A.J. Collins, Anti-inflammatory drug assessment by the thermographic index,
Mech. 1 (1921) 115–121.
Acta Thermographica 1 (2) (1976) 73–79.
[24] J. Steketee, Spectral emissivity of skin and pericardium, Phys. Med. Biol. 18 (5)
[8] E.F.J. Ring, Thermographic evaluation of calcitonin therapy in Paget's disease of
(1973) 686–694.
the tibia, Acta Thermographica 1 (2) (1976) 67–72.
[25] T. Togawa, Non-contact skin emissivity: measurement from reflectance using
[9] E.F.J. Ring, Computerised thermography for osteo-articular diseases, Acta
step change in ambient radiation temperature, Clin. Phys. Physiol. Meas 10 (1)
Thermographica 1 (3) (1976) 166–172.
(1989) 39–48.
[10] E.F.J. Ring, P.A. Bacon, Quantitative thermographic assessment of inositol
[26] B.F. Jones, A re-appraisal of the use of infrared thermal image analysis in
nicotinate therapy in Raynaud's phenomena, J. Int. Med. Res. 5 (4) (1977) 217–
medicine, IEEE Trans. Med. Imaging 17 (6) (1998) 1019–1027.
[27] D. Kincaid, Cheney, Numerical Analysis Mathematics of Scientific Computing,
Springer, Berlin, 1991.
corticosteroid injection in rheumatoid arthritis, Ann. Rheum. Dis. 40 (2)
[28] Editorial. Journal of heat transfer policy on reporting uncertainties in
(1981) 132–135.
experimental measurements and results, ASME J. Heat Transfer 115 (1993)
[12] S. Zieniuk, B. Stawarz, K. Zieniuk, Infra-red thermography testicular studies of
patients with short spermatic cords and quality of sperm morphology,
[29] D.B. Strader, T. Wright, D.L. Thomas, L.B. Seef, Diagnosis, management and
Ginekol. Pol. 69 (6) (1998) 551–554.
treatment of hepatitis C, Hepatology 39 (4) (2004) 1147–1171.
[13] R.S. Salisbury, G. Parr, M. De Silva, B.L. Hazleman, D.P. Page-Thomas, Heat
[30] J.L. Dienstag, J.G. McHutchison, American gastroenterological association
distribution over normal and abnormal joints: thermal pattern and
technical review on the management of hepatitis C, Gastroenterology 130
quantification, Ann. Rheum. Dis. 42 (5) (1983) 494–499.
(1) (2006) 231–264.
[14] G.M. Papadimitriou, P.A. Bacon, N.D. Hall, Circulating activated lymphocytes in
[31] B.F. Jones, P. Plassmann, Digital infrared thermal imaging of human skin, IEEE
rheumatoid arthritis: a marker of synovial inflammation, J. Rheumatol. 9 (2)
Eng. Med. Biol. 21 (6) (2002) 41–48.
(1982) 217–223.
[32] P. Plassmann, E.F.J. Ring, An open system for the acquisition and evaluation of
[15] G.J. Alexander, P.A. Bacon, F. Cavalcanti, D.R. Blake, N.D. Hall, Low density
medical thermological images, Eur. J. Thermol. 7 (4) (1997) 216–220.
lymphocytes: their relationship to disease activity and to antirheumatic
[33] E.F.J. Ring, The historical development of temperature measurement in
therapy, Br. J. Rheumatol. 23 (1) (1984) 6–14.
medicine, Infrared Phys. Technol. 49 (2007) 297–301.
[16] H. Warashina, Y. Hasegawa, H. Tsuchiya, S. Kitamura, K. Yamauchi, Y. Tori, M.
[34] A.F. Hoeksma, W.R. Faber, Assessment of skin temperature by palpation in
Kawasaki, S. Sakano, Clinical, radiographic, and thermographic assessment of
leprosy patients: interobserver reliability and correlation with infrared
osteoarthritis in the knee joints, Ann. Rheum. Dis. 61 (9) (2002) 852–854.
thermometry, Int. J. Lepr. Other Mycobact. Dis. 68 (1) (2000) 65–67.
[17] T. Yahara, T. Koga, S. Yoshida, S. Nakagawa, H. Deguchi, K. Shirouzu,
Relationship between microvessel density and thermographic hot areas inbreast cancer, Surg. Today 33 (4) (2003) 243–248.
Source: http://www.thermografie-centrum.nl/forms/m_infrared_physics_and_technology.pdf
Final Report: The Recovery Partnership Review of Alcohol Treatment Services Mike Ward, Mark Holmes, Lauren Booker Executive summary 2. Four key findings 3. The current state of the alcohol treatment system 4. Other parts of the care pathway 5. The impact of the recovery agenda, peer support, and mutual aid 6. The commissioning process 7. The role of non-specialist services
LE TOUR DES ANNAPURNAS LE TOUR DES ANNAPURNAS Népal - NP Considéré comme l'un des plus beaux treks du monde, ce voyage n'est pas devenu célèbre par hasard. Des raisons objectives, comme l'exceptionnelle variété des paysages rencontrés, ont largement contribué à sa renommée. Lors de cette découverte pédestre d'une ampleur himalayenne, vos pas vous mènent en quelques jours des bananiers aux neiges éternelles, après la traversée de rizières, de forêts de pins ou de rhododendrons, de déserts de roche et de sable. De 900 à 5 400 mètres, un monde de cultures variées défile devant vos yeux émerveillés : villages gurungs ou thakalis éparpillés dans les champs en terrasses, petits villages tibétains serrés autour de leur monastère… Un somptueux périple dans le pays des rizières, hindouiste, et dans les hautes vallées d'influence bouddhiste et tibétaine très marquée. Ces dix jours de marche sont agrémentés par la grâce et la gentillesse des Népalais, toujours chaleureux. Le voyage se termine à Jomosom, en haut des gorges de la Kali Gandaki. Un vol somptueux nous attend entre les massifs du Dhaulagiri et des Annapurnas.


