Pc069609 1.20
This article is a Plant Cell Advance Online Publication. The date of its first appearance online is the official date of publication. The article has beenedited and the authors have corrected proofs, but minor changes could be made before the final version is published. Posting this version onlinereduces the time to publication by several weeks.
The Arabidopsis Chaperone J3 Regulates the Plasma
Membrane H+-ATPase through Interaction with thePKS5 Kinase C W
Yongqing Yang,a,b,c,1 Yunxia Qin,d,1 Changgen Xie,a,b,1 Feiyi Zhao,e,1 Jinfeng Zhao,b Dafa Liu,d Shouyi Chen,eAnja T. Fuglsang,f Michael G. Palmgren,f Karen S. Schumaker,g Xing Wang Deng,a and Yan Guob,c,2
a College of Life Sciences, Peking University, Beijing 100871, Chinab National Institute of Biological Sciences, Beijing 102206, Chinac State Key Laboratory of Plant Physiology and Biochemistry, College of Biological Sciences, China Agricultural University,Beijing 100094, Chinad Key Lab of Ministry of Agriculture for Biology of Rubber Tree, Rubber Research Institute, Chinese Academy of TropicalAgricultural Sciences, Danzhou, Hainan 571737, Chinae Institute of Genetics and Developmental Biology, Chinese Academy of Sciences, Beijing, 100101 Chinaf Department of Plant Biology, University of Copenhagen, DK-1871 Frederiksberg C, Denmarkg Department of Plant Sciences, University of Arizona, Tucson, Arizona 85721
The plasma membrane H+-ATPase (PM H+-ATPase) plays an important role in the regulation of ion and metabolite transportand is involved in physiological processes that include cell growth, intracellular pH, and stomatal regulation. PM H+-ATPaseactivity is controlled by many factors, including hormones, calcium, light, and environmental stresses like increased soilsalinity. We have previously shown that the Arabidopsis thaliana Salt Overly Sensitive2-Like Protein Kinase5 (PKS5)negatively regulates the PM H+-ATPase. Here, we report that a chaperone, J3 (DnaJ homolog 3; heat shock protein 40-like),activates PM H+-ATPase activity by physically interacting with and repressing PKS5 kinase activity. Plants lacking J3 arehypersensitive to salt at high external pH and exhibit decreased PM H+-ATPase activity. J3 functions upstream of PKS5 asdouble mutants generated using j3-1 and several pks5 mutant alleles with altered kinase activity have levels of PM H+-ATPase activity and responses to salt at alkaline pH similar to their corresponding pks5 mutant. Taken together, our resultsdemonstrate that regulation of PM H+-ATPase activity by J3 takes place via inactivation of the PKS5 kinase.
(Palmgren, 2001; Rober-Kleber et al., 2003; Fuglsang et al.,2007; Gevaudant et al., 2007; Merlot et al., 2007). A number of
In both plants and fungi, transport across the plasma membrane
factors, including hormones (auxin and abscisic acid [ABA]),
(PM) is energized by an electrochemical gradient of protons (H+).
calcium, blue light, and fungal elicitors, have been shown to elicit
These gradients are established by the electrogenic PM H+ pumps
changes in cellular pH through regulation of the PM H+-ATPase
(ATPases), which convert chemical energy derived from hydrolysis
(Kinoshita et al., 1995; Xing et al., 1997; Kim et al., 2001; Brault
of ATP into pH and electrical gradients across the plasma mem-
et al., 2004; Zhang et al., 2004). For example, auxin activates the
brane (Palmgren, 2001). The combined electrochemical gradient
H+-ATPase, resulting in apoplastic acidification, a process lead-
constitutes a driving force for the transport of solutes and metab-
ing to cell wall loosening and cell and organ elongation (Rober-
olites across the plasma membrane (Morsomme and Boutry, 2000).
Kleber et al., 2003). Exogenous application of ABA on leaves has
In
Arabidopsis thaliana, PM H+-ATPases are encoded by a 12-
an inhibitory effect on PM H+-ATPase activity (Roelfsema et al,
member gene family (
AHA1 to
AHA12; Palmgren, 2001). These
1998; Zhang et al., 2004), while mutations in the PM H+-ATPase
H+-ATPases play regulatory roles in signal transduction, during
AHA1 (
ost2) result in a constitutively active protein and plants
cell expansion, turgor regulation, in the regulation of intracellular
with reduced sensitivity to ABA during stomatal movement
pH, and in the response of the plant to increases in soil salinity
(Merlot et al., 2007). Evidence also exists linking PM H+-ATPaseactivity and increased salt tolerance as overexpression of an acti-
1 These authors contributed equally to this work.
vated PM H+-ATPase increased plant salt tolerance (Gevaudant
2 Address correspondence to
[email protected].
et al., 2007). This regulation appears to be due to posttransla-
The author responsible for distribution of materials integral to thefindings presented in this article in accordance with the policy described
tional modification of the protein based on the fact that PM
in the Instructions for Authors (www.plantcell.org) is: Yan Guo
H+-ATPase protein levels do not change when plants are grown
in salt (Ayala et al., 1996; Wu and Seliskar, 1998; Morsomme and
C Some figures in this article are displayed in color online but in black
Boutry, 2000).
and white in the print edition.
One well-characterized mechanism underlying regulation of
Online version contains Web-only data.
PM H+-ATPase activity involves an autoinhibitory domain in
The Plant Cell Preview, www.aspb.org ã 2010 American Society of Plant Biologists
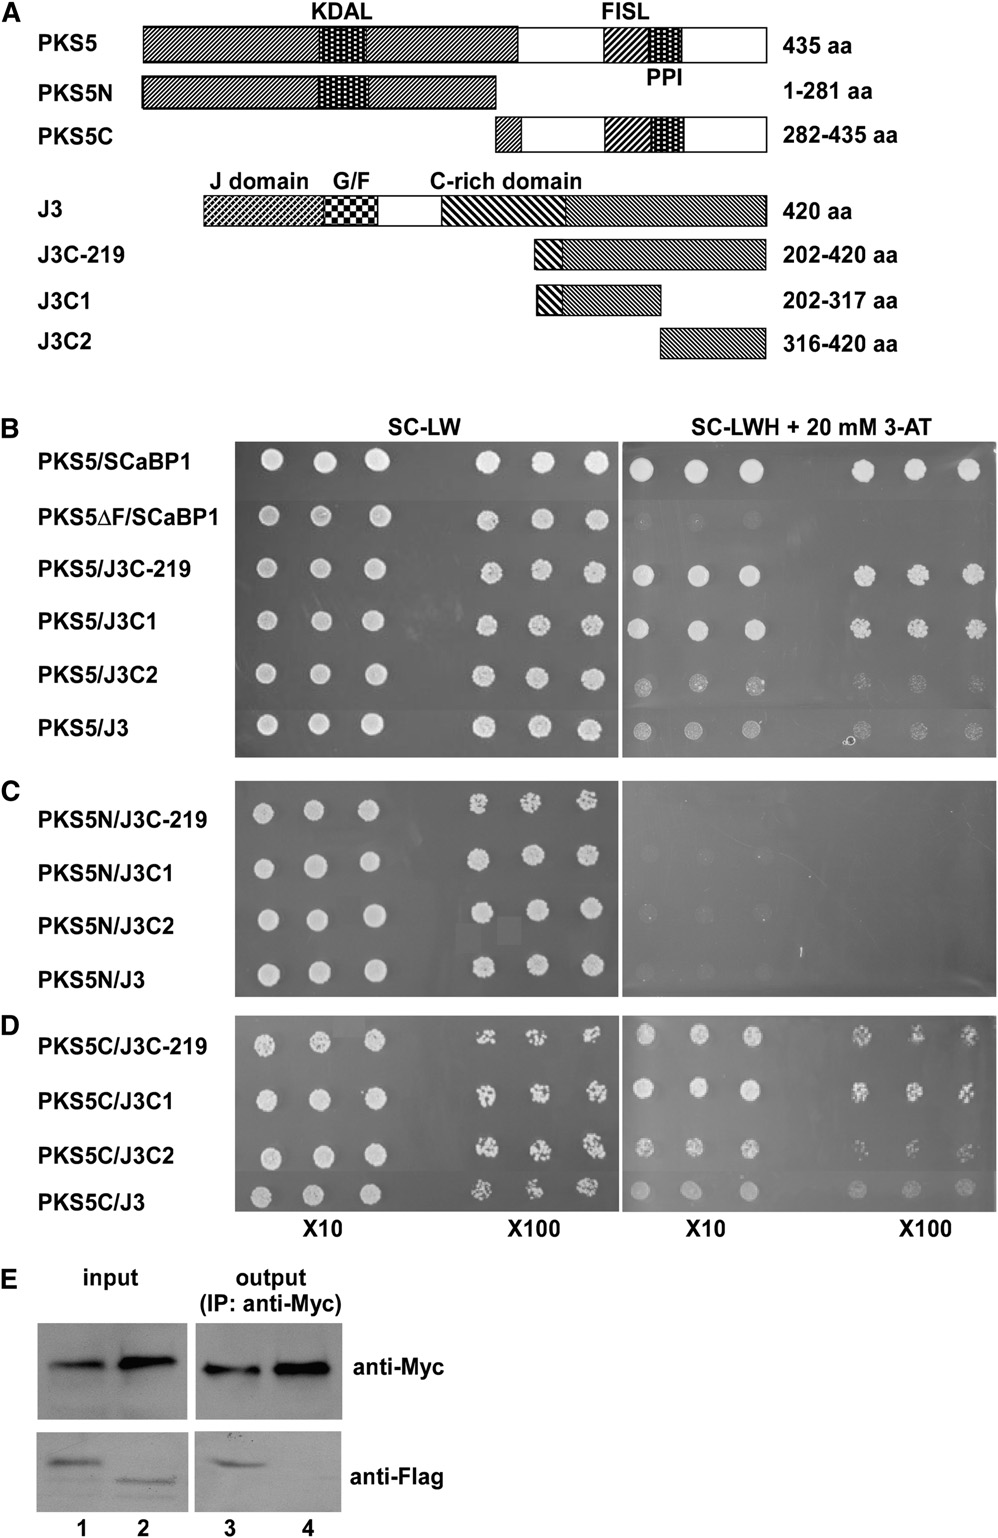
Figure 1. PKS5 Interacts with J3.
(A) Schematic diagram of the PKS5, PKS5N, PKS5C, J3, J3C-219, J3C1, and J3C2 proteins used in the yeast two-hybrid analysis. KDAL, kinaseactivation loop; FISL, SCaBP interaction domain; PPI, phosphatase interaction domain; J-domain, DnaJ domain; G/F, domain rich in Gly and Pheresidues; C-rich domain, a distal zinc finger (CxxCxGxG)4 domain.
(B) to (D) Yeast two-hybrid analysis of interactions between the full-length PKS5 protein (PKS5) or the N- (PKS5N) or C- (PKS5C) terminal portions of theprotein with J3, or J3C-219, J3C1, or J3C2. Interactions between the full-length PKS5 protein or the protein with the FISL domain deleted (PKS5DF) and
J3 Activates Plasma Membrane H+-ATPase Activity
C-terminal region of the protein (Palmgren et al., 1991). Phos-
evolution and is important for protein translation, folding, unfold-
phorylation of this C-terminal autoinhibitory domain at the pen-
ing, translocation, and degradation in a broad array of cellular
ultimate residue (Thr-947) leads to its interaction with a 14-3-3
processes (Boston et al., 1996; Waters et al., 1996; Wang et al.,
regulatory protein and activation of the H+-ATPase (Svennelid
2004). Expression of Hsps in planta is induced by high temper-
et al., 1999; Camoni et al., 2000; Gevaudant et al., 2007). The
ature and also by a wide range of other environmental stresses,
activated protein complex is likely to consist of six phosphory-
including increased soil salinity and osmotic, water, cold, and
lated PM H+-ATPase molecules assembled in a hexameric
oxidative stresses (Boston et al., 1996; Waters et al., 1996; Wang
structure together with six 14-3-3 molecules (Kanczewska
et al., 2004). In addition to their function as chaperon proteins,
et al., 2005; Ottmann et al., 2007). We recently demonstrated
DnaJs are also involved in other biological processes, including
that the PKS5 protein kinase negatively regulates the activity of
regulation of transcriptional activation by directly binding tran-
the PM H+-ATPase by directly phosphorylating the AHA2 isoform
scription factors (Ham et al., 2006), formation of endosomes
of the enzyme in its C-terminal regulatory domain at Ser-931 and
(Tamura et al., 2007), and in carotenoid accumulation (Lu et al.,
that this phosphorylation inhibits the interaction between AHA2
2006). There are 89 putative J-domain proteins predicted in
and the 14-3-3 protein (Fuglsang et al., 2007). A role for PKS5 in
Arabidopsis (Miernyk, 2001). These J-domain proteins are both
the regulation of the PM H+-ATPase was further supported by the
soluble and found in membrane compartments of all cellular
recent demonstration that Ser-938 (identical to Ser-931 in AHA2
organelles (Miernyk, 2001). J3 (Arabidopsis DnaJ homologous
in Arabidopsis) is phosphorylated in vivo in PMA2, a PM-H+-
protein3) contains all typical functional domains found in J-domain
ATPase isoform in tobacco (Nicotiana tabacum; Duby et al.,
family members (Zhou and Miernyk, 1999). J3 is expressed in
roots, stems, leaves, flower buds, flowers, and siliques, and its
Environmental stresses in plants often cause protein denatur-
expression can be induced by heat and water stress (Zhou and
ation; therefore, maintaining proteins in their functional confor-
Miernyk, 1999; Li et al., 2005).
mations and preventing protein aggregation are particularly
In this study, we identify a DnaJ-like protein, Arabidopsis J3, as
important for cell survival under stress conditions. Molecular
a positive regulator of the PM H+-ATPase. We show that J3
chaperones (heat shock proteins [Hsps]) are key components
interacts with and represses activity of the PKS5 kinase. To-
contributing to cellular homeostasis under adverse growth con-
gether with results from our genetic studies, we demonstrate that
ditions (Wang et al., 2004). DnaJ/Hsp40 was originally charac-
J3 regulates PM H+-ATPase activity through interaction with the
terized in Escherichia coli as a 41-kD heat shock protein that
PKS5 kinase.
interacts directly with DnaK and GrpE constituting a molecularchaperone machine (Georgopoulos et al., 1980; Liberek et al.,1991; Scidmore et al., 1993; Bukau and Horwich, 1998; Goffin
and Georgopoulos, 1998; Miernyk, 1999). Additionally, DnaJ canact independently as a chaperone (Laufen et al., 1999). Most
PKS5 Interacts with J3
DnaJ proteins contain a J-domain, a proximal G/F-domain, and adistal zinc finger (CxxCxGxG)4 domain, followed by less con-
To understand how PKS5 regulates the PM H+-ATPase, we
served C-terminal sequences (Caplan et al., 1993; Silver and
identified PKS5-interacting proteins using yeast two-hybrid
Way, 1993). The J domain, a 70–amino acid sequence, contains
assays. To do this, we cloned the PKS5 cDNA into the pAS2
four helices and a highly conserved tripeptide made up of His,
vector and transformed the resulting plasmid into yeast strain
Pro, and Asp (the HPD motif) in the loop region between helices II
Y190. PKS5 was then used as bait to screen an Arabidopsis
and III (Qian et al., 1996). The J domain binds to Hsp70s, and this
cDNA library (obtained from The Arabidopsis Information Re-
binding stabilizes Hsp70 interaction with substrate proteins (Qiu
source [TAIR]). Two positive clones were sequenced and found
et al., 2006). The G/F-domain, which is rich in Gly and Phe
to include 219 amino acids (J3C-219) that are identical to the C
residues and comprises a flexible linker region, helps to confer
terminus of At3g44110, which encodes a putative cochaperone
interaction specificity among DnaK, DnaJ, and target polypep-
DnaJ-like heat shock protein (J3) (Zhou and Miernyk, 1999). To
tides (Wall et al., 1995; Yan and Yan, 1999). The distal zinc finger
narrow down the interaction domain in J3, J3C-219 was divided
domain is believed to participate in protein-protein interactions
into two parts, J3C1 (amino acids 202 to 317) and J3C2 (amino
among DnaJ, DnaK, and target polypeptides (Banecki et al.,
acids 316 to 420); the structures of the peptides are shown in
1996; Szabo et al., 1996). DnaJ has been conserved throughout
Figure 1A. These fragments and the full-length J3 were cloned
Figure 1. (continued).
SCaBP1 were used as positive and negative controls, respectively. Yeast lines harboring the indicated plasmids were grown on synthetic complete (SC)medium without Leu and Trp (SC-LW, left panel) and on SC medium without Leu, Trp, and His (SC-LWH) and with 20 mM 3-amino-1,2,4-triazole (3-AT;right panel). Yeast cells were incubated until OD660 = 1 and then diluted 10- or 100-fold and used for assays.
(E) Coimmunoprecipitation of PKS5 and J3 proteins in vivo. The 35SP:63Myc-J3 plasmid was cotransformed into wild-type (Col-0) protoplasts with35SP:33FLAG-PKS5 (lanes 1 and 3) or 35SP:33FLAG-TTG1 (lanes 2 and 4). Total protein extracts were analyzed with immunoblots using anti-Myc andanti-FLAG antibodies to detect the presence of PKS5, J3, or TTG1 (input). Immunoprecipitation was performed using anti-Myc agarose conjugate, andthe products were analyzed with immunoblots using anti-FLAG antibody to detect coimmunoprecipitated FLAG-PKS5 (lane 3) or FLAG-TTG1 (lane 4).
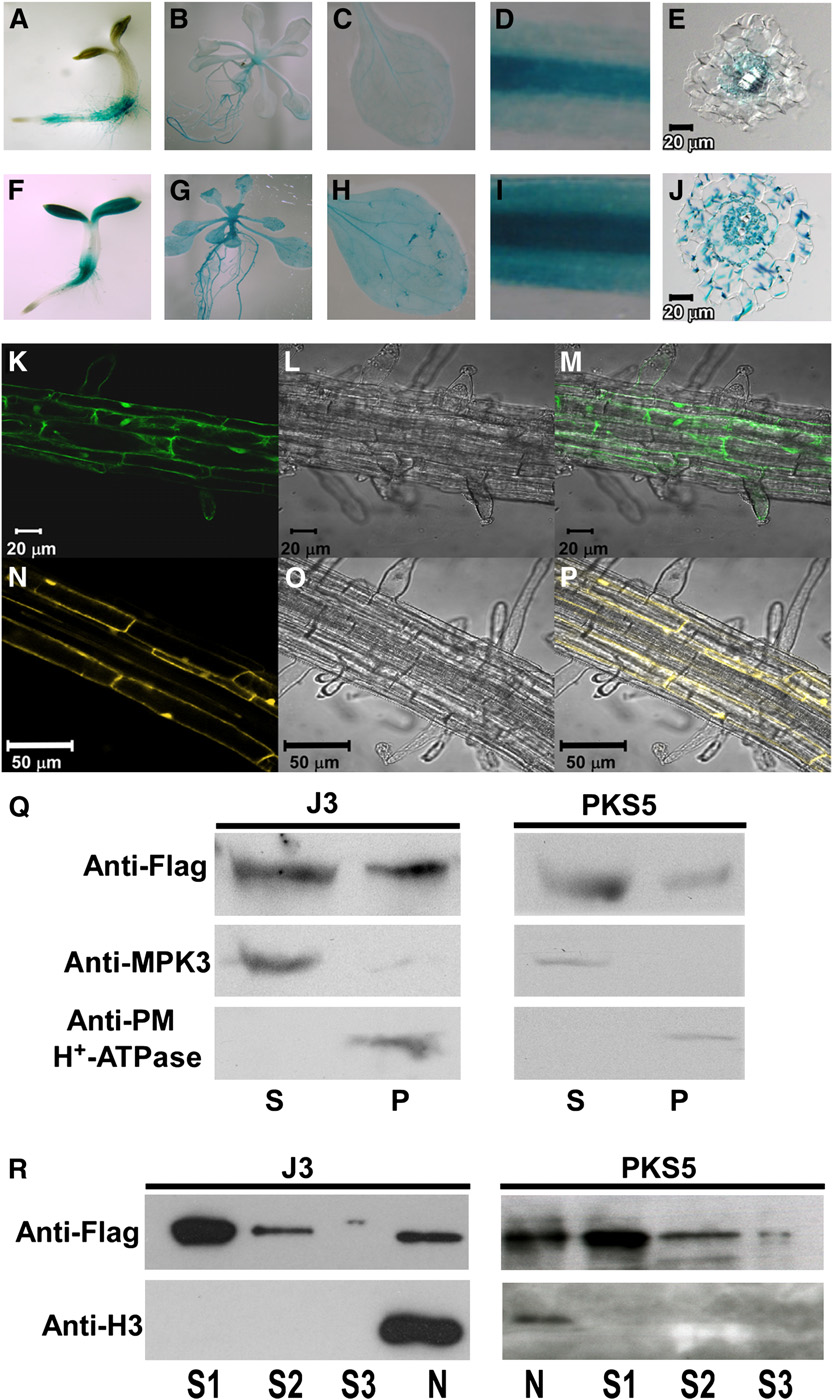
Figure 2. PKS5 and J3 Have Overlapping Tissue-Specific Expression and Subcellular Localization.
(A) to (J) Expression of J3 and PKS5 in 3-d-old seedlings ([A] and [F]), 10-d-old seedlings ([B] and [G]), rosette leaves ([C] and [H]), roots ([D] and [I]),and cross sections of roots ([E] and [J]).
(A) to (E) PKS5 promoter-GUS expression in wild-type seedlings.
(F) to (J) J3 promoter-GUS expression in wild-type seedlings.
(K) to (P) Subcellular localization of GFP-J3 ([K] to [M]) and PKS5-YFP ([N] to [P]) in the upper portion of the root. Confocal GFP images ([K] and [N]),bright-field images ([L] and [O]), and combined GFP and bright-field images ([M] and [P]).
(Q) Both of PKS5 and J3 were detected in soluble and plasma membrane–enriched fractions. Isolation of plasma membrane vesicles was by two-phasepartitioning from seedlings of j3-1 plants expressing 35SP:33flag-J3 or pks5-1 plants expressing DexP:33flag-PKS5. Equal amount of soluble (S) andplasma membrane (P) proteins were separated by SDS-PAGE followed by analysis with anti-flag, anti-MAPK3, or anti-PM H+-ATPase antibodies.
(R) Both of PKS5 and J3 were detected in nucleus. Nuclei were isolated from seedlings of j3-1 plants expressing 35SP:33flag-J3 or pks5-1 plantsexpressing DexP:33flag-PKS5. The nuclei pellet was then washed three times. Equal amount of three washing (S1-S3) and nuclei (N) proteins wereseparated by SDS-PAGE followed by analysis with anti-flag or anti-Histone H3 antibodies.
[See online article for color version of this figure.]
J3 Activates Plasma Membrane H+-ATPase Activity
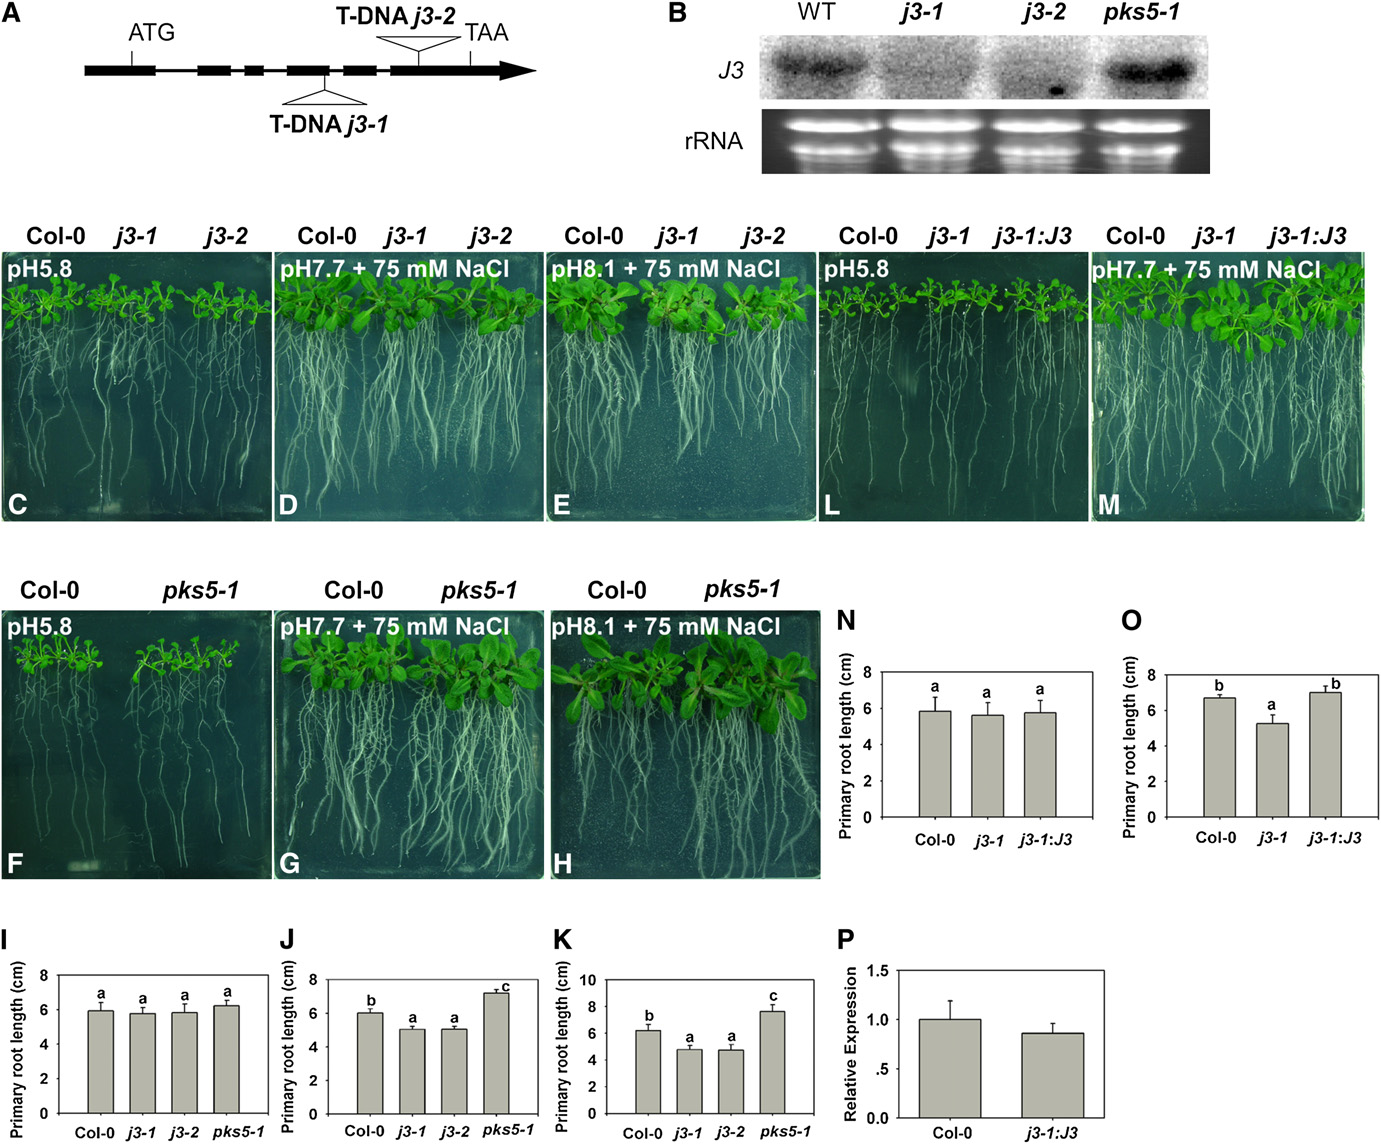
Figure 3. j3 Mutants Have Increased Sensitivity to Salt in Alkaline Conditions.
(A) Schematic diagram of the J3 gene showing the T-DNA insertion sites in the j3-1 and j3-2 mutants. The filled black boxes represent exons, while thelines between the boxes represent introns. The two T-DNA insertions are also indicated.
(B) Transcript levels of J3 are undetectable in the j3-1 and j3-2 mutants. Total RNA was isolated from 10-d-old seedlings of Col-0, j3-1, j3-2, and pks5-1mutants. RNA (15 mg) from each sample was used for RNA gel blot analysis. Ethidium bromide staining of rRNA is included as a loading control.
(C) to (O) Five-day-old Col-0, pks5-1, j3-1, j3-2, and j3-1 expressing 35SP: J3 seedlings grown on MS medium at pH 5.8 were transferred to MS mediumat pH 5.8, at pH 7.7 with 75 mM NaCl, or at pH 8.1 with 75 mM NaCl. Photographs in (C), (F), and (L) were taken 7 d after transfer; in (D), (G), and (M), 14d after transfer; in (E) and (H), 21 d after transfer.
(I) and (N) Primary root elongation of plants transferred to MS medium at pH 5.8.
(J) and (O) Primary root elongation of plants transferred to MS medium at pH 7.7 with 75 mM NaCl.
(K) Primary root elongation of plants transferred to MS medium at pH 8.1 with 75 mM NaCl.
(P) Relative expression of j3-1 expressing 35SP:J3 with J3 real-time quantitative RT-PCR.
In (I) and (N), primary root length was measured 7 d after transfer; (J) and (O), primary root length was measured 14 d after transfer; (K), primary rootlength was measured 21 d after transfer. Error bars represent SD (plant number >15). A Student's t test was used to determine statistical significance;significant differences (P # 0.05) in (I) to (K), (N), and (O) are indicated by different lowercase letters.
into the pACT2 vector, and combinations of PKS5 and J3 were
with highest expression in reproductive and root tissues (see
cotransformed into yeast. Both the J3C1 and J3C2 peptides
Supplemental Figure 1 online).
interacted with the full-length PKS5 protein and the C terminus of
To learn more about the interaction between PKS5 and J3, we
PKS5, with J3C1 showing a stronger interaction than J3C2
determined the subcellular localization of the two proteins. The
(Figure 1B). The PKS5 protein interacted weakly with J3 (Figure
green fluorescent protein (GFP) reporter was fused to both
1B). To determine the region of PKS5 that interacts with J3,
proteins at their N termini under the control of the 35S promoter,
fragments encoding the N-terminal kinase domain (PKS5N,
and the resulting plasmids were transformed into the Arabidopsis
amino acids 1 to 281) or the C-terminal regulatory domain
Col-0 genetic background. Transgenic plants in the T2 genera-
(PKS5C, amino acids 282 to 435) of PKS5 were cloned into
tion were tested for GFP localization using confocal microscopy.
pAS2, and these two plasmids were cotransformed with the
GFP-J3 was detected at the cell membrane, in the cytoplasm,
J3 plasmids into yeast. The PKS5 kinase domain (N terminus)
and in the nucleus (Figures 2K to 2M); however, no GFP-PKS5
did not interact with any portion of J3 (Figure 1C). The PKS5 C
signal was detected in >100 35SP:GFP-PKS5 transgenic lines.
terminus interacted with J3C1, which showed a stronger
We then fused yellow fluorescent protein (YFP) to the C terminus
interaction than any other J3 fragment (Figure 1D). As con-
of PKS5 under the control of a dexamethasone-inducible pro-
trols, PKS5 was shown to interact with SOS3-LIKE CALCIUM
moter (Aoyama and Chua, 1997), and the YFP signal was
BINDING PROTEIN1 (SCaBP1), and this interaction was
analyzed in transgenic plants treated with 10 mM dexametha-
abolished when the FISL domain (a domain in the PKS5
sone. As was found for GFP-J3, PKS5 localized to the cell
protein required for SCaBP binding) was deleted (PKS5DF,
membrane, in the cytoplasm, and in the nucleus (Figures 2N
To determine if this interaction exists in vivo, three FLAG tags
To further analyze the subcellular localization of PKS5 and J3
in a tandem repeat were fused to PKS5 or to the trichome-
in plant cells, we fused a 33FLAG tag at the N terminus of PKS5
associated gene TRANSPARENT TESTA GLABRA1 (TTG1) at
under the control of a dexamethasone-inducible promoter and
their N termini, and six Myc tags in a tandem repeat were fused to
33FLAG tag at the N terminus of J3 driven by the 35S promoter.
J3 at its N terminus with fusions for all three genes under the
The resulting plasmids and 35SP:GFP-J3 were transferred into
control of the 35S promoter. Combinations of 63Myc-J3 and
their corresponding mutants and the mutant phenotypes were
33FLAG-TTG1 or 63Myc-J3 and 33FLAG-PKS5 were cotrans-
rescued by the transgenes (see Supplemental Figures 2 and 3
fected into Arabidopsis leaf protoplasts. The 63Myc-J3 protein
online). We then isolated nuclei, a plasma membrane–enriched
was immunoprecipitated using anti-Myc conjugated agarose.
fraction, and a soluble fraction from the transgenic plants
After washing, immunoblots were probed with anti-FLAG anti-
expressing 35SP:33FLAG-J3 and DexP:33FLAG-PKS5 and
body. The 33FLAG-PKS5 but not 33FLAG-TTG1 protein was
analyzed the immunoblots with anti-FLAG antibody. As shown
pulled down by 63Myc-J3 (Figure 1E), suggesting that PKS5 and
in Figure 2Q and 2R, the tagged PKS5 and J3 proteins were
J3 can function in the same complex. Together with the yeast
detected in all three fractions. These results are consistent with
two-hybrid results, our data indicate that PKS5 and J3 interact in
our PKS5-YFP and GFP-J3 results (Figures 2K to 2P). Using the
same protein samples, as expected, MITOGEN-ACTIVATEDPROTEIN KINASE3, the PM H+-ATPase, and histone H3 werefound in the soluble, plasma membrane–enriched and nuclear
PKS5 and J3 Have Overlapping Tissue-Specific Expression
fractions, respectively. To further determine the purity of the phase
and Subcellular Localization
partitioned membrane fractions, anti-Arf1 (ADP-ribosylation
To determine if PKS5 and J3 colocalize in planta, we monitored
factor 1, a Golgi apparatus marker) and anti-Sar1 (secretion-
PKS5 and J3 tissue specific expression using two approaches.
associated and Ras-related protein 1, an endoplasmic reticulum
First, a 1918-bp DNA fragment upstream of the J3 translational
marker) antibodies were used to investigate the presence of
start codon was amplified and cloned into pCambia1301 tran-
endoplasmic reticulum and Golgi membranes in the plasma
scriptionally fused to b-glucuronidase (GUS) and the resulting
membrane–enriched fraction. Both proteins were at undetect-
plasmid was transformed into Columbia-0 (Col-0). GUS signals
able levels in the plasma membrane–enriched fraction. Consis-
driven by the PKS5 (Fuglsang et al., 2007) or J3 promoter are
tent with a previous study (Pimpl et al., 2000), these proteins were
shown in Figures 2A to 2E and 2F to 2J, respectively. Both J3P:
detected in total membrane and soluble fractions (see Supple-
GUS and PKS5P:GUS were expressed in the roots and leaves of
mental Figure 4 online). Together, these data demonstrate that
seedlings with stronger GUS staining in vascular tissue (Figure 2).
the gene expression and protein localization of J3 and PKS5
In cross sections of the root, PKS5P:GUS was mainly observed
overlap during Arabidopsis development.
in phloem (Figure 2E), which is consistent with previous findings(Fuglsang et al., 2007), while the J3P:GUS signal was observed in
j3 Mutants Have Increased Sensitivity to Salt in
epidermal cells, the cortex, phloem, and xylem parenchyma cells
Alkaline Conditions
(Figure 2J); this expression pattern is similar to that of AHA2P:GUS (Fuglsang et al., 2007). We also analyzed the tissue-specific
To determine if J3 and PKS5 have similar functions, we obtained
expression of PKS5 and J3 using quantitative real-time PCR.
two J3 T-DNA insertion lines from TAIR (SALK_132923 and
Total RNA was extracted from roots, stems, rosette leaves,
SALK_141625). The positions of the T-DNA insertions are shown
cauline leaves, flowers, and siliques of 40-d-old Col-0 plants.
in Figure 3A. Homozygous T-DNA lines, j3-1 and j3-2, were
Both PKS5 and J3 were constitutively expressed in all tissues
identified using T-DNA left border primers and J3 gene-specific
J3 Activates Plasma Membrane H+-ATPase Activity
primers. To determine if expression of J3 is abolished in these
were transferred to medium at pH 5.8, pH 7.7 with 75 mM NaCl,
two lines, total RNA was extracted from 10-d-old Col-0, pks5-1
or pH 8.1 with 75 mM NaCl. No significant difference in growth
(a PKS5 loss-of-function mutant; Fuglsang et al., 2007), and
was detected between Col-0 and the j3 mutants on medium at
j3-1 and j3-2 seedlings and analyzed using RNA gel blots. The
pH 5.8 (Figures 3C and 3I; see Supplemental Figure 7A online).
expression of J3 could not be detected in j3-1 and j3-2; however,
On medium at pH 7.7 with 75 mM NaCl (Figures 3D and 3J; see
it is present in Col-0 and pks5-1 (Figure 3B; see Supplemental
Supplemental Figure 7B online), root elongation in the j3 mutants
Figure 5 online). We have previously shown that PKS5 is a
was reduced compared with that of Col-0, and this reduction in
negative regulator of the PM H+-ATPase and that PKS5 loss-of-
growth was even more pronounced at pH 8.1 in the presence of
function mutants are resistant to high pH in the external medium
75 mM NaCl (Figures 3E and 3K; see Supplemental Figure 7C
(Fuglsang et al., 2007). When we monitored j3 mutant seedling
online). By contrast, when we grew Col-0 and pks5-1 seedlings
growth in response to alkaline pH, no consistent, significant
on the same media, primary root elongation in pks5-1 seedlings
difference was detected between Col-0 and mutant plants. In
was less sensitive to NaCl in alkaline conditions relative to the
nature, soil alkalinity is often associated with increased soil
growth of wild-type plants (Figures 3G, 3H, 3J, and 3K). This
salinity partly due to application of fertilizers and irrigation water
result is consistent with our previous finding that pks5-1 is more
(Richards, 1954). Alkaline conditions significantly increased the
tolerant to alkaline pH than Col-0 (Fuglsang et al., 2007). When
salt sensitivity of Arabidopsis (see Supplemental Figure 6 online).
we tested the sensitivity of the j3-1 transgenic plants expressing
To determine if the j3 mutants have increased sensitivity to
35SP:J3 to salinity in alkaline conditions, we found the mutant
salinity in alkaline conditions, 5-d-old seedlings of Col-0, j3-1,
phenotype was rescued by the transgene (Figures 3L to 3P; see
and j3-2 grown on Murashige and Skoog (MS) medium at pH 5.8
Supplemental Figures 7D and 7E online).
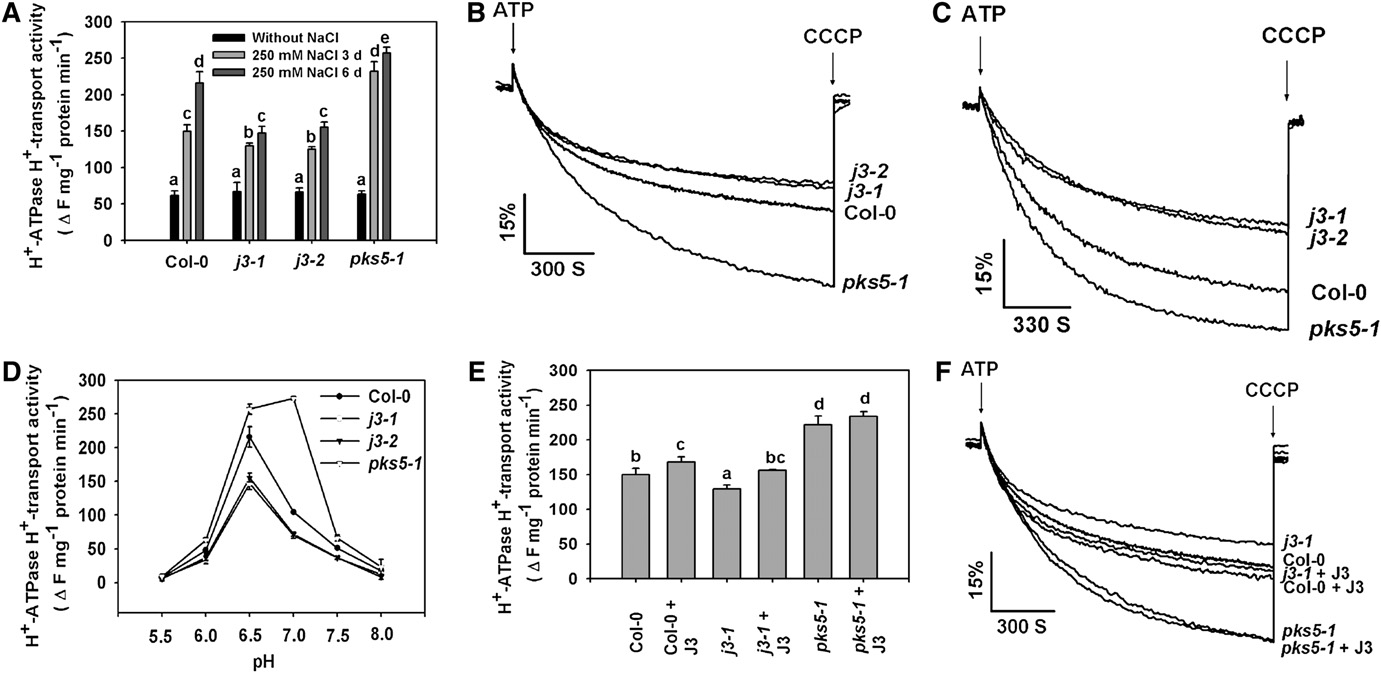
Figure 4. J3 Positively Regulates PM H+-ATPase Activity.
Plasma membrane vesicles were isolated from Col-0, pks5-1, j3-1, and j3-2 mutant plants treated with or without 250 mM NaCl for 3 or 6 d. PM H+-ATPase activity (H+-transport resulting in intravesicular acidification and pH gradient [DpH] formation) was initiated by addition of 3 mM ATP, and theDpH was collapsed by addition of 10 mM (final concentration) carbonyl cyanide m-chlorophenylhydrazone (CCCP).
(A) Comparison of PM H+-ATPase activity in vesicles isolated from Col-0, j3-1, j3-2, and pks5-1 plants treated with or without 250 mM NaCl for 3 or 6 d.
(B) and (C) PM H+-ATPase activity was measured in the vesicles isolated from Col-0, j3-1, j3-2, and pks5-1 plants treated with 250 mM NaCl for 3 d (B)or 6 d (C).
(D) PM H+-ATPase activity was measured at different pH.
(E) Comparison of PM H+-ATPase activity in the presence of 250 ng/mL recombinant J3 protein in vesicles isolated from Col-0, j3-1, and pks5-1 plants.
(F) PM H+-ATPase activity was measured in the presence of 250 ng/mL recombinant J3 protein in vesicles isolated from Col-0, j3-1, and pks5-1 plants.
Units of PM H+-ATPase activity (H+-transport) are change in fluorescence (DF) per min per mg protein.
All data represent means 6 SE of at least three replicate experiments. Each replicate was performed using independent membrane preparations. Onerepresentative experiment of three replicates is shown in (B) and (C). A Student's t test was used to determine statistical significance; significantdifferences (P # 0.05) in (A) and (E) are indicated by different lowercase letters.
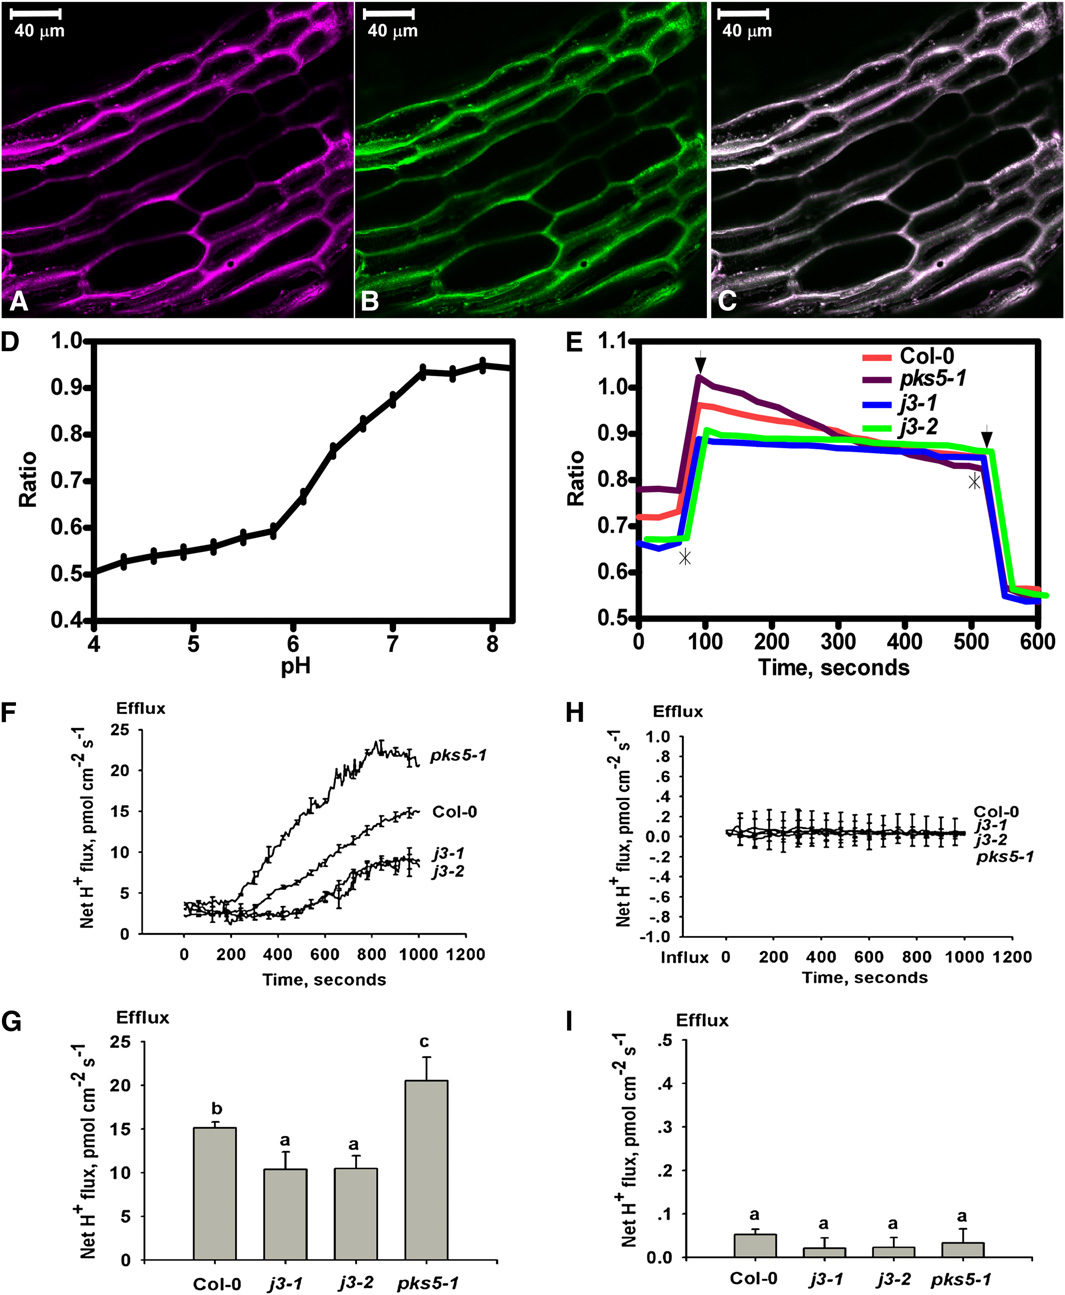
Figure 5. Proton Efflux Decreases in the Root of j3 Mutant Plants.
The pH sensitive ratiometric probe D-1950, a dextran-conjugated membrane impermeable fluorescence dye, was used to measure proton secretion inthe upper region of the root, and MIFE assays were used for proton efflux measurements at the root apex.
(A) to (E) pH ratio imaging in the apoplast of Col-0, pks5-1, j3-1, and j3-2 roots.
(A) Fluorescence of fluorescein in pseudocolor.
(B) Fluorescence of rhodamine in pseudocolor.
(C) Overlay of the fluorescein and rhodamine fluorescence in pseudo colors. Bars = 40 mm.
(D) pH calibration curve showing the response of the probe D-1950 at different pH buffers regimes.
(E) Mean value ratio curve for mutant (n = 20) and Col-0 (n = 17) plants. Ratios were calculated as fluorescein/rhodamin fluorescence levels. The slope ineach experiment was calculated and used in one-way analysis of variance. Asterisks show where pH regimes were shifted upwards to pH 8.4 anddownwards to pH 5.8, respectively. Arrows indicate the two outer points used to define the area from where the slope was calculated.
(F) to (I) The net proton effluxes in roots of Col-0, pks5-1, j3-1, and j3-2 plants. The MIFE technique was used for noninvasive ion flux measurement.
(F) Net proton effluxes in Col-0, pks5-1, j3-1, and j3-2 root tips. After roots were treated with alkaline conditions (pH 7.7) plus 75 mM NaCl, transient netH+ fluxes were recorded.
(G) Calculated net proton effluxes from (F).
J3 Activates Plasma Membrane H+-ATPase Activity
J3 Positively Regulates PM H+-ATPase Activity
treatment with immunoblot analysis using PM H+-ATPase anti-bodies, we did not observe significant differences in protein
Because J3 interacts with PKS5 and loss-of-function j3 and
levels among Col-0, pks5-1, j3-1, and j3-2 plants (see Supple-
pks5-1 mutants have opposite responses to salinity in alkaline
mental Figures 10A and 10B online). Addition of J3 protein to
conditions, we determined if J3 also has an effect on PM H+-
membranes isolated from pks5-1 had no significant effect on
ATPase activity. Plasma membrane–enriched vesicles were
activity (Figures 4E and 4F). These data indicate that J3 is a novel
isolated from 5-week-old Col-0, pks5-1, j3-1, and j3-2 plants
regulator of PM H+-ATPase activity and that this regulation likely
treated with or without 250 mM NaCl for 3 or 6 d, and the ATP
takes place via mediation of PKS5 activity.
hydrolytic and H+-transport activities of the H+-ATPase weremeasured. Assays in the presence of specific H+-ATPase inhib-itors demonstrated that the vesicles were enriched in plasma
Proton Efflux Is Increased in Roots of pks5-1 and Decreased
membranes and that they were transport competent (see Sup-
in Roots of j3 Mutants
plemental Table 1 and Supplemental Figure 8 online). Unlessindicated, all PM H+-ATPase activity assays shown monitor the
Previously, we have shown that the rate of proton secretion in
H+-transport activity of the H+-ATPase. Without NaCl treatment,
roots of pks5-1 plants is higher than that in wild type in alkaline
there was no significant difference in PM H+-ATPase activity
conditions (Fuglsang et al., 2007). The j3 mutants have opposite
between Col-0 and the j3 mutants (Figure 4A). After plants were
phenotypes in terms of PM H+ ATPase activity, sensitivity to salt,
treated with NaCl, PM H+-ATPase activity increased significantly
and alkalization when compared with pks5-1 plants. To deter-
in all plants. However, the increase in activity was significantly
mine the effect of salt and alkaline conditions on in vivo proton
lower in the vesicles isolated from j3 mutant plants compared
fluxes in the root of j3 seedlings, we used the pH-sensitive
with activity in Col-0 (Figures 4A to 4C). Consistent with previous
ratiometric probe D-1950, a dextran-conjugated membrane
results (Fuglsang et al., 2007), PM H+-ATPase activity in pks5-1
impermeable fluorescence dye that reports pH changes be-
mutant plants was higher than activity in Col-0 (Figures 4A to 4C).
tween pH 5.0 and pH 8, to measure proton secretion in the upper
When we increased the time of treatment to 6 d, PM H+-ATPase
region of the root and used microelectrode ion flux estimation
activity increased further relative to activity after the 3-d treat-
(MIFE) assays for proton efflux measurements at the root apex
ment. The increase in Col-0 was 44%, but only 11% in pks5-1,
(as described in Fuglsang et al., 2007).
14% in j3-1, and 19% in j3-2 mutants (Figures 4A and 4C). These
Seven-day-old seedlings of Col-0, pks5-1, j3-1, and j3-2
results suggest that loss of either PKS5 or J3 in Arabidopsis
grown on medium at pH 5.8 were preincubated with D1950 (20
alters regulation of PM H+-ATPase activity during salt stress. The
mM) in a buffer containing 10 mM KCl at pH 6.0. The probe was
difference in PM H+-ATPase activity between Col-0 and j3
found in the apoplast but not in the cytoplasm (Figures 5A to 5C).
increased to 32% (j3-1) and 31% (j3-2) after 6 d of treatment
The seedlings were subsequently treated with KHCO3 buffer, pH
compared with 14% (j3-1) and 16% (j3-2) after 3 d of treatment.
8.4, containing 75 mM NaCl. A pH increase was detected
Consistent with what we have shown previously, the pH optimum
immediately, and a decrease in apoplast pH in the root was
for PM H+-ATPase activity in pks5-1 shifted from 6.5 to 7.0, while
seen as a fluorescence change by confocal microscopy. Con-
for j3 mutants, the optimum stayed at 6.5, the same as for Col-0,
sistent with previous findings, the pH in the apoplast of roots in
but with lower activity (Figure 4D).
the pks5-1 mutant decreased faster than in Col-0 in response to
Addition of recombinant PKS5 protein to plasma membrane
salt in alkaline conditions, suggesting that the pks5-1 mutant
vesicles isolated from the pks5-1 mutant rescued PM H+-ATPase
secretes more H+ into the apoplast. However, the rate of de-
activity to Col-0 levels (Fuglsang et al., 2007). To determine if
crease in the j3 mutants was largely reduced compared with
addition of J3 protein in the assay also affects PM H+-ATPase
Col-0, suggesting that the j3 mutant secretes less H+ into the
activity, the J3 coding region was cloned into the pGEX-
apoplast (Figure 5E).
6p-1 vector to generate a translational fusion to glutathione
For noninvasive ion flux measurements, net H+ fluxes were
S-transferase (GST). The resulting plasmid was transferred into
measured in the root apex of 7-d-old seedlings of Col-0, pks5-1,
E. coli BL21 (DE3), and the J3 protein was purified and added to
j3-1, and j3-2. The seedlings were preincubated in buffer (0.5 mM
PM H+-ATPase assays. In the presence of 250 ng/mL J3, PM H+-
KCl, 0.1 mM CaCl2, and 0.3 mM MES, pH 6.0) for 20 min and
ATPase activity increased in vesicles isolated from Col-0 and the
assayed in the same buffer containing 75 mM NaCl at pH 7.7. The
j3 mutant (Figures 4E and 4F). As a control, GST or boiled J3
transmembrane H+ efflux increased in pks5-1 and decreased in
protein was added to assays and did not have any effect on PM
j3 compared with Col-0 (Figures 5F and 5G). To determine if the
H+-ATPase activity (see Supplemental Figure 9 online). When we
changes in H+ efflux in the mutants are due to the changes in PM
monitored the level of PM H+-ATPase protein in response to NaCl
H+-ATPase activity, net H+ fluxes at the root apex of Col-0 and
Figure 5. (continued).
(H) Vanadate treatment eliminated the net proton effluxes. The seedlings of Col-0, pks5-1, j3-1, and j3-2 were treated with alkaline conditions (pH 7.7)plus 75 mM NaCl and 1 mM vanadate and then the net proton effluxes were measured.
(I) Calculated net proton effluxes from (H). A Student's t test was used to determine statistical significance; significant differences (P # 0.05) in (G) and (I)are indicated by different lowercase letters.
[See online article for color version of this figure.]
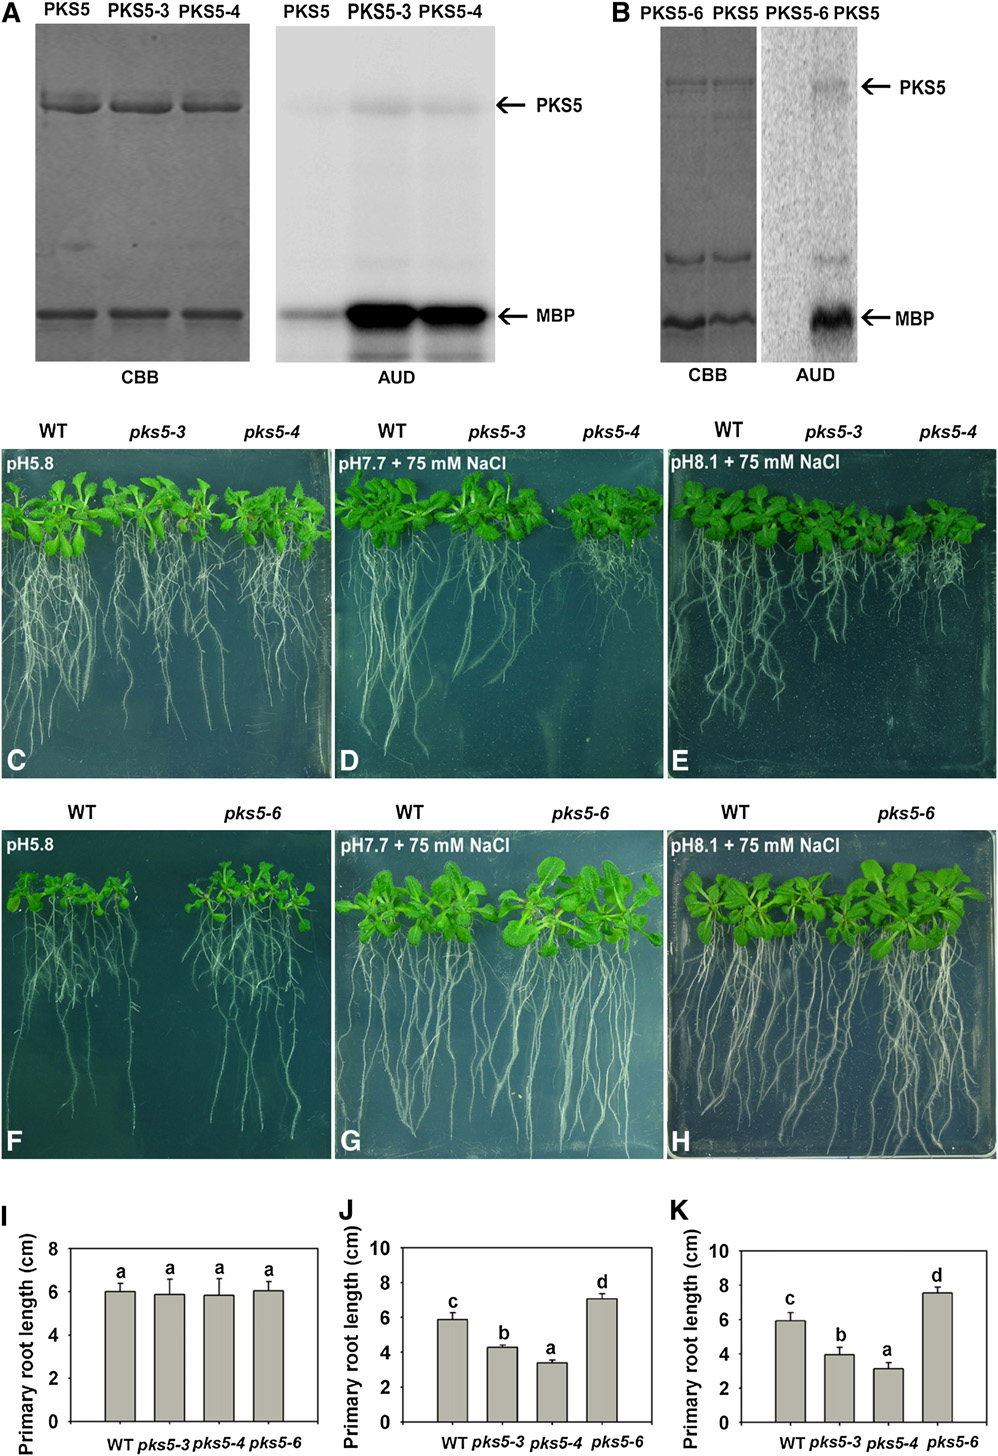
Figure 6. PKS5 Kinase Activity Negatively Correlates with PM H+-ATPase Activity and Seedling Sensitivity to Salt in Alkaline Conditions.
(A) and (B) Kinase activity comparison for the PKS5, PKS5-3, PKS5-4, and PKS5-6 proteins. Left panel: Coomassie blue (CBB)–stained SDS-PAGE gelcontaining the PKS5 wild-type and mutant proteins and the substrate, MBP. Right panel: autoradiograph (AUD) of kinase activity assays shown in theleft panel.
(C) to (H) Five-day-old wild type (Col er105), pks5-3, pks5-4, and pks5-6 seedlings grown on MS medium at pH 5.8 were transferred to MS medium atpH 5.8, at pH 7.7 with 75 mM NaCl, or at pH 8.1 with 75 mM NaCl. Photographs in (C) and (F) were taken 7 d after transfer; in (D) and (G), 14 d aftertransfer; and in (E) and (H), 21 d after transfer.
(I) Primary root elongation of seedlings transferred to MS medium at pH 5.8.
(J) Primary root elongation of seedlings transferred to MS medium at pH 7.7 with 75 mM NaCl.
(K) Primary root elongation of seedlings transferred to MS medium at pH 8.1 with 75 mM NaCl.
In (I) to (K), primary root length was measured 7, 14, and 21 d after transfer, respectively. Error bars represent SD (plant number >15). A Student's t testwas used for determining the statistical significance; significant differences (P # 0.05) in (I) to (K) are indicated by different lowercase letters.
J3 Activates Plasma Membrane H+-ATPase Activity
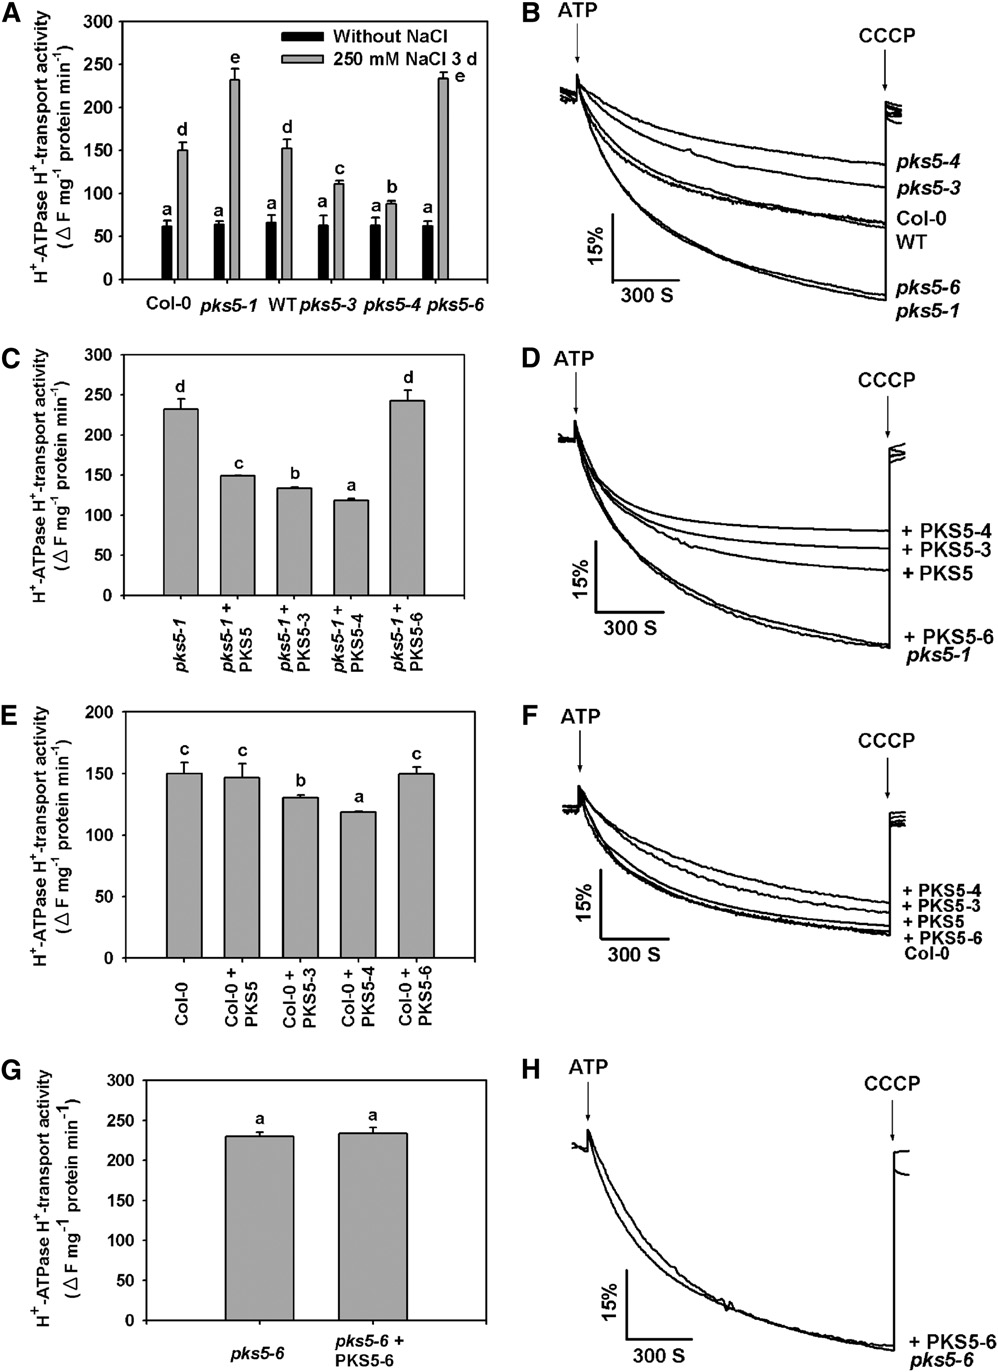
Figure 7. PKS5 Inhibits PM H+-ATPase Activity.
PM vesicles were isolated from wild-type (Col er105), Col-0, pks5-1 T-DNA insertion, and pks5-3, pks5-4, and pks5-6 point mutant plants treated with orwithout 250 mM NaCl for 3 d. PM H+-ATPase activity (H+-transport) was initiated by addition of 3 mM ATP, and the pH gradient was collapsed byaddition of 10 mM CCCP. PM H+-ATPase activity was measured in the vesicles as follows.
(A) Comparison of PM H+-ATPase activity in vesicles isolated from Col-0, pks5-1, wild-type, pks5-3, pks5-4, and pks5-6 plants treated with or without250 mM NaCl for 3 d.
(B) PM H+-ATPase activity was determined in the vesicles isolated from Col-0, pks5-1, wild-type, pks5-3, pks5-4, and pks5-6 plants treated with 250mM NaCl for 3 d.
(C) Comparison of PM H+-ATPase activity in vesicles isolated from pks5-1 mutant plants in the presence of 250 ng/mL PKS5, PKS5-3, PKS5-4, orPKS5-6 recombinant protein.
(D) PM H+-ATPase activity was measured in the vesicles isolated from pks5-1 mutant plants in the presence of 250 ng/mL PKS5, PKS5-3, PKS5-4, orPKS5-6 recombinant protein.
the mutants were measured in pH 7.7 buffer containing 1 mM
Next we tested the NaCl sensitivity of the pks5 mutants at
vanadate, an inhibitor of P-type ATPases (Figures 5H and 5I). No
alkaline pH. Five-day-old wild-type, pks5-3, pks5-4, and pks5-6
difference in net H+ efflux was detected for Col-0, pks5-1, j3-1, or
seedlings grown on medium at pH 5.8 were transferred to
j3-2, and vanadate eliminated H+ extrusion in all plants tested.
medium at pH 5.8, pH 7.7 with 75 mM NaCl, or pH 8.1 with 75
Taken together, our results suggest that PM H+-ATPase activity
mM NaCl. No significant growth differences were detected
is a major factor contributing to the higher rate of proton
between the wild type and pks5 mutants on medium at pH 5.8
secretion in the pks5-1 root and the lower rate in j3 mutants in
(Figures 6C, 6F, and 6I; see Supplemental Figure 13A online). On
salt and alkaline conditions.
medium at pH 7.7 with NaCl, root growth of pks5-3 and pks5-4(which had proteins with higher kinase activity than the wild-typePKS5 protein) was significantly reduced compared with the wild
PKS5 Activity Negatively Correlates with PM H+-ATPase
type (Figures 6D and 6J; see Supplemental Figure 13B online).
Activity and Seedling Sensitivity to Salt in
Root elongation in the pks5-3 and pks5-4 mutants was reduced
Alkaline Conditions
compared with that in wild type, and this reduction in growth was
To further demonstrate that J3 regulates PM H+-ATPase activity
even more pronounced at pH 8.1 in the presence of 75 mM NaCl
by mediating PKS5 kinase activity, we isolated pks5 mutants with
(Figures 6E and 6K; see Supplemental Figure 13C online).
differing levels of kinase activity. To do this, we screened a tilling
However, the root growth of pks5-6 (which had protein with
(targeting-induced local lesions in genomes) mutant pool (Till
much lower kinase activity than the wild-type PKS5 protein) was
et al., 2003) and isolated three pks5 point mutation alleles. Tilling
significantly greater than the growth of the wild type (Figures 6G,
mutants were generated in the Col er105 genetic background
6H, 6J, and 6K). These results demonstrate that PKS5 activity
(Torii et al., 1996), hereafter referred to as the wild type. We
negatively correlates with root growth on media with salt at
backcrossed the mutants three times into Col-0. These muta-
alkaline pH.
tions are distributed throughout the protein, including in the
Our previous data suggested that PKS5 is a negative regulator
N-terminal kinase domain (pks5-4) and in the C-terminal regula-
of the PM H+-ATPase (Fuglsang et al., 2007). To further demon-
tory domain (pks5-3) (see Supplemental Figure 11 online). In the
strate the link between PKS5 kinase and PM H+-ATPase activ-
pks5-3 mutant, the Ser at position 317 in the FISL motif was
ities, plasma membrane vesicles were isolated from leaves of
mutated to Leu; in the pks5-4 mutant, the Ala at position 168 in
Col-0, wild-type, pks5-1, pks5-3, pks5-4, and pks5-6 plants
the kinase activation loop was mutated to Val; while in the pks5-6
treated with or without 250 mM NaCl, and PM H+-ATPase activity
mutant, the Gly at position 219 in the kinase domain was mutated
was measured. Without NaCl treatment, Col-0, the wild type, and
to Ser (see Supplemental Figure 11 online). Both the kinase
the mutants had similar levels of PM H+-ATPase activity, and salt
activation loop and the FISL motif have been shown to be
stress increased their activity but to different levels (Figures 7A
important for PKS activity (Guo et al., 2001). We first tested
and 7B). Consistent with previous observations, PM H+-ATPase
whether these mutations affect PKS5 activity. PKS5 cDNAs were
activity (quenching of fluorescence) was much higher in vesicles
amplified from Col-0 and pks5 mutants and cloned into the
isolated from pks5-1 than in vesicles isolated from Col-0 (Figures
pQE30 vector containing a HIS tag. The fusion proteins were
7A and 7B). Similar results were observed with vesicles isolated
purified from E. coli using His affinity chromatography, and the
from the pks5-6 mutant. PM H+-ATPase activity in vesicles
purified PKS5 proteins were used in kinase assays. PKS5 has
isolated from the pks5-3 and pks5-4 mutants was much lower
been shown to be an active kinase in both auto- and trans-
than that of the wild type (Figures 7A and 7B). These results
(substrate) phosphorylation (Fuglsang et al., 2007). When
provide further support for a negative correlation between PM
compared with the activity of the wild-type PKS5 protein, re-
H+-ATPase activity and PKS5 kinase activity.
combinant PKS5-3 and PKS5-4 proteins were more active;
To provide additional evidence that changes in PM H+-ATPase
however, PKS5-6 was less active in both autophosphorylation
activity in the pks5 mutants are due to changes in PKS5 kinase
and Myelin Basic Protein (MBP) phosphorylation (Figures 6A and
activity, we added recombinant PKS5 proteins to transport
6B; see Supplemental Figure 12 online).
assays with plasma membrane vesicles isolated from the pks5-1
Figure 7. (continued).
(E) Comparison of PM H+-ATPase activity in vesicles isolated from wild-type plants in the presence of 250 ng/mL PKS5, PKS5-3, PKS5-4, or PKS5-6recombinant protein.
(F) PM H+-ATPase activity was measured in vesicles isolated from wild-type plants in the presence of 250 ng/mL PKS5, PKS5-3, PKS5-4, or PKS5-6recombinant protein.
(G) Comparison of PM H+-ATPase activity in vesicles isolated from pks5-6 mutant plants in the presence of 250 ng/mL of recombinant PKS5-6 protein.
(H) The PM H+-ATPase activity was measured in the vesicles isolated from pks5-6 mutant plants in the presence of 250 ng/mL PKS5-6 recombinantprotein.
The units of the PM H+-ATPase activity are DF/min per mg protein. All data represent means 6 SE of at least three replicate experiments. Each replicatewas performed using independent membrane preparations. One representative experiment of three replicates is shown in (B), (D), (F), and (H). AStudent's t test was used to determine statistical significance; significant differences (P # 0.05) in (A), (C), (E), and (G) are indicated by differentlowercase letters.
J3 Activates Plasma Membrane H+-ATPase Activity
mutant. Consistent with previous studies, wild-type PKS5 pro-tein significantly reduced PM H+-ATPase activity in vesiclesisolated from the pks5-1 mutant (Figures 7C and 7D) and had noeffect on the PM H+-ATPase activity of vesicles isolated fromCol-0 plants (Figures 7E and 7F). Recombinant PKS5-6 proteinhad no effect on PM H+-ATPase activity in the vesicles isolatedfrom Col-0 or the pks5-1 and pks5-6 mutants (Figures 7C to 7H).
When either PKS5-3 or PKS5-4 protein was added to vesiclesisolated from Col-0 or the pks5-1 mutant, PM H+-ATPase activitywas reduced; however, this effect was much more dramatic inpks5-1 compared with Col-0 (Figures 7C to 7F). When used ascontrols, boiled recombinant PKS recombinant proteins did nothave any effect on PM H+-ATPase activity. These results supportthe conclusion that PKS5 kinase activity is negatively correlatedwith PM H+-ATPase activity.
J3 Functions Upstream of PKS5 in the Regulation of PMH+-ATPase Activity
To determine whether PKS5 genetically interacts with J3, wecrossed j3-1 to pks5-1, pks5-3, or pks5-4 to generate j3-1 pks5-1, j3-1 pks5-3, and j3-1 pks5-4 double mutants. T-DNA insertionsin pks5-1 and j3-1 were confirmed using gene-specific primers,and the pks5-3 and pks5-4 mutations were confirmed usingderived cleaved amplified polymorphic sequences (dCAPS)primer-based PCR followed by sequencing of the mutations.
To assay PM H+-ATPase activity, plasma membrane–enrichedvesicles were isolated from Col-0 and double mutant plants
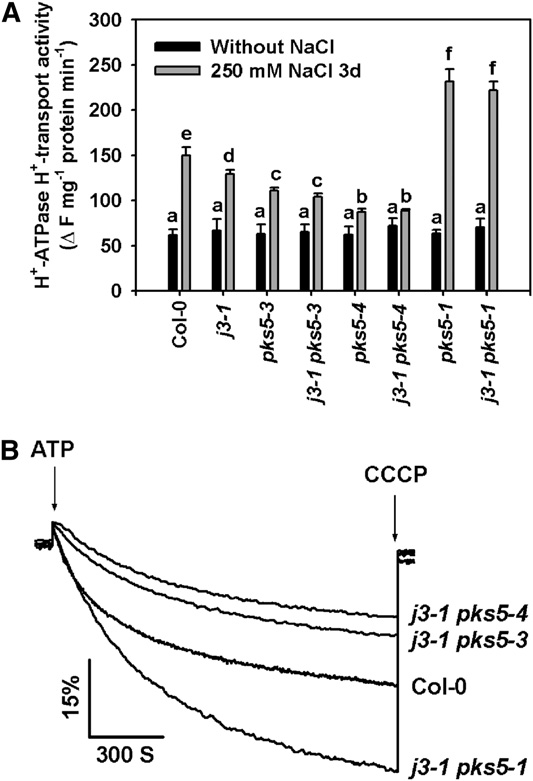
Figure 8. J3 Regulates PM H+-ATPase Activity through PKS5.
treated with or without 250 mM NaCl. As shown in Figure 8, the
Plasma membrane vesicles were isolated from Col-0, j3-1 pks5-1, j3-1
PM H+-ATPase activity of the salt-treated j3-1 pks5-1 double
pks5-3, and j3-1 pks5-4 mutant plants treated with or without 250 mM
mutant was similar to the activity of the pks5-1 single mutant, and
NaCl for 3 d. PM H+-ATPase activity was initiated by addition of 3 mM
the activities of both were higher than the activity in Col-0 after
ATP, and the pH gradient was collapsed by addition of 10 mM CCCP. PM
salt treatment. These results indicate that, genetically, J3 func-
H+-ATPase activity was measured in the vesicles as follows.
tions upstream of PKS5. Furthermore, PM H+-ATPase activity in
(A) Comparison of PM H+-ATPase activity in vesicles isolated from Col-0,
both the j3-1 pks5-3 and j3-1 pks5-4 double mutants was similar
j3-1, pks5-3, j3-1 pks5-3, pks5-4, j3-1 pks5-4, pks5-1, and j3-1 pks5-1plants treated with or without 250 mM NaCl for 3 d.
to the activity of their respective pks5 parent and lower than that
(B) PM H+-ATPase activity was determined in vesicles isolated from
of the j3-1 parent (Figure 8). These results demonstrate that J3
Col-0, j3-1 pks5-1, j3-1 pks5-3, and j3-1 pks5-4 plants treated with 250
regulates PM H+-ATPase activity by mediating PKS5 kinase
mM NaCl for 3 d.
The units of PM H+-ATPase activity are DF/min per mg protein. All data
To determine if the altered PM H+-ATPase activity in the dou-
represent means 6 SE of at least three replicate experiments. Each
ble mutants correlates with seedling responses to salt in alkaline
replicate was performed using independent membrane preparations.
conditions, 5-d-old j3-1, pks5-1, j3-1 pks5-1, pks5-3, j3-1 pks5-3,
One representative experiment of three replicates is shown in (B). A
pks5-4, and j3-1 pks5-4 plants grown on medium at pH 5.8 were
Student's t test was used to determine statistical significance; significant
transferred to MS medium at pH 5.8, pH 7.7 with 75 mM NaCl,
differences (P # 0.05) in (A) are indicated by different lowercase letters.
or pH 8.1 with 75 mM NaCl. Consistent with measurements ofPM H+-ATPase activity, all of the double mutants showedphenotypes similar to their pks5 parent (Figure 9; see Supple-
this hypothesis, a protein kinase assay was performed. As
mental Figure 14 online), suggesting that J3 regulates PM
predicted, J3 repressed PKS5 kinase activity (Figures 10A to
H+-ATPase activity and plant response to salt at alkaline pH by
10C and 10E), and the more J3 protein that was added to the
mediating PKS5 activity.
reaction, the more PKS5 activity was inhibited. The specificity ofthis repression was shown based on the lack of J3 repression ofthe kinase activity of SOS2 (Figures 10D and 10E), a PKS5
J3 Represses PKS5 Kinase Activity
Our results demonstrate that J3 interacts with and functions
When we overexpressed J3 in the pks5-1 and pks5-3 mutants,
genetically upstream of PKS5. In addition, these proteins have
the pks5-3 salt sensitive phenotype in alkaline conditions was
opposite effects on the regulation of PM H+-ATPase activity and
rescued, whereas the phenotype of pks5-1 was not significantly
seedling sensitivity to salt at alkaline pH. One explanation for
altered (Figures 10F to 10S; see Supplemental Figure 15 online).
these observations is J3 represses PKS5 kinase activity. To test
These results further support the conclusion that J3 regulation of
Figure 9. The j3-1 pks5 Double Mutants Phenocopy the pks5 Response to Salt in Alkaline Conditions.
(A) to (I) Five-day-old j3-1, pks5-1, j3-1 pks5-1, pks5-3, j3-1 pks5-3, pks5-4, and j3-1 pks5-4 mutant seedlings grown on MS medium at pH 5.8, at pH 7.7with 75 mM NaCl, or at pH 8.1 with 75 mM NaCl. Photographs in (A), (D), and (G) were taken 7 d after transfer; in (B), (E), and (H), 14 d after transfer; andin (C), (F), and (I), 21 d after transfer.
(J) Primary root elongation of plants transferred to MS medium at pH 5.8.
(K) Primary root elongation of plants transferred to MS medium at pH 7.7 with 75 mM NaCl.
(L) Primary root elongation of plants transferred to MS medium at pH 8.1 with 75 mM NaCl.
In (J) to (L), primary root length was measured 7, 14, and 21 d after transfer, respectively. Error bars represent SD (plant number >15). A Student's t testwas used to determine statistical significance; significant differences (P # 0.05) in (J) to (L) are indicated by different lowercase letters.
J3 Activates Plasma Membrane H+-ATPase Activity
Figure 10. J3 Represses PKS5 Kinase Activity.
Increasing concentrations of J3 protein were incubated in kinase assay buffer with PKS5 (A), PKS5-3 (B), PKS5-4 (C), or SOS2 (D) protein. Top panel:SDS-PAGE gel with MBP or GST-P3 stained with Coomassie blue (CBB). Lower panel: MBP or GST-P3 (P3; a synthetic peptide designed based on therecognition sequences of protein kinase C or SNF1/AMPK kinases, ALARAASAAALARRR) substrate phosphorylation (AUD).
(E) Quantification of data shown in (A) to (D).
(F) and (G) Overexpression of J3 in pks5-1 and pks5-3 mutants. Total RNA was extracted from 12-d-old seedlings of pks5-1, pks5-3, and
the response of the plant to salt in alkaline conditions takes place
activity (Figures 8 to 10). Interestingly, j3-1 pks5-3 and j3-1 pks5-4
via repression of PKS5 kinase activity.
double mutants have similar levels of PM H+-ATPase activity andsimilar sensitivity to growth in media with NaCl at alkaline pHto what is seen for their pks5 parent (Figures 8 and 9). The fact
that the phenotypes in these double mutants are not more severesuggests that other, as yet unidentified, components may also be
The PM H+-ATPase is a highly regulated enzyme with numerous
involved in the regulation of phosphorylation/dephosphorylation
physiological functions (Duby et al., 2009). Evidence exists for
of Ser-931 and that there is a threshold effect of PKS5 kinase
changes in phosphorylation status of the H+-ATPase leading to
activity on the regulation of PM H+-ATPase activity.
either activation or inhibition of enzyme activity (Vera-Estrella
PM H+-ATPase activity is stimulated by many environmental
et al., 1994; Xing et al., 1996; Schaller and Oecking, 1999).
changes, known to be regulated by a calcium-dependent
Activation of the enzyme requires phosphorylation of its C
SCaBP1-PKS5 pathway. When the Arabidopsis proteins are
terminus leading to the binding of 14-3-3 proteins and the
expressed in yeast, repression of PM H+-ATPase activity by
removal of an autoinhibition by the R domain. Several phosphor-
PKS5 is dependent on the presence of SCaBP1 (Fuglsang et al.,
ylation sites have been identified in the C-terminal region of the
2007); however, it is currently not known how SCaBP1 regulates
protein (Duby et al., 2009). While little is known about the protein
the PKS5 protein. The predicted functions of the SCaBP proteins
kinases or phosphatases that are directly responsible for altering
are to perceive changes in intracellular calcium levels (calcium
PM H+-ATPase phosphorylation status, several proteins have
sensors) and then to interact with, activate, and recruit PKS
been implicated in the C-terminal phosphorylation events lead-
kinase proteins to cell membranes to activate their targets
ing to binding of the regulatory 14-3-3 protein (Xing et al., 1996;
(Halfter et al., 2000; Quintero et al., 2002; Xu et al., 2006;
Lino et al., 1998; Svennelid et al., 1999; Fuglsang et al., 2006).
Fuglsang et al., 2007; Quan et al., 2007; Lin et al., 2009). It has
PKS5 was identified as a protein that negatively regulates PM
been shown that ANJ1, a DnaJ-like protein in Atriplex nummu-
H+-ATPase activity and controls intracellular pH homeostasis in
laria, is farnesylated and geranylgeranylated in planta (Zhu et al.,
response to alkaline pH (Fuglsang et al., 2007). PKS5 phosphor-
1993). These modifications rely on a Cys in the CAQQ motif at the
ylates Ser-931 on the AHA2 isoform of the PM H+-ATPase,
C terminus of the ANJ1 protein and increase the association of
which, in turn, blocks interaction between AHA2 and an activat-
ANJ1 with the cell membrane (Zhu et al., 1993). This CAQQ motif
ing 14-3-3 protein. Phosphorylation of this residue is indepen-
is absolutely conserved in the J3 C terminus, suggesting that,
dent of Thr-947 phosphorylation of AHA2 (Fuglsang et al., 2007).
during growth in NaCl at alkaline pH, J3 is prenylated and this
In the tobacco PMA2 isoform, the corresponding residue (Ser-
leads to the localization of J3 to the plasma membrane and to
938) is phosphorylated in vivo (Duby et al., 2009), although it is
activation of PM H+-ATPase via inhibition of PKS5 or, alterna-
not known whether a SOS2-like protein kinase is involved in this
tively, by modifying the affinity of PKS5 for the H+-ATPase.
In summary, we identified a new component of the PKS5 signal
In this study, we identified a component in the PKS5 signaling
transduction pathway that positively regulates PM H+-ATPase
pathway. J3 shares similar patterns of tissue-specific expression
activity in Arabidopsis. Our work provides additional evidence
and subcellular localization with PKS5 and interacts with PKS5 in
that regulation of the phosphorylation status of the PM H+-
planta (Figures 1 and 2). However, j3 knockout mutants display
ATPase is critical for the response of Arabidopsis to environ-
the opposite phenotype from pks5 loss-of-function mutants, with
mental stimuli.
the j3 mutants displaying increased sensitivity to NaCl at alkalinepH and decreased PM H+-ATPase activity (Figures 3 and 4).
Double mutant analysis suggests that J3 relies on and functions
upstream of PKS5. Overexpression of J3 rescues the pks5-3 (aPKS5 constitutively active mutant) salt-sensitive phenotype in
alkaline conditions but does not alter pks5-1 (a PKS5 T-DNA
Plants were grown in controlled growth chambers under a 16-h-light
knockout mutant) phenotype (Figure 10). These findings are
(228C)/8-h-dark (208C) cycle. The following Arabidopsis thaliana strains
consistent with the observation that J3 represses PKS5 kinase
were used in this study: Col-0 and Col erecta105 (wild type), which was
Figure 10. (continued).
overexpression J3 transgenic plants in both the pks5-1 and pks5-3 background. The resulting cDNAs were used for real-time PCR analysis. Error barsindicate SD (n = 3).
(H) to (O) Five-day-old pks5-1, pks5-3, wild-type, Col-0 seedlings, and seedlings overexpressing J3 in pks5-1 and pks5-3 grown on MS medium at pH5.8 were transferred to MS medium at pH 5.8 or at pH 7.7 with 75 mM NaCl. Photographs in (H), (J), (L), and (N) were taken 7 d after transfer; in (I), (K),(M), and (O), 14 d after transfer.
(P) and (R) Primary root elongation of seedlings transferred to MS medium at pH 5.8.
(Q) and (S) Primary root elongation of seedlings transferred to MS medium at pH 7.7 with 75 mM NaCl.
Primary root length was measured 7 d after transfer in (H), (J), (L), and (N) and 14 d after transfer in (I), (K), (M), and (O). Error bars represent SD (plantnumber >15). A Student's t test was used for determining the statistical significance; significant differences (P # 0.05) in (P) to (S) are indicated bydifferent lowercase letters.
J3 Activates Plasma Membrane H+-ATPase Activity
used for generating Tilling mutants. For salt treatment, 5-week-old plants
RNA Gel Blot Analysis of j3 Null Alleles
were treated with or without 250 mM NaCl for 3 or 6 d. The Tilling mutants
Total RNA was isolated from 10-d-old seedlings of Col-0, pks5-1, j3-1,
(Till et al., 2003) pks5-3, pks5-4, and pks5-6 were obtained from the ABRC
and j3-2 mutants. RNA (15 mg) from each sample was used for RNA gel
(Alonso et al., 2003), and homozygous lines were identified by dCAPS-
blot analysis (Guo et al., 2001).
based PCR and sequencing. The following dCAPS primer sequences wereused: pks5-3, 59-GCGTTTGATTTGATTTCTTACTCCT-39 and 59-CACCA-CAAGCAAATCATTCAA-39 were used to amplify a 263-bp DNA fragment
Confocal Images and Proton Efflux Measurements
with an AvaI site to distinguish pks5-3 and the wild type; pks5-4,
GFP-J3 was constructed by excising the J3 open reading frame from a
His-J3 plasmid with BamHI and SalI and cloning it into the pCAMBIA1205-
TTC-39 harboring an MluI site were used to amplify a 236-bp DNA
GFP binary vector downstream of GFP. The coding sequences of PKS5,
fragment; pks5-6, 59-GTCTTGTTCGTTCTCGTCACC-39 and 59-CTGATC-
PKS5-3, PKS5-4, and PKS5-6 were introduced into the pTA7002 vector
TTCGATCTCGTCATC-39 harboring an AgeI site were used to amplify a
after PCR amplification with the primers 59-CCGCTCGAGATGCCA-
252-bp fragment. j3 T-DNA insertion mutants (SALK_132923 and
SALK_141625) were obtained from ABRC and identified using the following
GAC-39, which introduced XhoI restriction sites at each end. These
primer sequences: 59-GCTGTTGACGGCTTAGGTAG-39 or 59-TTCGAC-
constructs were transformed into Col-0 plants. Five-day-old transgenic
TCGATCTTGCGTTT-39 and left border T-DNA primers LBa1 59-TGGTT-
T2 GFP-J3 lines were used for subcellular localization. Five-day-old T2
CACGTAGTGGGCCATCG-39 and LBb1 59-GCGTGGACCGCTTGCTG-
PTA7002-PKS5-YFP transgenic plants were treated with 10 mM dexa-
CAACT-39. j3-1 pks5-1, j3-1 pks5-3, and j3-1 pks5-4 double mutants
methasone (Sigma-Aldrich) before analysis. GFP-J3 and PKS5-YFP fluo-
were obtained by crossing j3-1 to pks5-1, pks5-3, and pks5-4 respectively,
rescence was detected and images collected on a Zeiss 510 META
and confirmed by PCR and sequencing.
confocal microscope. Proton efflux measurements and pH ratio imaging inthe apoplast were as described (Fuglsang et al., 2007).
Plasmid Construction
The full-length PKS5 coding sequence was amplified by RT-PCR using
Promoter-GUS Analysis
A 1918-bp DNA fragment from 28 to 21926 bp upstream of the transla-
TAAATAGCCGDGTTTGTTG-39 primers harboring a BamHI or EcoRI site,
tional start site of J3 was amplified with primers 59-AGCGTCGACTGATT-
respectively. The PCR products were cloned into the pGEX-6p-1 vector
between BamHI and EcoRI sites. The coding sequences of PKS5-3,
ACCCTA-39 and cloned into the NcoI and SalI sites of the pCAMBIA1301
PKS5-4, and PKS5-6 were also cloned into pGEX-6p-1. All fragments
vector. The plasmid was transformed into wild-type Arabidopsis, and
containing PKS5 and mutant coding sequences were digested from
transgenic T2 lines were used for GUS assays.
pGEX-6p-1 with BamHI and SalI and subcloned into pQE30 to generatefusions to a His-tag. J3 was amplified using primers 59-CGGGATC-CATGTTCGGTAGAGGACCCTC-39 and 59-GCGTCGACTTACTGCTGG-
Quantitative Real-Time PCR
GCACATTGCA-39 and cloned into the BamHI and SalI sites of pET28a. J3
Total RNA was extracted with the TRI reagent (Ambion) from 10-d-old
was then subcloned from this plasmid into other expression vectors as
seedlings. Ten micrograms of total RNA was treated with RNase-free
indicated. All plasmids were verified by sequencing.
DNase I (Promega) to remove DNA, and 2 mg of treated RNA was used forreverse transcription with M-MLV Reverse transcriptase (Promega)
Kinase Activity Assays
according to the manufacturer's protocol. Real-time PCR was performed
Fusion constructs were transformed into Escherichia coli strain BL21
using an ABI 7500 Fast Real-Time PCR instrument and SYBR Premix
(DE3). The recombinant proteins were purified with glutathione-Sepharose
Ex Taq kit (TaKaRa). Gene expression levels were standardized using
(Amersham Pharmacia) according to the manufacturer's protocol. Kinase
ACTIN2 as an internal control. The following primer sequences were
activity assays were started by mixing 100 ng of the kinase and 500 ng of
used: for PKS5 expression, forward 59-TCGTCGGGATTGGATTTGTC-39
MBP in 20-mL reactions with kinase assay buffer (20 mM Tris-HCl, pH 7.2,
and reverse 59-TCCATCTCAAACCCATACTC-39; for J3 expression, for-
ward 59-TTCTACCTAAGCCGTCAAC-39 and reverse 59-CGTCATCAT-
2, 0.5 mM CaCl2, 10 mM ATP, and 2 mM DTT). After addition of
0.3 mL of [g-32P]ATP, the mixture was incubated at 308C for 30 min. The
CATAAGCCTC-39; for ACTIN2, forward 59-GTCGTACAACCGGTA-
reaction was terminated by the addition of 4 mL of 53 SDS loading buffer,
TTGTG-39 and reverse 59-GAGCTGGTCTTTGAGGTTTC-39.
and the products were separated on 12% SDS-PAGE gels. The gels werestained with Coomassie Brilliant Blue, exposed on a storage phosphor
screen, and phosphorylation visualized using a Typhoon 9410 phosphor
The plasmids were purified using a Plasmid Maxprep Kit (Vigorous
imager (Amersham).
Biotechnology) and introduced into Arabidopsis mesophyll protoplasts(Sheen, 2001). Coimmunoprecipitation was performed as described
Yeast Two-Hybrid Assays
(Quan et al., 2007).
The PKS5 coding sequence was cloned into the pAS2 vector between theNcoI and SalI sites. PKS5N, encoding the N-terminal 281amino acids of
Plasma Membrane and Nuclei Isolation
PKS5, and PKS5C, encoding the C-terminal 154 amino acids, wereamplified by PCR and were also cloned between the NcoI and SalI sites of
Plasma membrane–enriched vesicles were isolated from 5-week-old
pAS2. The J3 coding sequence was cloned into the pACT2 vector
plants using aqueous two-phase partitioning as described (Qiu et al.,
between the BamHI and XhoI sites. Plasmid DNA (50 mg total) from an
2002). All steps were performed at 48C or on ice. Plants were homoge-
Arabidopsis cDNA library (ABRC) was transformed into the yeast Y190
nized in isolation buffer containing 0.33 M sucrose, 10% (w/v) glycerol,
strain harboring the pAS2-PKS5 plasmid. Yeast transformation and
0.2% (w/v) BSA, 5 mM EDTA, 5 mM DTT, 5 mM ascorbate, 0.2% (w/v)
growth assays were performed as described in the Yeast Protocols
casein, 0.6% (w/v) polyvinylpyrrolidone, 1 mM PMSF, 13 protease
Handbook (Clontech). Two positive clones were identified, and sequence
inhibitor, and 50 mM HEPES-KOH, pH 7.5. Two to four milliliters of
analysis revealed that they are identical to At3g44110 (J3).
homogenization buffer were used per gram of tissue. The homogenate
was filtered through two layers of Miracloth and centrifuged at 13,000g for
Supplemental Figure 3. Phenotypic Complementation of pks5-1 by
10 min. The supernatant then was centrifuged for 50 min at 80,000g to
Expression of DexP:33flag-PKS5.
obtain a microsomal pellet that was resuspended in a buffer containing
Supplemental Figure 4. PKS5 and J3 Were Detected in Soluble and
0.33 M sucrose, 3 mM KCl, 0.1 mM EDTA, 1 mM DTT, 1 mM PMSF, 13
Plasma Membrane–Enriched Fractions.
protease inhibitor, and 5 mM potassium phosphate, pH 7.8. The sus-pension was added to a phase mixture to obtain a phase system
Supplemental Figure 5. RT-PCR Analysis of J3 in Col-0, j3-1, and
consisting of 6.2% (w/w) Dextran T-500 and 6.2% (w/w) polyethylene
j3-2 Plants Using ACTIN2 as Control.
glycol 3350 in 5 mM potassium phosphate, pH 7.8, buffer containing
Supplemental Figure 6. Alkaline Conditions Significantly Enhance
0.33 M sucrose and 3 mM KCl. The final upper phases were collected,
Arabidopsis Sensitivity to Salt.
diluted with resuspension buffer containing 0.33 M sucrose, 10% (w/v)
Supplemental Figure 7. Fresh Weight of Col-0, pks5-1, j3-1, and j3-2
glycerol, 0.1% (w/v) BSA, 0.1 mM EDTA, 2 mM DTT, 13 protease
under Salt and Alkalinity Conditions.
inhibitor, and 20 mM HEPES-KOH, pH 7.5, and centrifuged for 50 minat 100,000g. The resulting pellet was collected and resuspended with
Supplemental Figure 8. Vesicles Isolated from Arabidopsis Leaves
resuspension buffer containing 1 mM EDTA. Isolation of a nuclei-enriched
Are Transport Competent.
fraction was performed as described (Bowler et al., 2004).
Supplemental Figure 9. GST Protein Has No Effect on PM H+-ATPase Activity.
PM H+-ATPase Activity Assays
Supplemental Figure 10. Immunoblot of PM H+-ATPase Protein fromCol-0, pks5-1, j3-1, and j3-2 Plants.
To characterize the activity of PM H+-ATPase, its H+-transport activitywas measured as described (Qiu et al., 2002) using 50 mg of plasma
Supplemental Figure 11. Schematic Diagram of Domains and pks5
membrane protein. When used, recombinant protein (250 ng/mL) was
Point Mutations' Distribution in the PKS5 Protein.
preincubated for 10 min at room temperature with plasma membrane
Supplemental Figure 12. Kinase Assay for Recommbinant Proteins
vesicles. An inside-acid pH gradient (DpH) was formed in the vesicles by
PKS5, PKS5-3, and pET28a Empty Vector.
the activity of the H+-ATPase and measured as a decrease (quench) in the
Supplemental Figure 13. Fresh Weight of the Wild Type, pks5-3,
fluorescence of quinacrine (a pH-sensitive fluorescent probe). Assays (2
pks5-4, and pks5-6 under Salt and Alkalinity Conditions.
mL) contained 5 mM quinacrine, 3 mM MgSO4, 100 mM KCl, 25 mM 1,3-bis[Tris(hydroxylmethyl)methylamino]propane-HEPES, pH 6.5, 250 mM
Supplemental Figure 14. Fresh Weight of Col-0, j3-1, pks5-1, j3-1
mannitol, and 50 mg/mL of plasma membrane protein. Reactions were
pks5-1, pks5-3, j3-1 pks5-3, pks5-4, and j3-1 pks5-4 Seedlings under
mixed by inversion several times and then placed in a dark chamber in a
Salt and Alkalinity Conditions.
fluorescence spectrophotometer (Hitachi F-4500). Reactions were equil-
Supplemental Figure 15. Fresh Weight of j3-1, pks5-1, pks5-3, and
ibrated in the dark with stirring for 5 min before beginning fluorescence
pks5-1 (pks5-1:J3) or pks5-3 Overexpressing J3 (pks5-3:J3) under
readings. The assay was initiated by the addition of ATP to a final
Salt and Alkalinity Conditions.
concentration of 3 mM, and formation of DpH was measured at excitationand emission wavelengths of 430 and 500 nm, respectively. At the end
Supplemental Table 1. Vesicles Isolated from Arabidopsis Leaves
of each reaction, 10 mM (final concentration) of the protonophore,
Are Enriched in Plasma Membranes.
m-chlorophenylhydrazone (CCCP) was added to dissipate any remainingpH gradient. Specific activity was calculated by dividing the change influorescence by the mass of plasma membrane protein in the reaction perunit time (DF/min per mg of protein). Unless indicated, all data represent
means 6 SE of at least three replicate experiments.
We thank Shidi Li and Jun Zhang for excellent technical assistance,Juan Sun and Lihua Hao from Xuyue (Beijing) Science and Technologyfor the MIFE assay, and the ABRC (Ohio State University) for the T-DNA
Determination of Plasma Membrane Purity
insertion and Tilling lines. This work was supported by the National
To characterize the membrane origin and purity of the membrane ves-
Basic Research Program of China (Grant 2006CB100100), the National
icles, H+-ATPase substrate hydrolytic activity was determined by mea-
High Technology Research and Development Program of China 863
suring the release of Pi from ATP in the presence or absence of
(Grant 2008AA022304 to Y.G.), and U.S. Department of Energy/Energy
H+-ATPase specific inhibitors (Yan et al., 2002).
Biosciences (Grant DE-FG02-04ER15616 to K.S.S.).
Accession Numbers
Received June 25, 2009; revised March 16, 2010; accepted March 30,
Sequence data from this article can be found in the Arabidopsis Genome
2010; published April 23, 2010.
Initiative under the following accession numbers: PKS5, At2g30360; J3,At3g44110.
Supplemental Data
Alonso, J.M., et al. (2003). Genome-wide insertional mutagenesis of
The following materials are available in the online version of this article.
Arabidopsis thaliana. Science 301: 653–657.
Aoyama, T., and Chua, N.H. (1997). A glucocorticoid-mediated
Supplemental Figure 1. Expression of J3 and PKS5 in Roots, Stems,
transcriptional induction system in transgenic plants. Plant J. 11:
Rosette Leaves, Cauline Leaves, Flowers, and Siliques Determined by
Quantitative Real-Time PCR Using Gene-Specific Primers.
Ayala, F., O'Leary, J.W., and Schumaker, K.S. (1996). Increased
Supplemental Figure 2. Phenotypic Complementation of j3-1 by
vacuolar and plasma membrane H+-ATPase activities in Salicornia
Expression of 35SP:GFP-J3.
bigelovii Torr. in response to NaCl. J. Exp. Bot. 47: 25–32.
J3 Activates Plasma Membrane H+-ATPase Activity
Banecki, B., Liberek, K., Wall, D., Wawrzyno´w, A., Georgopoulos, C.,
proteins converts a dimer into a hexamer. Proc. Natl. Acad. Sci. USA
Bertoli, E., Tanfani, F., and Zylicz, M. (1996). Structure-function
102: 11675–11680.
analysis of the zinc finger region of the DnaJ molecular chaperone.
Kim, Y.S., Min, J.K., Kim, D., and Jung, J. (2001). A soluble auxin-
J. Biol. Chem. 271: 14840–14848.
binding protein, ABP57. Purification with anti-bovine serum albumin
Boston, R.S., Viitanen, P.V., and Vierling, E. (1996). Molecular chap-
antibody and characterization of its mechanistic role in the auxin
erones and protein folding in plants. Plant Mol. Biol. 32: 191–222.
effect on plant plasma membrane H+-ATPase. J. Biol. Chem. 276:
Bowler, C., Benvenuto, G., Laflamme, P., Molino, D., Probst, A.V.,
Tariq, M., and Paszkowski, J. (2004). Chromatin techniques for plant
Kinoshita, T., Nishimura, M., and Shimazaki, K. (1995). Cytosolic
cells. Plant J. 39: 776–789.
concentration of Ca2+ regulates the plasma membrane H+-ATPase in
Brault, M., Amiar, Z., Pennarun, A.M., Monestiez, M., Zhang, Z.,
guard cells of fava bean. Plant Cell 7: 1333–1342.
Cornel, D., Dellis, O., Knight, H., Bouteau, F., and Rona, J.P.
Laufen, T., Mayer, M.P., Beisel, C., Klostermeier, D., Mogk, A.,
(2004). Plasma membrane depolarization induced by abscisic acid in
Reinstein, J., and Bukau, B. (1999). Mechanism of regulation of
Arabidopsis suspension cells involves reduction of proton pumping in
hsp70 chaperones by DnaJ cochaperones. Proc. Natl. Acad. Sci. USA
addition to anion channel activation, which are both Ca2+ dependent.
96: 5452–5457.
Plant Physiol. 135: 231–243.
Li, G.L., Li, B., Liu, H.T., and Zhou, R.G. (2005). The responses of AtJ2
Bukau, B., and Horwich, A.L. (1998). The Hsp70 and Hsp60 chaperone
and AtJ3 gene expression to environmental stresses in Arabidopsis.
machines. Cell 92: 351–366.
Zhi Wu Sheng Li Yu Fen Zi Sheng Wu Xue Xue Bao 31: 47–52.
Camoni, L., Iori, V., Marra, M., and Aducci, P. (2000). Phosphory-
Liberek, K., Marszalek, J., Ang, D., Georgopoulos, C., and Zylicz, M.
lation-dependent interaction between plant plasma membrane
(1991). Escherichia coli DnaJ and GrpE heat shock proteins jointly
H+-ATPase and 14-3-3 proteins. J. Biol. Chem. 275: 9919–9923.
stimulate ATPase activity of DnaK. Proc. Natl. Acad. Sci. USA 88:
Caplan, A.J., Cyr, D.M., and Douglas, M.G. (1993). Eukaryotic homo-
logues of Escherichia coli dnaJ: A diverse protein family that functions
Lin, H., Yang, Y., Quan, R., Mendoza, I., Wu, Y., Du, W., Zhao, S.,
with hsp70 stress proteins. Mol. Biol. Cell 4: 555–563.
Schumaker, K.S., Pardo, J.M., and Guo, Y. (2009). Phosphorylation
Duby, G., Poreba, W., Piotrowiak, D., Bobik, K., Derua, R., Waelkens,
of SOS3-LIKE CALCIUM BINDING PROTEIN8 by SOS2 protein kinase
E., and Boutry, M. (2009). Activation of plant plasma membrane
stabilizes their protein complex and regulates salt tolerance in
H+-ATPase by 14-3-3 proteins is negatively controlled by two phos-
Arabidopsis. Plant Cell 21: 1607–1619.
phorylation sites within the H+-ATPase C-terminal region. J. Biol. Chem.
Lino, B., Baizabal-Aguirre, V.M., and Gonzalez de la Vara, L.E.
284: 4213–4221.
(1998). The plasma-membrane H+-ATPase from beet root is inhibited
Fuglsang, A.T., Guo, Y., Cuin, T.A., Qiu, Q., Song, C., Kristiansen, K.
by a calcium-dependent phosphorylation. Planta 204: 352–359.
A., Bych, K., Schulz, A., Shabala, S., Schumaker, K.S., Palmgren,
Lu, S., et al. (2006). The cauliflower Or gene encodes a DnaJ cysteine-
M.G., and Zhu, J.K. (2007). Arabidopsis protein kinase PKS5 inhibits
rich domain-containing protein that mediates high levels of beta-
the plasma membrane H+-ATPase by preventing interaction with 14-
carotene accumulation. Plant Cell 18: 3594–3605.
3-3 protein. Plant Cell 19: 1617–1634.
Merlot, S., Leonhardt, N., Fenzi, F., Valon, C., Costa, M., Piette, L.,
Fuglsang, A.T., Tulinius, G., Cui, N., and Palmgren, M.G. (2006).
Vavasseur, A., Genty, B., Boivin, K., Muller, A., Giraudat, J., and
Protein phosphatase 2A scaffolding subunit A interacts with plasma
Leung, J. (2007). Constitutive activation of a plasma membrane H+-
membrane H+-ATPase C-terminus in the same region as 14-3-3
ATPase prevents abscisic acid-mediated stomatal closure. EMBO J.
protein. Physiol. Plant. 128: 334–340.
26: 3216–3226.
Georgopoulos, C.P., Lundquist-Heil, A., Yochem, J., and Feiss, M.
Miernyk, J.A. (1999). Protein folding in the plant cell. Plant Physiol. 121:
(1980). Identification of the E. coli dnaJ gene product. Mol. Gen.
Genet. 178: 583–588.
Miernyk, J.A. (2001). The J-domain proteins of Arabidopsis thaliana: An
Gevaudant, F., Duby, G., von Stedingk, E., Zhao, R., Morsomme, P.,
unexpectedly large and diverse family of chaperones. Cell Stress
and Boutry, M. (2007). Expression of a constitutively activated
Chaperones 6: 209–218.
plasma membrane H+-ATPase alters plant development and in-
Morsomme, P., and Boutry, M. (2000). The plant plasma membrane
creases salt tolerance. Plant Physiol. 144: 1763–1776.
H+-ATPase: Structure, function and regulation. Biochim. Biophys.
Goffin, L., and Georgopoulos, C. (1998). Genetic and biochemical
Acta 1465: 1–16.
characterization of mutations affecting the carboxy-terminal domain
Ottmann, C., Marco, S., Jaspert, N., Marcon, C., Schauer, N.,
of the Escherichia coli molecular chaperone DnaJ. Mol. Microbiol. 30:
Weyand, M., Vandermeeren, C., Duby, G., Boutry, M., Wittinghofer,
A., Rigaud, J.L., and Oecking, C. (2007). Structure of a 14-3-3
Guo, Y., Halfter, U., Ishitani, M., and Zhu, J.K. (2001). Molecular
coordinated hexamer of the plant plasma membrane H+-ATPase by
characterization of functional domains in the protein kinase SOS2 that
combining X-ray crystallography and electron cryomicroscopy. Mol.
is required for plant salt tolerance. Plant Cell 13: 1383–1400.
Cell 25: 427–440.
Halfter, U., Ishitani, M., and Zhu, J.K. (2000). The Arabidopsis SOS2
Palmgren, M.G. (2001). Plant plasma membrane H+-ATPases: Power-
protein kinase physically interacts with and is activated by the
houses for nutrient uptake. Annu. Rev. Plant Physiol. Plant Mol. Biol.
calcium-binding protein SOS3. Proc. Natl. Acad. Sci. USA 97:
52: 817–845.
Palmgren, M.G., Sommarin, M., Serrano, R., and Larsson, C. (1991).
Ham, B.K., Park, J.M., Lee, S.B., Kim, M.J., Lee, I.J., Kim, K.J.,
Identification of an autoinhibitory domain in the C-terminal region of
Kwon, C.S., and Paek, K.H. (2006). Tobacco Tsip1, a DnaJ-type Zn
the plant plasma membrane H+-ATPase. J. Biol. Chem. 266: 20470–
finger protein, is recruited to and potentiates Tsi1-mediated tran-
scriptional activation. Plant Cell 18: 2005–2020.
Pimpl, P., Movafeghi, A., Coughlan, S., Denecke, J., Hillmer, S., and
Kanczewska, J., Marco, S., Vandermeeren, C., Maudoux, O.,
Robinson, D.G. (2000). In situ localization and in vitro induction of
Rigaud, J.L., and Boutry, M. (2005). Activation of the plant plasma
plant COPI-coated vesicles. Plant Cell 12: 2219–2236.
membrane H+-ATPase by phosphorylation and binding of 14-3-3
Qian, Y.Q., Patel, D., Hartl, F.U., and McColl, D.J. (1996). Nuclear
magnetic resonance solution structure of the human Hsp40 (HDJ-1)
Till, B., et al. (2003). Large-scale discovery of induced point mutations
J-domain. J. Mol. Biol. 260: 224–235.
with high throughput TILLING. Genome Res. 13: 524–530.
Qiu, Q.S., Guo, Y., Dietrich, M.A., Schumaker, K.S., and Zhu, J.K.
Torii, K.U., Mitsukawa, N., Oosumi, T., Matsuura, Y., Yokoyama, R.,
(2002). Regulation of SOS1, a plasma membrane Na+/H+ exchanger in
Whittier, R.F., and Komeda, Y. (1996). The Arabidopsis ERECTA
Arabidopsis thaliana, by SOS2 and SOS3. Proc. Natl. Acad. Sci. USA
gene encodes a putative receptor protein kinase with extracellular
99: 8436–8441.
leucine-rich repeats. Plant Cell 8: 735–746.
Qiu, X.B., Shao, Y.M., Miao, S., and Wang, L. (2006). The diversity of
Vera-Estrella, R., Barkla, B.J., Higgins, V.J., and Blumwald, E. (1994).
the DnaJ/Hsp40 family, the crucial partners for Hsp70 chaperones.
Plant defense response to fungal pathogens (activation of host-
Cell. Mol. Life Sci. 63: 2560–2570.
plasma membrane H+-ATPase by elicitor-induced enzyme dephos-
Quan, R., Lin, H., Mendoza, I., Zhang, Y., Cao, W., Yang, Y., Shang,
phorylation). Plant Physiol. 104: 209–215.
M., Chen, S., Pardo, J.M., and Guo, Y. (2007). SCABP8/CBL10, a
Wall, D., Zylicz, M., and Georgopoulos, C. (1995). The conserved G/F
putative calcium sensor, interacts with the protein kinase SOS2 to
motif of the DnaJ chaperone is necessary for the activation of the
protect Arabidopsis shoots from salt stress. Plant Cell 19: 1415–1431.
substrate binding properties of the DnaK chaperone. J. Biol. Chem.
Quintero, F.J., Ohta, M., Shi, H., Zhu, J.K., and Pardo, J.M. (2002).
270: 2139–2144.
Reconstitution in yeast of the Arabidopsis SOS signaling pathway for
Wang, W., Vinocur, B., Shoseyov, O., and Altman, A. (2004). Role of
Na+ homeostasis. Proc. Natl. Acad. Sci. USA 99: 9061–9066.
plant heat-shock proteins and molecular chaperones in the abiotic
Richards, L.A. (1954). Diagnosis and improvement of saline and alkali
stress response. Trends Plant Sci. 9: 244–252.
soils. In US Salinity Lab Handbook 60. United States Department of
Waters, E.R., Lee, G.J., and Vierling, E. (1996). Evolution, structure
Agriculture. (Washington, DC: Government Printing Office).
and function of the small heat shock proteins in plants. J. Exp. Bot.
Rober-Kleber, N., Albrechtova, J.T., Fleig, S., Huck, N., Michalke,
47: 325–338.
W., Wagner, E., Speth, V., Neuhaus, G., and Fischer-Iglesias, C.
Wu, J., and Seliskar, D. (1998). Salinity adaptation of plasma mem-
(2003). Plasma membrane H+-ATPase is involved in auxin-mediated
brane H+-ATPase in the salt marsh plant Spartina patens: ATP
cell elongation during wheat embryo development. Plant Physiol. 131:
hydrolysis and enzyme kinetics. J. Exp. Bot. 49: 1005–1013.
Xing, T., Higgins, V.J., and Blumwald, E. (1996). Regulation of plant
Roelfsema, M.R.G., Staal, M., and Prins, H.B.A. (1998). Blue light-
defense response to fungal pathogens: Two types of protein kinases
induced apoplastic acidification of Arabidopsis thaliana guard cells:
in the reversible phosphorylation of the host plasma membrane
Inhibition by ABA is mediated through protein phosphatases. Physiol.
H+-ATPase. Plant Cell 8: 555–564.
Plant. 103: 466–474.
Xing, T., Higgins, V.J., and Blumwald, E. (1997). Identification of G
Schaller, A., and Oecking, C. (1999). Modulation of plasma membrane
proteins mediating fungal elicitor-induced dephosphorylation of host
H+-ATPase activity differentially activates wound and pathogen de-
plasma membrane H+-ATPase. J. Exp. Bot. 48: 229–237.
fense responses in tomato plants. Plant Cell 11: 263–272.
Xu, J., Li, H.D., Chen, L.Q., Wang, Y., Liu, L.L., He, L., and Wu, W.H.
Scidmore, M.A., Okamura, H.H., and Rose, M.D. (1993). Genetic
(2006). A protein kinase, interacting with two calcineurin B-like pro-
interactions between KAR2 and SEC63, encoding eukaryotic homo-
teins, regulates K+ transporter AKT1 in Arabidopsis. Cell 125: 1347–
logues of DnaK and DnaJ in the endoplasmic reticulum. Mol. Biol. Cell
4: 1145–1159.
Yan, B.C., and Yan, J.F. (1999). Size and folding in globular proteins.
Sheen, J. (2001). Signal transduction in maize and Arabidopsis meso-
Int. J. Biol. Macromol. 24: 65–67.
phyll protoplasts. Plant Physiol. 127: 1466–1475.
Yan, F., Zhu, Y., Muller, C., Zorb, C., and Schubert, S. (2002).
Silver, P.A., and Way, J.C. (1993). Eukaryotic DnaJ homologs and the
Adaptation of H+-pumping and plasma membrane H+-ATPase activity
specificity of Hsp70 activity. Cell 74: 5–6.
in proteoid roots of white lupin under phosphate deficiency. Plant
Svennelid, F., Olsson, A., Piotrowski, M., Rosenquist, M., Ottman,
Physiol. 129: 50–63.
C., Larsson, C., Oecking, C., and Sommarin, M. (1999). Phosphor-
Zhang, X., Wang, H., Takemiya, A., Song, C.P., Kinoshita, T., and
ylation of Thr-948 at the C terminus of the plasma membrane H+-
Shimazaki, K. (2004). Inhibition of blue light-dependent H+ pumping
ATPase creates a binding site for the regulatory 14-3-3 protein. Plant
by abscisic acid through hydrogen peroxide-induced dephosphory-
Cell 11: 2379–2391.
lation of the plasma membrane H+-ATPase in guard cell protoplasts.
Szabo, A., Korszun, R., Hartl, F.U., and Flanagan, J. (1996). A zinc
Plant Physiol. 136: 4150–4158.
finger-like domain of the molecular chaperone DnaJ is involved in
Zhou, R.G., and Miernyk, J.A. (1999). Cloning and analysis of AtJ3
binding to denatured protein substrates. EMBO J. 15: 408–417.
gene in Arabidopsis thaliana. Acta Bot. Sin. 41: 597–602.
Tamura, K., Takahashi, H., Kunieda, T., Fuji, K., Shimada, T., and
Zhu, J.K., Bressan, R.A., and Hasegawa, P.M. (1993). Isoprenylation
Hara-Nishimura, I. (2007). Arabidopsis KAM2/GRV2 is required for
of the plant molecular chaperone ANJ1 facilitates membrane associ-
proper endosome formation and functions in vacuolar sorting and
ation and function at high temperature. Proc. Natl. Acad. Sci. USA 90:
determination of the embryo growth axis. Plant Cell 19: 320–332.
Chaperone J3 Regulates the Plasma Membrane H
-ATPase through Interaction
with the PKS5 Kinase
Yongqing Yang, Yunxia Qin, Changgen Xie, Feiyi Zhao, Jinfeng Zhao, Dafa Liu, Shouyi Chen, Anja T.
Fuglsang, Michael G. Palmgren, Karen S. Schumaker, Xing Wang Deng and Yan Guo
PLANT CELL published online Apr 23, 2010;
DOI: 10.1105/tpc.109.069609
This information is current as of April 25, 2010
THE PLANT CELL
Sign up for eTOCs for
CiteTrack Alerts
Plant Cell
Sign up for CiteTrack Alerts for
Subscription information for The Plant Cell
Plant Physiology
is available at:
American Society of Plant Biologists
ADVANCING THE SCIENCE OF PLANT BIOLOGY
Source: http://xuyue.co/pub/The%20Arabidopsis%20Chaperone%20J3%20Regulates%20the%20Plasma%20Membrane%20H%2B-ATPase%20through%20Interaction%20with%20the%20PKS5%20Kinase.pdf
This article appeared in a journal published by Elsevier. The attached copy is furnished to the author for internal non-commercial research and education use, including for instruction at the authors institution and sharing with colleagues. Other uses, including reproduction and distribution, or selling or licensing copies, or posting to personal, institutional or third party
NGUYEN THI NGOC PHUONG PROFESSOR TREATMENT OF MENOPAUSE: HORMONAL and NON-HORMONAL THERAPY Prof. NGUYEN THI NGOC PHUONG, MD. Vice President of Vietnam Asociation of Gynecologists and Obstetricians President of Ho Chi Minh City Society for Reproductive Medicine THE FRANCE - VIETNAM – ASIA PACIFIC CONFERENCE


