Microsoft word - tesi dottorato alessandra mangolini.doc
Università degli Studi di Ferrara
DOTTORATO DI RICERCA IN
BIOCHIMICA, BIOLOGIA MOLECOLARE
E BIOTECNOLOGIE
COORDINATORE PROF. ROBERTO GAMBARI
RNA INTERFERENCE FOR STUDYING THE ROLE OF
FIBROCYSTIN/POLYDUCTIN IN HUMAN
KIDNEY CELL LINES
DOTTORANDA
DOTT.SSA ALESSANDRA MANGOLINI
PROF.SSA LAURA DEL SENNO
XX° CICLO
ANNI 2005 - 2007
1. Tubules and associated diseases .1
2. Autosomal recessive polycystic kidney disease (ARPKD).3
2.1 Epidemiology of ARPKD .3
2.2 Renal and extra-renal clinical manifestations .5
2.3 The PKHD1 gene .7
2.4 Mutation in PKHD1 gene.9
2.5 Fibrocystin/polyductin (FC1), the PKHD1 gene product.12
2.6 Fibrocystin (FC1): Tissues expression and subcellular
localization .14
3. Animal models of ARPKD.18
3.1
Orpk mouse.18
3.2
Cpk mouse .19
3.3
Bpk mouse .20
3.4
Wpk rat.20
3.5
Pck rat.21
3.6
Ex40 mouse .22
3.7
Pkhd1del2/del2 mouse .22
3.8
Pkhd1del3-4/del3-4 mouse .23
4. Role of primary apical cilia in renal cystogenesis .24
4.1 Cilium structure .26
4.2 Cilium functions.27
4.3 Primary cilium.28
4.4 PKD proteins and primary cilia .30
4.5 FC1 and relation to the primary apical cilium .32
5. Hypothetic pathogenic mechanisms of FC1 .33
5.1 FC1 and cell-cell/matrix contact, cell adhesion .33
5.2 Transcriptional network of PKHD1 .34
5.3 FC1 and cystogenesis.36
5.3.1 Tubular morphogenesis .36
5.3.2 Cell proliferation.37
a) cAMP-mediated proliferation .37
b) EGF-mediated proliferation .39
c) Other involved mechanisms in cell proliferation.41
5.3.3 FC1 and apoptosis.42
5.3.4 FC1 and fluid secretion.44
5.4 FC1 and signaling .45
5.4.1 FC1 and proteolitic modifications.45
5.4.2 FC1 and protein interactions.49
5.4.3 FC1 and Calcium signaling .52
AIM OF THE THESIS .55
1. Cell cultures.56
2. Production of siRNA expressing vectors .56
3. Stable transfection of PKHD1 siRNA oligonucleotides .57
4. FC1 mRNA analysis .58
4.1 RNA extraction .58
4.3 PCR and Nested PCR.59
5. Western blotting analysis.60
5.1 Membrane preparation.60
5.2 Cellular total extract .60
5.3 Electrophoresis and immunoblotting .60
6. Cell proliferation and cell cycle analysis .61
7. Apoptosis analysis.62
7.1 Hoechst 33258 staining.62
7.2 Caspase 3 assay.62
8. Calcium measurements .63
8.1 Aequorin method.63
8.2 Fura 2AM Ca2+ measurement .63
9. NFAT and NFkB luciferase assay.64
10. NFkB localization assay.64
11. Statistical analysis .64
1. RT-PCR detection of PKHD1 RNA in human kidney HEK293 cells.65
2. Effect of stable suppression of two siRNA oligonucleotides for PKHD1
in HEK293 cells and 4/5 tubular epithelial .65
3. Functional analysis of HEK293 and 4/5 selected clones .70
3.1 Cellular effects of FC1 downregulation in HEK293
epithelial cells.
3.2 Cellular effects of FC1 downregulation in 4/5 tubular
epithelial cells.74
3.3 Cell cycle was impaired in FC1 deficient HEK293 and
4/5 tubular epithelial cells.76
3.4 Apoptosis was increased in PKHD1 suppressed clones .77
4. Calcium homeostasis in FC1 deficient cells.82
4.1 ATP-evoked calcium was increased in FC1 suppressed
4.2 Evoked calcium was higher in FC1 suppressed 4/5 cells.85
4.3 FC1 suppression does not affect Ca2+ oscillation in
5. Cell signalling in FC1 suppressed cell lines.88
5.1 ERK signaling was down regulated in FC1 (-) HEK293 cells .88
5.2 The regulator of cell cycle p21/WAF and p53 were not affected
by PKHD1 silencing in HEK293 cells .89
5.3 NFAT signalling was increased in FC1 deficient HEK293 cells.90
5.4 NFkB binding activity was deregulated in PKHD1 suppressed
5.5 NFkB-p65 localization in HEK293 cells .94
5.6 p65 (RELA) undergoes to increased turnover in FC1 (-)
5.7 Effects of parthenolide on cell survival and cell death in
HEK293 and 4/5 tubular epithelial cells.97
DISCUSSION .104
1. Tubules and associated diseases
Tubules are the fundamental units of the structure for many organs in the body. The
kidney is perhaps one of the best examples of an organ where tubular structure and
function are so closely linked. Under normal conditions, the glomeruli filter 20% of
cardiac output to produce approximately 180 l/day of filtrate. The renal tubules process
this bulk flow to reclaim essential electrolytes and nutrients while excreting unwanted
metabolic end-products and any excess salt, water or other electrolytes in a volume that
may be <1% of the original amount. Proper patterning of the tubule is essential for the
integrity of this process. Luminal diameter is another key parameter. Too large a lumen
could reduce the efficiency of filtrate processing and result in unregulated loss of
essential molecules while too narrow a lumen could result in high intraluminal pressures
with a subsequent rise in the hydrostatic pressure in Bowman's capsule and a decline in
glomerular filtration and clearance (Fig 1).
Figure 1. Rapresentation of the complex structure of the nephron, the unit that constitute the kidney.
Therefore, knowing the factors that regulate the control of luminal diameter and
determining the mechanisms by which they do so is fundamental to understanding
kidney function.
Numerous disorders share renal involvement with cysts as common features; inherited
renal cystic diseases constitute an important subset of these disorders and involve
single gene defects that are transmitted as autosomal dominant, autosomal recessive,
or X-linked traits.
Polycystic kidney disease (PKD) describes a heterogeneous collection of disorders that
differ significantly with respect to their etiology and clinical presentation. They share,
however, abnormal tubular morphology as a common feature, leading to the hypothesis
that their respective gene products may function cooperatively in a common pathway to
maintain tubular integrity. Autosomal dominant polycystic kidney disease (ADPKD) and
autosomal recessive polycystic kidney disease (ARPKD) are genetically distinct entities
that are clinically more dissimilar than alike.
ADPKD is common (affects approximately 1/1000), its cysts arise from any nephron
segment and it is slowly progressive resulting in renal failure in approximately 50% by
the sixth decade (Gabow PA, 1993). Hepatic cysts are its primary extra-renal
manifestation while cardiovascular abnormalities are less common but more life-
threatening (Fick et al, 1995). The disease results from mutation of either of two genes,
PKD1 and PKD2 (Eur PKD consortium, 1994; Mochizuki et al, 1996). The two forms of
ADPKD are nearly indistinguishable with overlapping clinical features, differing only in
their severity. PKD1 encodes a large membrane protein that may function as an atypical
G-protein coupled receptor (Sandford et al, 1999). PKD2 encodes the founding member
of the transient receptor protein polycystin (TRPP) family of calcium channel proteins
(Mochizuki et al, 1996; Tsiokas et al, 1999; Montell, 2001). The two gene products,
polycystin-1 (PC1) and polycystin-2 (PC2), are thought to form a receptor channel
complex that localizes to the primary cilium (Nauli et al, 2003; Watnick et al, 2003). PC2
is also present in the endoplasmic reticulum (ER) where it may function as either a
calcium release channel or a regulator of the 1,4,5-trisphosphate receptor (IP3R) (Li et
al, 2005). Molecular genetic studies of human samples suggest that the disease is
recessive on a cellular level, likely explaining the focal nature of cyst formation and the
variable clinical presentation (Qian et al, 1996; Pei et al, 1999).
ARPKD, on the other hand, has an estimated incidence of approximately 1:20,000 live
births, presents primarily in infancy and childhood, and is typically more severe than
ADPKD (Zerres et al, 1998; Guay-Woodford LM and Desmond RA, 2003). The putative
gene, PKHD1, responsible for ARPKD was cloned only five year ago; the longest
predicted open reading frame is translated in the protein named polyductin or
fibrocystin1, predicted to be a type I membrane protein (Onuchic et al, 2002 and Ward
These observations suggest that the two different forms of PKD may share some
underlying pathogenic mechanisms. In support of this hypothesis, cystic kidneys of
rodent models of both forms of PKD are reported to have similar abnormalities in cAMP
activity and similar therapeutic benefit by treatment with V2-receptor antagonists
(Gattone et al, 2003; Torres et al, 2004a). The proteins encoded by each of the genes
implicated in these diseases have also been co-localized to the primary cilium (Nauli et
al, 2003; Watnick et al, 2003; Menezes et al, 2004; Kaimori et al, 2007; Ward et al,
2003). Finally, two recent studies have reported physical interactions between PC2 and
fibrocystin (FC1), mediated by kinesin-2 (Wu et al, 2006; Wang et al, 2007).
Collectively, these findings suggest that their gene products may function cooperatively
to regulate tubular morphology.
2. Autosomal recessive polycystic kidney disease (ARPKD)
2.1 Epidemiology of ARPKD
Autosomal recessive polycystic kidney disease (ARPKD) has an estimated incidence
ranging from 1 in 6,000 to 1 in 55,000 live births, a morbidity of 1:20,000 and
approximately 1 of 70 individuals is a carrier of an ARPKD mutant allele (Zerres et al,
ARPKD is characterized by various combinations of bilateral renal cystic disease and
congenital hepatic fibrosis (Guay-Woodford LM and Desmond RA, 2003; Zerres et al,
In infancy, the disease results in significantly enlarged echogenic polycystic kidneys,
with pulmonary hypoplasia resulting from oligohydramnios as a major cause of
morbidity and mortality. Renal failure is rarely a cause of neonatal demise. Liver
involvement is detectable in approximately 45% of infants and is often the major feature
in older patients (Harris PC and Rossetti S, 2004).
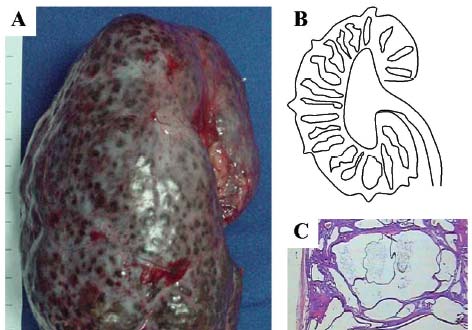
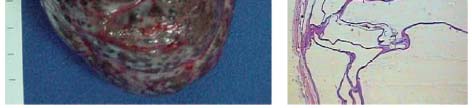
Figure 2. Renal pathology of autosomal recessive polycystic kidney disease. A) Kidney of a 2-year-old ARPKD-affected child. Macroscopically, the organ displays multiple small cysts on its surface and is severely enlarged, measuring 15 cm in its longitudinal axis. B) Drawing representing the diffuse and radial distribution of dilated collecting ducts throughout the cortex and medulla. C) ARPKD renal histology, showing dilatation of collecting ducts.
In ARPKD patients surviving the neonatal period, the prognosis is more optimistic.
Advances in neonatal intensive care and renal replacement therapies have improved
the survival rates of ARPKD patients, with some of them reaching adulthood. However,
life expectancy is severely diminished and a wide range of associated comorbidities
often evolve, including systemic hypertension (HTN), endstage renal disease (ESRD),
and clinical manifestations of congenital hepatic fibrosis (CHF) (Roy et al, 1997).
ARPKD is invariably associated with biliary disgenesis and the Caroli's disease is often
Recent study indicates a broadened spectrum for the ARPKD phenotype and indicated
that cases with predominant liver disease should be considered part of ARPKD (Adeva
All typical forms of ARPKD, including perinatal and late onset, result from mutation at a
single locus PKHD1 (polycystic kidney and hepatic disease 1), localized on human
chromosome 6p21.1-p12 (Onuchic et al, 2002; Ward et al, 2002).
2.2 Renal and extra-renal clinical manifestations
ARPKD was first recognized as a distinct morphologic form of cystic disease in 1902
(Osathanondh V and Potter EL, 1964a).
Blyth and Ockenden in 1971 classified ARPKD into four distinct phenotypes (perinatal,
neonatal, infantile and juvenile) on the basis of the clinical manifestations and the age of
presentation. The classification focused on the wide spectrum of renal collecting ducts
and biliary ductal plate abnormality. These ranged from nephromegaly and the
olygohydramnios sequence with minimal biliary manifestation (perinatal) to severe
portal hypertention with minimal renal cystic disease (juvenile) (Sweeney WE and Avner
Despite the variable clinical spectrum of ARPKD, the majority of patients are identified
either in utero or at birth (Dell et al, 2004; Guay-Woodford LM and Desmond RA, 2003).
The most severely affected fetuses have enlarged echogenic kidneys and display a
"potter" oligohydramnios phenotype with pulmonary hypoplasia, a characteristic facies,
and contracted limbs with clubfeet (Roy et al, 1997). The only signs potentially
detectable in utero are enlargement and increased echogenicity of both kidneys.
Improved respiratory treatment leads to increase neonatal survival, but death still
occurs in the neonatal period in approximatively 25%-30% of affected individuals
primarily because of respiratory insufficiency (Kaplan et al, 1989; Roy et al, 1997).
The ARPKD renal histopathology is characterized by bilateral and symmetric
involvement. The kidney can be massively enlarged, reaching up to 10-fold its original
size, with multiple 1-2mm cysts on its surface. Unlike ADPKD, the cystic kidneys retain
their reniform shape and the cysts are fusiform dilatations mainly of the collecting ducts
that radiate from the renal papilla to the cordex (Osathanondh V and Potter EL, 1964b).
The fusiform dilated collecting ducts are lined by undifferenziated epithelium and
surrounded by abnormal deposition of extracellular matrix (Bernstein J and Slovis TL,
1992; Dell et al, 2004; Osathanondh V and Potter EL, 1964b). In detail, the cystic
epithelium is composed of a uniform, single cell, and cuboidal layer. Cystic tubules are
virtually always derived from collecting ducts and communicate freely with their
corresponding non-cystic tubule segments. From 10% to 90% of the collecting ducts are
affected, resulting in wide variability of renal dysfunction.
The hepatic histopathology is characterized by ductal plate malformation. The portal
tract often retains its original embryonic architecture, with small, distorted bile ducts
located at the periphery of the portal space. Portal ducts eventually become tortuous
and cystic, encircled by variable degree of fibrosis. When larger biliary ducts are also
dilated, the disorder is called Caroli's disease. In some cases, cholangitis leads to a
gradual replacement of the immature ducts by fibrosis, resulting in a condition known as
hepatic fibrosis. The association of hepatic fibrosis with Caroli's disease is called
Caroli's syndrome (Menezes LF and Onuchic LF, 2006).
Approximately 50% of affected individuals progress to end stage renal disease (ESRD)
within the first decade of life. (Roy et al, 1997). Modern neonatal cares have improved
the 10-year survival rate of patients who survive the first year to 82%. The 15-year
survival rate is estimated to be 67%-79% (Dell K and Avner E, 2003). In rare cases,
sequential or simultaneous liver-kidney transplants can be considered viable
therapeutic option (Davis et al, 2003). Hypertention may occur in up to 80% of children
with ARPKD, it is frequently severe and is generally correlated with decrease in renal
function. Therapies with an angiotensin converting enzyme inhibitors or ATII receptor
inhibitors are generally effective (Guay-Woodford LM and Desmond RA, 2003; Jafar et
al, 2005; Kaplan et al, 1989). Additional clinical complications include nephrogenic
diabetes insipidus, failure to thrive, and hyponatremia (Dell et al, 2004, Guay-Woodford
LM and Desmond RA, 2003; Zerres et al, 1996).
2.3 The PKHD1 gene
PKHD1 is a very large and complex gene, located on chromosome 6p21.1-p12 (Fig 3).
Figure 3. The PKHD1 gene is located on the short (p) arm of chromosome 6 at position 12.2. More precisely, the PKHD1 gene is located from base pair 51,588,103 to base pair 52,060,381 on chromosome 6.
It spans a genomic segment of over 469 kb and has a minimum of 86 exons,
assembled into multiple differentially spliced transcripts (Onuchic et al, 2002). A 67-
exon transcript, 12.6 kb long, encodes the gene's putative longest open reading frame
Figure 4. Structure of PKHD1 showing (top) the genomic structure and (bottom) the transcript. Black boxes indicate regions that are part of the longest open reading frame and open boxes the 50 and 30 UTRs. The gene has 67 exons and the human transcript is predicted to be 16,235 bp.
Northern blot analysis in human tissues revealed a broad and smeared signal,
consistent with the existence of multiple different-size transcripts. PKHD1 has its
highest level of expression in human fetal and adult kidneys, but lower levels were also
detected in pancreas and even lower levels in human fetal and adult liver (Onuchic et
The PKHD1 gene encodes a complex and extensive array of splice variants (Onuchic et
al, 2002). Notably, the alternative exons exhibit consensus donor and acceptor splice
sites, supporting the conclusion that these are legitimate transcripts. Although it is
presently unknown how many of the transcripts are actually translated into protein, the
complicated pattern of splicing is conserved in the mouse orthologous, indicating a
functional role for this property (Nagasawa et al, 2002). In the event that various
mRNAs are translated, it could mean that this single gene might encode numerous
distinct polypeptides differing in size and amino acid sequence. With current knowledge
on protein structure, if translated alternatively, spliced PKHD1 products could yield
proteins categorized into two broad groups. One group, which includes the longest
continuous ORF, but which may also include molecules lacking some middle domains,
has a single TM element and it is likely to be associated with the plasma membrane.
The other group lacks the TM domain and, thus, its members may be secreted
(Bergmann et al, 2004). In addition, it should be noted that a PKHD1 homologue, the
PKHDL1 gene, was recently identified and shown to share the complex splicing
property with PKHD1. While its putative longest ORF is equally expected to yield a
membrane-bound protein, the gene is predicted to encode membrane and soluble
products, including the secreted protein D86 (Hogan et al, 2003). These findings
strongly suggest biological relevance for the PKHD1-encoded soluble products. The
identified protein product encoded by PKHD1 has been called polyductin (Onuchic et al,
2002) or fibrocystin 1 (Ward et al, 2002).
The PKHD1 mouse orthologue, Pkhd1, was shown to conserve the basic features of its
human counterpart. It is a very large gene, extending over a 500kb genomic region, with
its putative longest ORF also encoded by a 67 exon transcript (Nagasawa et al, 2002).
It also presents a complex splicing pattern, giving rise to multiple transcripts. Northern
blot analysis showed that Pkhd1 is expressed in kidney and weakly in liver, heart,
stomach, intestine, muscle, uterus, and placenta. Interestingly, studies using two
different cDNA probes, derived from exons 5 and 41, revealed a small, 1 kb transcript
in the testis, detected exclusively with the exon 41-related probe (Nagasawa et al,
2002). In situ hybridization analyses in developing and adult mouse tissues showed
high levels of expression in renal tubular structures in the mesonephros, branching
ureteric bud and collecting ducts. Other structures in which Pkhd1 expression was
observed included developing biliary ducts, muscular wall of large vessels, primordial
testis, dorsal root ganglia, embryonic lung mesenchyme, pancreatic ducts, developing
trachea, and skeletal muscle. Similarly to the Northern blot results, in situ hybridization
studies revealed different splicing profiles in distinct tissue structures. Transcripts
expressed in the wall of large vessels, developing lung or trachea include exon 41 but
lack exon 5, while those present in kidney and liver comprise both exons (Nagasawa et
al, 2002). Interestingly, a genetically modified mouse lacking exon 40, which is part of
the longest Pkhd1 transcript expressed in kidney and liver, developed cystic biliary
dysgenesis but no morphologically abnormal kidney phenotype (Moser et al, 2005).
2.4 Mutation in PKHD1 gene
The molecular cloning of PKHD1 and determination of its genomic structure has led to
the identification of a wide variety of mutations in its coding regions. By now, a total of
135 different mutations on 301 mutated alleles have been described in six studies
(Onuchic et al, 2002; Ward et al, 2002; Bergmann et al, 2003, 2004; Furu et al, 2003;
Rossetti et al, 2003).
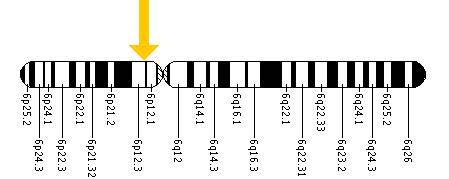
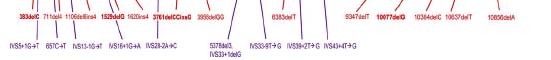
Figure 5 indicates the relative location of each mutation along a linear representation of
the protein and shows that changes are dispersed over its entire length. This broad
distribution of gene mutations suggests that the longest ORF transcript is necessary for
proper fibrocystin/polyductin function in kidney and liver. Thus, it might be proposed that
a critical amount of the full-length protein is required for normal function.

However, alternatively, it might be hypothesized that mutations disrupt a critical
functional stoichiometric or temporal balance between the different protein products that
is normally maintained by elaborated, tightly regulated splicing patterns. Only one
mutation has been found thus far affecting the sequence that encodes the cytoplasmic
C-terminus, but the size of the segment is small and the dataset is still too limited to
allow any conclusions. Most of the changes detected are unique (‘‘private mutations''),
which is in agreement with many diverse haplotypes on ARPKD chromosomes (Zerres
et al, 1994, 1998).
Figure 5. The open reading frame of the PKHD1 transcript showing the locations of all published mutations. Above the transcript are shown missense changes (green) and below those predicted to truncate the protein, nonsense (light blue), frameshifting deletions and insertions (red), and splicing (purple).
Of all mutant alleles found in the 67 coding exons of the longest continuous ORF, more
than 50% are single nucleotide missense substitutions, about 30% are small deletions,
insertions, or duplications, approximately 20% contain nonsense mutations, and a few
mutations affect the canonical splice site sequences. Thus far, gross genomic
rearrangements (deletions/ insertions/ inversions), promoter alterations or mutations in
alternatively spliced exons not included in the longest ORF, have not yet been
encompassed into the analysis in most of the studies. In conclusion, about half of the
reported mutations have been either nonsense mutations or expected to cause a
frameshift with a downstream premature truncation/termination codon (PTC). Most of
the missense changes are non-conservative and found to replace residues conserved
in the murine fibrocystin1/polyductin orthologous. Missense mutations in portions
translated into putative IPT domains and PbH1 repeats are considerably less common
per nucleotide basis than those affecting other parts of the gene. Conclusively, these
regions might be functionally less important than some portions of the gene with so far
unassigned domains or motifs (Bergmann et al, 2004).
The most common mutation that was found in all studies is T36M, likely representing a
mutational hotspot. It occurs in a variety of populations with other frequent changes:
R496X, 5895insA, and 9689delA. Two of these seem specific for particular populations:
R496X, Finnish, and 9689delA, Spanish. The most common pattern of mutations in
ARPKD patients is two different changes (compound heterozygotes) (Onuchic et al,
2002; Ward et al, 2002; Bergmann et al, 2003; Furu et al, 2003; Rossetti at al, 2003).
Indeed, it is possible that some rare ‘‘polymorphisms'' may be mutagenic when found in
combination with an inactivating mutation. Of particular interest is the change T2869K
that has been described in one study as a polymorphism (Furu et al, 2003) (found in
4/120 normal individuals), and in another study as a possible mutation (Rossetti et al,
2003). In two cases with mild ARPKD exhibiting mainly a liver phenotype, this change
was found in combination with the mutations 9889delA or I2957T (Rossetti et al, 2003)
raising the possibility that this ‘‘polymorphic'' change, in combination with an inactivating
mutation, may result in mild ARPKD. The wide range of compound heterozygous
changes associated with ARPKD means that it has been difficult to determine clear
genotype/phenotype correlations. In different studies, affected families were categorized
by clinical presentation into ‘‘severe'' and ‘‘moderate.'' According to this classification,
the ‘‘severe'' cohort comprised families in which at least one affected child presented
with perinatal disease and neonatal demise, while the ‘‘moderate'' group included
families in which affected patients either survived complications during the first month of
life or first became symptomatic beyond the neonatal period. Analysis of the mutational
spectrum in the subgroups revealed that more than half of the mutations detected in the
severe group were truncating (57%). On the other hand, in the moderate cohort,
missense changes were more than two times as frequent as chain-terminating
alterations. However, one trend that can be identified is that two truncating mutations
are associated with severe disease, defined as death in the perinatal period. Put
another way, missense mutations are associated with a milder presentation of ARPKD
(Furu et al, 2003). This indicates that some missense changes do not entirely inactivate
the product, but generate a hypomorphic allele. Alternatively, some substitutions may
only disrupt some splice forms of PKHD1 so that functional variants are still generated,
resulting in milder disease. This variable mutation detection level, plus the large gene
size, possible alternative splicing and marked allelic heterogeneity, make gene-based
clinical diagnostic testing for this disorder a challenge.
2.5 Fibrocystin/polyductin (FC1), the PKHD1 gene product
Fibrocystin/polyductin (FC1) is predicted to be a large protein, 4074 aa (4059 aa in
mouse) with a signal peptide, large extracellular region (3860 aa), a single
transmembrane domain and a short cytoplasmic tail (192 aa) (Onichic et al, 2002; Ward
et al, 2002) (Fig 6).
Figure 6. Predicted structure of FC1, a large integral membrane protein, 4074-amino-acid The structure of FC1 as an integral membrane protein with a large extracellular portion and a short intracellular C-terminal suggest that this protein acts as a transducer of extracellular information into the cell by eliciting signal transduction cascades resulting in the modulation of gene transcription.
A splice variant that encodes a truncated protein lacking the transmembrane segment
has also been identified and may encode a secreted form of the protein. However, it is
possible that splice forms of PKHD1 generate alternative proteins, including possible
secreted products (Onuchic et al, 2002). FC1 is a novel protein although it shares
homologies to several domains of known proteins, including 12 TIG/IPT
(immunoglobulin-like fold shared by plexins and transcription factors) or TIG-like
domains in the extracellular region (Fig 6). This domain has 80–100 aa and is found in
several receptor molecules, including Met, various plexins, and Ron, although the large
number of domains seems unique to the fibrocystins (Ward et al, 2002; Hogan et al,
2003; Bork et al, 1999). Another significant region of homology found twice in FC1 is
shared with two human proteins of unknown function, TMEM2 and XP051860, and a
hypothetical protein from the filamentous bacteria Chloroflexus aurantiacus (Ward et al,
2002; Hogan et al, 2003; Scott et al, 2000). Several parallel b-helix (PbH1) repeats
have also been identified in FC1, many overlapping with the TMEM regions of
homology (Onuchic et al, 2002; Nagasawa et al, 2002). PbH1 repeats are present in
virulence factors, adhesins, and toxins in bacterial pathogenesis and known to bind to
carbohydrate moieties (Cowen et al, 2002). In case of FC1, targets for binding could
include glycoproteins on the cell surface or in the basement membrane.
The novel domain G8 is present in tandem copies, probably originated from tandem
duplication. This novel domain contains eight conserved glycine residues, its structure
reveals five beta-strand pairs and may be involved in extracellular ligand binding and
catalysis. It is also present in the N-terminus of some non-sindroming hearing loss
disease-associated proteins such as KIAA1109 and TMEM2 (He et al, 2006). It has
been reported that nine missense mutations in the two G8 domains of human PKHD1
protein resulted in a less stable protein and are associated with ARPKD (Bergman et al,
2004; Rossetti et al, 2003; Ward et al, 2002). The external region also contains 64
potential N-glycosylation sites, suggesting that the protein may be highly glycosylated.
In addition, FC1 short carboxylic tail includes putative cAMP/cGMP-dependent protein
kinase phosphorilation sites (PKA and PKC) (Ward et al, 2002).
The function of FC1 is not known, but the structure and homologies suggest a role as a
receptor protein possibly involved in modulating the terminal differentiation of collecting
ducts and the biliary system. When FC1 was initially identified, there were no known
closely related proteins, but recently a fibrocystin-like protein, fibrocystin-L, has been
described, establishing a FC1 protein family (Hogan et al, 2003). The protein is
encoded by the gene PKHDL1 from chromosome region 8q23. Fibrocystin-L (4243 aa;
466 kDa) has homology throughout the extracellular region to FC1 with overall identity
of 25% and similarity of 41.5%. Despite the similarity of this protein to FC1, mutation
analysis indicated that it is not associated with ARPKD and, indeed, expression studies

suggest a possible role in cellular immunity with up-regulation in activated T-cells
(Hogan et al, 2003). Comparative analysis with the fish Takifugu rubripes showed the
presence of a PKHDL1 ortholog, but not one for PKHD1, suggesting that fibrocystin-L
may be the ancestral member of this protein family (Hogan et al, 2003).
Comparative alignment analysis of protein structure shows that mouse Pkhd1 protein
product have very similar properties to its human orthologue protein, demonstrating that
key features of human FC1 are highly conserved in the mouse (Nagasawa et al, 2002)
Figure 7. Comparative analysis of mouse and human FC1. Schematic representations of the various domains and motifs of human and mouse FC1 are presented on top. Individual domains of the proteins from the two species were compared using the SIM Alignment Tool for Proteins, and the output is graphically represented at the bottom. "Unpredicted PbH1 domain" identifies a region of FC1 with high sequence identity between the two species that was identified as a likely PbH1 domain by SMART in one species and not in the other.
2.6 Fibrocystin (FC1): Tissues expression and subcellular localization
To illuminate its properties, the spatial and temporal expression patterns of FC1 were
determined in mouse, rat, and human tissues by using polyclonal and momoclonal
antibodies recognizing various specific regions of the gene product. Ward and
collaborators have described monoclonal antibodies including that for the C-terminal tail
of the protein (Ward et al, 2003). These mAbs see a high molecular weight product
(>450 kDa), plus a weaker 200 kDa protein, in human and rodent kidney; similar
products are also seen at a lower level in liver. Immunohistochemistry analyses
revealed staining of cortical and medullary collecting ducts and thick ascending limbs of
Henle in kidney and biliary and pancreatic duct epithelia (Menezes et al, 2004). In
human fetus and mouse developing tissues, staining was observed in the branching
ureteric bud but not in the metanephric mesenchyme, S-shaped bodies or glomeruli
(Menezes et al, 2004; Ward et al, 2003). During embryogenesis in mice, FC1 is also
expressed in other epithelial derivatives, including neural tubules, gut, pulmonary
bronchi, vascular system, and hepatic cells. Liver analysis revealed a positive signal in
intra- and extra-hepatic biliary ducts, pancreatic ducts and salivary gland ducts from
mouse embryos. Notably, a non-overlapping staining pattern in pancreas and salivary
gland acini with antibodies against different portions of FC1 was consistent with the
existence of structure-specific translated products (Menezes et al, 2004). Other stained
tissues were pancreatic ducts and islets, seminiferous tubules of the testis and the
epididymal duct (Ward et al, 2003).
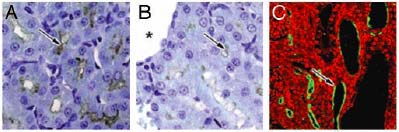
In samples of ARPKD tissues all FC1 products were absent, indicating that the disease
state is associated with loss of the protein. In the kidneys of the pck rat, the rat model of
which is genetically homologous to human ARPKD, the level of PKHD1 was
significantly reduced but not completely absent, probably indicating the presence of a
nonsense mutations or an ORF shift (Fig 8).
Figure 8. PKHD1 expression in the pck rat kidneys. A) The cortex region of rat kidney from 4-wk-old WT animals results in positive labeling in cortical proximal tubules and collecting ducts for FC1 staining. B) A dramatic reduction in PKHD1 labeling was seen in pck rat kidneys (arrows, A and B). Asterisk marker B indicates a renal cyst. Confocal microscopy clearly shows that PKHD1 remains in pck rat kidneys, and some were seen in epithelia of renal cysts or dilated tubules (arrow, C)
The functional role of the PKHD1 expression in these tissues is uncertain; however, its
early expression suggests it may be involved in primary tubule morphogenesis
(Nagasawa et al, 2002).
Several studies have shown that at the subcellular level FC1 is expressed in primary
apical cilia in kidney cells and cholangiocytes (Menezes et al, 2004; Ward et al, 2003;
Wang et al, 2004; Zhang et al, 2004; Masyuk et al, 2003). Immunoreactive FC1
localized at the apical domain of polarized epithelial cells, suggesting it may be involved
in the tubulogenesis and or maintenance of duct–lumen architecture. FC1 is localized at
the apical membrane in collecting duct cells and in the cytoplasm of inner medullary
collecting duct (IMCD) cells grown in culture. These observations suggest that, in
addition to its participation in ciliary function, the protein has functional roles in other
subcellular domains (Menezes et al, 2004). FC1 also stained in the basal bodies of the
primary cilia in cultured renal cells and to the roots of microvilli in the terminal web of
renal tubular epithelium. FC1 was expressed in primary ductal epithelial cells of
primordial tubules of the CNS, pulmonary, and gastrointestinal systems. Cells within
these specified regions generally contain motile cilia (O'Callaghan et al, 1999). It is
therefore conceivable that FC1 expression is not limited to primary cilia but is also
expressed in motile cilia.
Figure 9. PKHD1 is associated with the basal bodies primary cilia in cultured renal cells. A) costaining of cultured HEK293 cells for anti-FC1mAb (green) and F-actin (red). Cultured MDCK cells and IMCD3 cells (arrow, D) were stained with anti-FC1 mAb (red) and YO-PRO, a dye for nucleic acids (green). Positive stained cilia-shaped structures (red) can be seen clearly in each cell (arrows, B, C and D). In E, PKHD1 immunoreactivity is concentrated at the basal body, the cytoplasmic surface of the apical plasmalemma (right arrow, E), and the cores of microvilli (left arrow, E). The image (H) clearly shows PKHD1 (green) (G) localized at ciliary transition zone across the apical surface (F) stained by Rhodamine–phalloidin (red) in cultured MDCK cells. Costaining for FC1 and PC2 is indicated in (I–K, top view; L–N, lateral view); PKHD1 and polycystin-2, respectively, are colocalized at the basal bodies of primary cilia of cultured MDCK cells (arrows, K and N).
In cultured renal cells, the PKHD1 gene product co-localized with polycystin-2, the gene
product of autosomal dominant polycystic disease type 2, at the basal bodies of primary
cilia. The overlapping spatial distribution of FC1 and the polycystins implies that FC1
may associate with a common pathway that alters ciliary function and cation channel
activity (Fig 9).
In summary, FC1 is a membrane-associated protein, exhibits a tissue-specific
expression pattern and appears to be developmentally regulated. In addition, PKHD1 is
widely expressed in a diverse ductal structure from several organs and tissues,
consistent with its involvement in primary duct formation (Zhang et al, 2004).
The cartoon in Figure 10 summarises the subcellular localization of FC1 and its
possible multimeric association with other cystoproteins in the epithelial cell.
Figure 10. PKD proteins in multimeric complexes. Summary of recent advances suggesting that cystoproteins exist in multimeric protein complexes and function at distinct sites within epithelial cells that include: basal cell-matrix focal adhesion sites to regulate epithelial cell adhesion and migration; apical-lateral cell-cell adherens sites to regulate differentiated cell shape; within Golgi; apical-central ciliary sites to sense flow and regulate tubule diameter. Expression and signaling from multiple sites establish signaling platforms and feedback loops that regulate cell growth, proliferation, differentiation, and de-differentiation. (AJ adherens junction, TJ tight junction)
3. Animal models of ARPKD
Elucidation of the pathogenic mechanisms of ARPKD has been aided by the availability
of several animal models. Rodent models have arised by spontaneous mutations,
random mutagenesis, transgenic technologies or gene-specific targeting.
3.1 Orpk mouse
The first mouse model of ARPKD, orpk mouse (Oak Ridge Polycystic Kidney), was
created by insertional mutagenesis (Moyer et al, 1994). Homozygous mutant orpk mice
develop renal collecting duct cysts, biliary dysplasia, and portal fibrosis and usually die
within the first week of life. The gene that is mutated in orpk mice encodes a novel
protein, named polaris, which contains multiple tetratricopeptide repeats that may be
involved in protein-protein interactions (Murcia et al, 2000). Polaris, the Tg737 gene
product, is expressed in ciliated cells and localizes to the ciliary axoneme and basal
bodies (Taulman et al, 2001).
Most cells in the kidney express polaris, and the protein has also been localized to the
primary cilia of cultured MDCK cells. In orpk mutant mice, the primary cilia in the renal
collecting ducts are severely stunted (Pazour et al, 2000). The function of polaris has
been elucidated by studies of homologous proteins in the nematode C. elegans and the
green algae Chlamydomonas. Subsequent studies have revealed that polaris is also
localized to intraflagellar transport (IFT) particles and is required for ciliogenesis in C.
elegans and kidney cells (Qin et al, 2001; Haycraft et al, 2001; Yoder et al, 2002a).
3.2 Cpk mouse
The cpk mouse is the well-characterized naturally occurring recessive mouse model of
polycystic kidney disease (Avner et al, 1987). Homozygous cpk mutant mice develop
kidney cysts beginning late in gestation and succumb to renal failure within 4 to 5 weeks
after birth. Hou et al. (2002) identified Cys1, the cpk gene by positional cloning and
found that it encodes a 145-amino acid protein that is expressed primarily in the kidney
and liver, which they named cystin. The structure of cystin is novel and not similar to
any proteins in the database. However, the protein contains two potential N-
myristoylation sites that could anchor it in the membrane. When epitope tagged cystin is
expressed in cultured collecting duct cells, the protein localizes to the primary apical
cilia. At higher magnification, cystin can be found along the ciliary axoneme but does
not appear to be expressed in the basal body from which the cilium originates. This
model, however, is suitable for genetic and phenotypic study of cyst formation. Infact,
the role of the calcium-independent β-galactosidase binding lectin, Galectin-3 was
investigated in this model. Galectin-3 protein expression was compared to other ureteric
bud/collecting duct lineage markers, appearing to be widespread in cystic epithelia.
Exogenous galectin-3 induced a reduction in cyst formation in suspension culture of
cells from cpk mice, and mice null mutant for galectin-3 had more extensive renal cysts
in vivo. Finally, altered galectin-3 distribution induced after administration of the anti-
cyst drug paclitaxel consistent with increased galectin-3 secretion and expression of this
protein in the primary cilium/centrosome, raise the possibility that galectin-3 may act as
a natural brake on cystogenesis in cpk mice, perhaps via ciliary roles (Chiu et al, 2006).
3.3 Bpk mouse
The bpk model, a murine model of ARPKD, arose as a spontaneous mutation in an
inbred colony of Balb/c mice. This model has been characterized extensively and
maintained for 8 years without significant phenotypic drift. Homozygous bpk mice
develop massively enlarged kidneys and die of renal failure at an average postnatal age
of 24 days. Affected homozygous animals typically die 1 month postnatally in renal
failure with progressively enlarged kidneys (Nauta et al, 1993; Nauta et al, 1995).
Renal cysts shift in site from inner cortical proximal tubules at birth to collecting tubules
20 days later. Increased numbers of mitosis were demonstrated in proximal and
collecting tubular cysts. In addition, epithelial hyperplasia was evidenced in the intra-
and extra-hepatic biliary tract of affected animals. The number of intra-hepatic biliary
epithelial cells was increased by 50% on postnatal day 5 and by 100% on postnatal day
25. Despite an increased frequency of "chaotic" portal areas in mice with renal cysts, no
intrahepatic cysts or shape abnormalities of the biliary lumen were detected.
Additionally there was non-obstructive hyperplastic dilatation of the extra-hepatic biliary
tract which was linked in all animals to the presence of renal cysts. The hyperplastic
abnormalities in both renal and biliary epithelium make this mouse strain a good model
for the study of the dual organ cellular pathophysiology of ARPKD.
3.4 Wpk rat
Like the mouse cpk and bpk models, the rat wpk model strongly resembles human
ARPKD. This mutation occurred spontaneously in an outbred Wistar strain. The mutant
locus wpk (Wistar Polycystic Kidneys) maps just proximal to the Cy locus on rat
chromosome 5. Homology mapping indicated that the rat wpk gene is distinct from the
human ARPKD gene, PKHD1, as well as from the rat Cy gene and the mouse cpk and
bpk genes.
Homozygous mutants developed nephromegaly, hypertension, proteinuria, impaired
urine-concentrating capacity, and uremia, resulting in death at 4 weeks of age. Early
cysts were present in the nephrogenic zone at embryonic day 19. These were localized
to differentiated proximal tubules, thick limbs, distal tubules, and collecting ducts. In
later stages, the cysts were largely confined to collecting ducts. Cilia are present and
apparent normal in the principal cells of the cystic collecting ducts. Although the renal
histopathologic features are strikingly similar to those of human ARPKD, wpk/wpk
mutants exhibited no evidence of biliary tract abnormalities (Nauta et al, 2000).
Extrarenal pathology occurs in the immune system (thymic and splenic hypoplasia) and
central nervous system (CNS; hypoplasia to agenesis of the corpus callosum with
severe hydrocephalus). This CNS pathology is similar to that described in three human
renal cystic syndromes: orofaciodigital, genitopatellar, and cerebrorenal-digital
syndromes (Gattone et al, 2004).
Recently, positional cloning of the Wpk gene suggested MKS3 as candidate gene,
TMEM67, one of three loci involved in Meckel-Gruber syndrome (Smith et al, 2006).
3.5 Pck rat
The pck rat, a spontaneous mutant, is described as a new rat model of ARPKD in 2001;
it is considered a suitable model for the investigation of hepatobiliary involvement in
ARPKD. It has an autosomal recessive mode of inheritance and it is characterized by
progressive kidney and liver cystic disease, plus intrahepatic bile duct dilatation (Lager
et al, 2001; Sanzen et al, 2001; Masyuk et al, 2003). ARPKD phenotype in pck model is
caused by mutation to orthologous genes, PKHD1/Pkhd1. In particular, a splicing
mutation IVS35-2A→T was found in pck rat (Sanzen et al, 2001; Bergman et al, 2003;
Ward et al, 2002). Multiple segmental and saccular dilatations of intrahepatic bile ducts
were first observed in rat fetuses at 19 days of gestation. The dilatation spread
throughout the liver and the degree of dilatation increased with aging. Gross and
histological features characterizing ductal plate malformation were common in the
intrahepatic bile ducts. Overgrowth of portal connective tissue was evident and
progressive after delivery. These features were very similar to those of Caroli's disease
with congenital hepatic fibrosis, shown in ARPKD (Sanzen et al, 2001). Disruption of
pkhd1 and than the lack of expression of FC1 in cholangiocytes of pck rat induces
abnormalities in cholangiocyte ciliary morphology and biliary cystogenesis (Masyuk et
3.6 Ex40 mouse
Moser and co-workers describe the first mouse strain, generated by targeted mutation
of Pkhd1 exon 40, the most abundant expressed in liver and kidney. Due to exon
skipping, Pkhd1ex40 mice express a modified Pkhd1 transcript and develop severe
malformations of intrahepatic bile ducts. Cholangiocytes maintain a proliferative
phenotype and continuously synthesize TGF-beta1. Subsequently, mesenchymal cells
within the hepatic portal tracts continue to synthesize collagen, resulting in progressive
portal fibrosis and portal hypertension. Fibrosis did not involve the hepatic lobules, and
did not observe any pathological changes in morphology or function of hepatocytes.
Surprisingly and in contrast to human ARPKD individuals, Pkhd1ex40 mice develop
morphologically and functionally normal kidneys. In conclusion, subsequent to formation
of the embryonic ductal plate, dysgenesis of terminally differentiated bile ducts occurs in
response to the Pkhd1ex40 mutation. The role of FC1 in liver and kidney may be
functionally divergent, because protein domains essential for bile duct development do
not affect nephrogenesis in this mouse model (Moser et al, 2005).
3.7 Pkhd1del2/del2 mouse
Recently two new models of ARPKD are created. The first, it is generated by by
targeting exon 2, the first coding exon of Pkhd1. This removes the start codon and the
signal peptide from the open reading frame of the cDNA. Homozygous Pkhd1del2/del2
mice were viable, fertile and exhibited hepatic, pancreatic, and renal abnormalities. The
biliary phenotype displayed progressive bile duct dilatation, resulting in grossly cystic
and fibrotic livers in all animals. The primary cilia in the bile ducts of these mutant mice
had structural abnormalities and were significantly shorter than those of wild-type (WT)
animals. The Pkhd1del2/del2 mice often developed pancreatic cysts and some exhibited
gross pancreatic enlargement. In the kidneys of affected female mice, there was tubular
dilatation of the S3 segment of the proximal tubule (PT) starting at about 9 months of
age, whereas male mice had normal kidneys up to 18 months of age. Inbreeding the
mutation onto BALBc/J or C57BL/6J background mice this phenotype is made worse in
females developing PT dilatation by 3 months of age. The PT dilatation seen in this
animal may mimic the very early stages of human ARPKD. These inbred mice will be
useful resources for studying the mechanisms underlying the pathogenesis of ARPKD
(Woollard et al, 2007).
3.8 Pkhd1del3-4/del3-4 mouse
The other new model is created by cre-mediated excision of exon 3-4 resulting in a
probable hypomorphic allele. Pkhd1del3-4/del3-4 developed a range of phenotypes that
recapitulate key features of the human disease. Like in humans, abnormalities of the
biliary tract were an invariant finding. Most mice 6 months or older also developed renal
cysts. Subsets of animals presented with either perinatal respiratory failure or exhibited
growth retardation that was not due to the renal disease. To test for genetic interaction
between Pkhd1 and Pkd1, the mouse orthologue of the gene most commonly linked to
human autosomal dominant PKD a double knockdown is created. Pkd1+/-; Pkhd1del3-4/del3-4 mice had markedly more severe disease than Pkd1+/+; Pkhd1del3-4/del3-4 littermates. All double mutants died before reaching the ninth month of life. Kidney volumes of the
double mutants were more than 50% larger than those of the severely cystic Pkhd1del3-4
homozygotes. In all cases examined, the more severe phenotype appeared to be an
accentuation of the underlying ARPKD phenotype rather than a super-imposition of
Pkd1-mutant abnormalities. These model are the first to show genetic interaction
between the major loci responsible for human ADPKD and ARPKD in a common PKD
pathway; the authors' data strongly support the hypothesis that their respective gene
products function cooperatively in a common pathway to maintain tubular integrity
(Garcia-Gonzales et al, 2007).
4. Role of primary apical cilia in renal cystogenesis
Recent studies have yielded an entirely unexpected insight that is structural and/or
functional defects in the centrosome and/or in the associated primary apical cilium play
a major role in the pathogenesis of cystic disease. In general, the pathogenesis of this
disorders has been well defined, however, the cellular and molecular processes that
underlie cyst formation and expansion are not understood. Data from literature indicate
that most, if not all, human and mouse ‘cystoproteins' are associated with the primary
cilium and/or the centrosome (Tab 1).
Table 1. Renal cystic disease: associated gene and protein products
Specifically, the polycystins (ADPKD), polyductin/fibrocystin (ARPKD), the
nephrocystins (NPHP), and two of the BBSs (Barted-Biedl syndrome) proteins localize
to the primary apical cilium, while eight of the other BBSs and the orofacial digital
syndrome type 1 protein (OFD1) co-localized with centrosomal structures (Hildebrandt
F and Otto E, 2005; Badano et al, 2005) (Fig 11).
Figure 11. Subcellular localization of cystoproteins. Many cystoproteins have been localized to more than one intracellular domain. There are two exceptions: (i) polycystin-2 has been reported to have endoplasmic reticulum–specific functions as a calcium release channel that are independent of polycystin-1 and (ii) at least one form of inversin has been localized to the centriole and to the nucleus. The speckled arrow in the primary cilium indicates the direction of anterograde transport along the microtubule system mediated by kinesin-II, a heterotrimeric protein composed of two motor units (Kif3a, Kif3b) and one non-motor unit (KAP3). AJ, adherens junction; BB, basal body; Cen, centriole; ER, endoplasmic reticulum; FAP, focal adhesion plaque; TJ, tight junction; PC-1, polycystin-1; PC-2, polycystin-2.
Because cilia are located on almost all polarized cell types of the human body, cilia-
related disorders "ciliopathies" can affect many organ systems. Ciliopathies can either
involve single organs or can occur as multisystemic disorders with phenotypically
variable and overlapping disease manifestations (Badano et al, 2006).
In addition, analysis of various murine (mouse and rat) models that closely mimic the
human renal diseases has provided further evidence that primary cilia and/or the
centrosome play central roles in renal cystic disease pathogenesis. It suggest that the
cilia serve as an organizing centre of the early steps of signal transduction pathways
that are responsible for monitoring the integrity of the nephron and bile ducts and
partecipate in regulating epithelial proliferation and differentiation.
4.1 Cilium structure
Cilia are microtubule-based hair-like organelles that extend from the surface of almost
all cell types of the human body. Although these highly conserved structures are found
across a broad range of species, a nearly ubiquitous appearance is observed only in
vertebrates. Cilia can be structurally divided into sub-compartments that include a basal
body, transition zone, axoneme, ciliary membrane and the ciliary tip. Most cell types
assemble only one cilium (a monocilium or primary cilium), whereas some cells build
cilia bundles that consist of 200–300 individual organelles (multiple cilia). In contrast to
other cell organelles, cilia are only assembled when cells exit the cell cycle from mitosis
into a stationary or quiescent and/or differentiated state; and viceversa, entry into the
cell cycle is preceded by ciliary resorption (Quarmby LM and Parker JD, 2005). Cilia are
highly complex structures that comprise >650 proteins and they are classified in motile
or immotile (Fig 12).
The formation of cilia requires the targeting of specific proteins to the basal body area
where pre-assembly of axonemal substructures (such as outer dynein arms) occurs
(Fowkes ME and Mitchell DR, 1998). The transport of proteins and multiprotein
precursors across the ciliary compartment border and along the length of the axonemes
to their functional assembly site is dependent on intraflagellar transport (IFT)
(Rosenbaum JL and Witman GB, 2002).
Proteins are loaded onto the IFT particles at the ciliary base within the cytoplasm and
transferred across the ciliary compartment border in a process known as
compartmentalized ciliogenesis (Avidor et al, 2004).
Four cilia types have been identified in humans and all have been associated with
human disease: motile 9+2 cilia (such as respiratory cilia, ependymal cilia); motile 9+0
cilia (nodal cilia); non-motile 9+2 cilia (kinocilium of hair cells) (Dabdoub A and Kelley
MW, 2005); and non-motile 9+0 cilia (renal
Figure 12. Schematic representation of cilium structure
monocilia, photoreceptor-connecting cilia). Although the basic structure of the different
types of cilia is obviously similar, they exert various tissue specific functions during
development, tissue morphogenesis and homeostasis (El Zein et al, 2003; Ibanez-
Tallon et al, 2003; Satir P and Christensen ST, 2007).
4.2 Cilium functions
The existence of different cilia types indicates that this organelle is likely to have
numerous functions.
Ciliary motility is required to move extracellular fluid: the motile 9+0 monocilia at the
embryonic node generate an extraembryonic fluid flow (nodal flow) that is required to
determine embryonic left–right asymmetry (Nonaka et al, 1998). Motility of the multiple
9+2 cilia of respiratory epithelial cells is responsible for mucociliary clearance.
Analogously, the multiple 9+2 ependymal cilia mediate ependymal flow (Ibanez-Tallon
et al, 2004). Furthermore, flagellar motility is required for sperm cells to propel through
the female reproductive system.
Functions of cilia that are not related to motility are thought to involve sensing of
environmental cues. Because cilia protrude from the cell surface, they might act as
antennae that receive signals from the periphery. The remote information may be
converted into signalling cascades that are initiated within the ciliary compartment and
then transduced to the cell body. Consistently, the ciliary membrane contains various
cilia-specific receptors, ion channels and signalling molecules. For example, flow-
induced passive cilia bending is required for mechanosensation of extracellular fluid
flow (for instance, tubular fluid, urine) (Praetorius HA and Spring KR, 2005). Recent
observations indicate that chemosensation, as well as signalling through receptor-
dependent pathways, the sonic hedgehog (sHH), platelet-derived growth factor receptor
(PDGFR) pathways or noncanonical Wnt (or planar cell polarity (PCP)) pathways, is
also mediated through cilia (Huangfu et al, 2003; Schneider et al, 2005; Ross et al,
4.3 Primary cilium
The primary cilium is a solitary cellular structure present in most cells in the body,
including both ductal and non-ductal epithelial cells, endothelia, neurons, mesenchymal
cells, fibroblasts, chondrocytes, and osteocytes.
As previously mentioned, recent research has discovery that primary cilia are far long
being a vestigial organell as once proposed; rather, they function as critical components
of signalling pathways that are involved in chemo-, photho-, and mechanosensation that
allow a cell to interact with and respond efficiently to its enviroment.
Figure 13. Diagrammatic representation of primary cilia. Each polarized renal epithelium has one cilium projecting from its apical membrane. Structurally, cilia can be divided into two main categories based on the presence of central pair of microtubules. Those with the central pair are called ‘‘9+2'' cilia, and those without are termed ‘‘9+0'' cilia. Primary cilia are classified as 9+0 ones.
This non-motile cilium is assembled during interphase of the cell cycle and originates
from a modified centriole, the basal body, which is constructed from one of the two
basal bodies that form the core of the centrosome (Badano et al, 2005). During
interphase, the centrosome serves as the microtubule-organizing centre (MTOC). Astral
arrays of microtubules are anchored at the centrosome and provide an intracellular
scaffold to direct the trafficking of vesicles and organelles, such as the Golgi apparatus.
This close association between the cilia and the centrosome has led to the speculation
that the cilium has a role in regulating cell cycle and other cellular processes such as
the ubiquitin–proteasome degradation pathway and cell migration (Badano et al, 2005)
Figure 14. Centrosome functions in interphase cells. The centrosomal complex plays several key roles: (1) templating the primary apical cilium; (2) serving as the MTOC; (3) regulating the cell cycle; (4) spatially organizing cellular organelles and vesicular transport; (5) orchestrating cellular processes such as the ubiquitin–proteosome degradation pathway and cell migration.
As long as the cell has a cilium, it is unable to proceed through mitosis until the cilium is
resorbed, freeing up the centriole for cell division. This is supported by the recent
association of cilia proteins with cancer and by the proliferative phenotype seen in cystic
kidney disease that result from disruption of several cilia-localized proteins (Esteban et
al, 2006; Lutz MS and Burk RD, 2006; Simons M and Walz G, 2006; Straughn et al,
2004; Ostrowski et al, 2002).
Althought the importance of this machine remains unknown, the finding that cilia length
is controlled by the addition or removal of tubulin at the cilia tip and that several proteins
involved in transcriptional responses concentrate in this region suggest a role in
regulating cilia signalling activity (Haycraft et al, 2005; Johnson KA and Rosenbaum JL,
1992). This may have implications in cystic kidney disease pathogenesis because
excessively long cilia or the absence of cilia has been associated with cyst development
(Pazour et al, 2000; Taulman et al, 2001; Yoder et al, 2002a; Brown N and Murcia NS,
4.4 PKD proteins and primary cilia
Several studies have shown that proteins codified by genes mutated in human
polycystic kidney diseases (PKD) and PKD animal models are expressed in the primary
cilium (Yoder et al, 2002b; Pazour et al, 2002).
The first link between PKD and cilia was through the orpk mouse model. The protein
defective in this model, polaris, is orthologous to intraflagellar transport proteins in
Chlamydomonas and null mutation is associated with left–right axis defects (due to loss
of nodal cilia) and the hypomorphic mutant Tg737orpk has shorted cilia (Pazour et al,
2000; Murcia et al, 2000; Taulman et al, 2001). The proteins defective in the inv and
cpk, two other PKD animal models are also localized to cilia and a conditional knockout
that disrupts a ciliary motor subunit in collecting ducts, lacks cilia and develops cysts
(Hou et al, 2002; Watanabe et al, 2003; Lin et al, 2003; Yoder et al, 2002a).
In tubular epithelial cells, primary cilia, extending into the lumen, may have a
mechanosensory role or a function as a tubule size sensor (Praetorius HA and Spring
KR, 2001; Nauli et al, 2003; Lubarsky B and Krasnow MA, 2003) (Fig 15). So, changes
in fluid flow are detected by cilia and result in an increase in the level of intracellular
Ca2+ (Praetorius HA and Spring KR, 2001).
The link between PKD protein localization and mechanosensory role of primary cilia
induce to hypothesize that ADPKD proteins (PC1 and PC2) may partecipate in sensing
fluid shear stress. In fact, Pkd1 knockout ephitelial cells from the collecting ducts failed
to respond to fluid flow stimulation (Nauli et al, 2003).
Figure 15 Model of mechanosensation and control of differentiation of tubular epithelium by urine flow and calcium fluxes. The unbalance of these pathways probably led to the characteristic cell phenotype observed in ADPKD.
Wilde-type cells preincubated with a PC2 antibody rised against an extracellular loop of
PC2 also lost their Ca2+ response to flow, presumably by inactivation of the PC2
channel. Similarly, an antibody to an extracellular epitope of PC1 abolished the flow-
induced Ca2+ response. Application of antibodies to the intracellular domain of either
PC1 or PC2 had no effect on flow-stimulated response (Nauli et al, 2003).
The abnormal intracellular calcium homeostasis and probably other not well-defined
mechanisms led to a switch from a well-differentiated non-proliferative reabsorptive
epithelia to a partially de-differentiated, secretory epithelia characterized by polarization
defects and high rates of proliferation and apoptosis (Dell et al, 2004; Harris PC and
Rossetti S, 2004; Murcia ET AL, 1999; Wilson PD, 2004 a & b; Sweeney WE and Avner
ED, 2006) (Fig 16).
Figure 16. Cellular phenotypic abnormalities caused by PKD mutations. Wild-type epithelial cells are well differentiated, polarized and reabsorptive cells, and have low rates of division and apoptosis. By contrast, epithelial cel s harboring PKD mutations are characterized by de-differentiation, abnormal trafficking and targeting of proteins, polarization defects, high rates of division and apoptosis, and fluid transport abnormalities (secretory phenotype and decreased concentrating capacity).
4.5 FC1 and relation to the primary apical cilium
The precise role of FC1 on the cilia remains to be determined. It has been suggested
that this localization pattern might support a role for FC1 in IFT, either carried to the tip
as cargo or as part of the IFT protein complex (Wang et al, 2004). Furthermore, this
localization pattern seems to be independent of polycystin-1, since the FC1 expression
profile is not altered in Pkd1 null/null cells (Wang et al, 2004). A recent study has
suggested that calcium-modulating cyclophilin ligand (CAML) is a FC1 binding partner
by interacting with its carboxyl tail (Nagano et al, 2005). Interestingly, both proteins are
shown to co-localize in the primary cilia, basal body and apical membrane of distal
nephron cells. Since CAML is a calcium signaling-related protein, these results suggest
that FC1 may also contribute to the modulation of intracellular calcium. Moreover,
antibodies directed against an extracellular epitope of FC1 also abolish the Ca2+
response to flow stimulation (Wang et al, 2004)
FC1 is apparently important for normal ciliary morphology. Analyzing microdissected
cholangiocytes isolated from rat livers, Masyuk and co-workers (Masyuk et al, 2003)
demonstrated that cilia are shorter and dysmorphic in pck rats. In addition, these
investigators showed that cholangiocytes treated with Pkhd1 siRNA had smaller cilia
that lacked FC1 expression. Further characterization of the pck liver phenotype
confirmed these findings, demonstrating that cilia are malformed, with bulbous
extensions of the ciliary tip or ciliary axonemal membrane, heterogeneous in length and
on average significantly shorter than normal (Masyuk et al, 2004).
Recent work has shown that tubule morphogenesis is associated with cell mitotic
orientation along the tubular axis, revealing planar cell polarity (Fischer et al, 2006). In
parallel, these investigators demonstrated distortion in mitotic orientation in PKD animal
models. Pkhd1, in turn, has been shown to play a significant role in tubule
morphogenesis. Inhibition of its effects by shRNA disrupted tubular morphogenesis
induced in IMCD cell cultures, leading to abnormalities in cell proliferation, apoptosis,
cell-cell contact, and cytoskeleton (Mai et al, 2005). Based on these analyses, such
biological defects may be dependent on alterations of extracellular signal-regulated
kinase (ERK) and focal adhesion kinase (FAK)-mediated signaling.
5. Hypothetic pathogenic mechanisms of FC1
5.1 FC1 and cell-cell/matrix contact, cell adesion
Based on FC1 homology it was hypothesized that this novel protein was involved in
cellular adhesion and repulsion. In fact, FC1 shares some structural features with both
the Ron class of tyrosine kinase receptors and the plexin superfamily, and thus may
also function to regulate either cell-cell recognition or cell motility. However, the PKHD1-
gene product(s) lacks key structural elements of these protein classes, suggesting that
its mechanism of action will differ from that seen in the other classes. Moreover, the
presence of multiple PbH1 repeats in FC1 suggests a possible role for this molecule in
carbohydrate recognition and modification. Targets for binding could include
carbohydrate moieties present either in glycoproteins on the cell surface or in the matrix
of the basement membrane; interactions with FC1 may in fact modulate cell-cell or cell-
matrix attachments (Onuchic et al, 2002).
The establishment of intercellular junctions and normal cytoskeletal assembly is
essential for epithelial polarity and tubule formation (Higashiyama et al, 1995; Matter K
and Balda MS, 2003; Zegers et al, 2003). Recently, it was demonstrated that silencing
Pkhd1 alters the distribution of E-cadherin and impairs the formation of adherent
junctions; moreover, the inhibition of FC1 disturbed the normal cortical distribution of
actin cytoskeleton, resulting in lamellipodia formation, inducing epithelial to
mesenchymal transformation (EMT). These results indicate that lack of FC1 may also
affect the structure of tight junctions and alter the cytoskeleton in IMCD cells (Mai et al,
Because FC1 localizes at vicinity of the basal bodies (centriole system) and the primary
cilia (microtubule system) of epithelial cells (Masyuk et al, 2003; Ward et al, 2003;
Menezes et al, 2004; Wang et al, 2004; Zhang MZ et al, 2004), dysfunction of FC1 may
potentially disrupt the core pathway for cytoskeleton distribution/assembly and disable
scaffold protein transport for cell polarity generation.
Moreover, it was found a significant difference in the FAK and ERK signaling pathway,
which has been implicated as a key regulator for epithelial tubule formation in vitro
(O'Brien et al, 2004). In particular, focal adhesive kinase (FAK) has been indicated to
play a role in reorganization of the cytoskeleton, assembly of cell adhesion structures,
and regulation of cell membrane protrusions to cell migration (Schaller MD, 2004). It is
feasible that loss of normal cell-cell/matrix contacts could disrupt junction-related gene
expression (Balda MS and Matter, 2003). This disruption may dysregulate many
cytoplasmic proteins, including transcriptional factors and/or other proteins that control
cell cycle progression, cytoskeleton remodeling, and epithelial polarization either
directly or through other intermediary molecules, and eventually impair normal cell
5.2 Transcriptional network of PKHD1
To elucidate the transcription network involving PKHD1, the gene promoter region was
analyzed and it is identified an evolutionarily conserved hepatocyte nuclear factor-1
(HNF-1) binding site (Hiesberger et al, 2004).
HNF-1α and HNF-1β are transcription factors known to control the expression of
several genes, especially in liver, kidney and pancreas. Mutations in HNF-1α and HNF-
1 β are found in patients with maturity onset diabetes of the young types 3 and 5
(MODY5), respectively. Moreover, HNF-1β mutations have been associated with
hypoplastic glomerulocystic kidney disease, cystic renal dysplasia and
oligomeganephronia. HNF-1β directly controls the transcription of several genes
expressed in epithelial cells, such as Umod, Pkhd1, Pkd2 (Gresh et al, 2004) (Fig 17).
In the case of Pkhd1 HNF-1β binding site were identified at 35 Kb upstream of the
transcriptional start site. These sites occur as dublet and are conserved in both human
and mouse genome. In order to support a relationship between this transcription factor
and cystic proteins involved in kidney cystic diseases, Gresh and co-workers
demonstrated that transgenic mice with kidney-specific inactivation of HNF-1β
developed renal cysts and bilateral ureteral dilation (Gresh et al, 2004).
Figure 17. In vivo binding of HNF-1 proteins to their chromatin target sites in cystic kidney disease genes. Predicted in silico HNF-1 binding sites (vertical arrows) in Umod, Pkhd1, Pkd2, Nphp1, Tg737/Polaris and Pkd1 genes were tested in ChIP experiments for in vivo HNF-1α and β binding. The relative enrichment for each DNA fragment upon immunoprecipitation of HNF1α or β is illustrated as histograms. Colored bars represent HNF-1 binding sites with enrichments significantly higher than background (gray bars).
Supporting evidence for a role of HNF-1β as a Pkhd1 transcription factor has been
provided also by Hiesberger and colleagues (Heisberger et al, 2004). These
investigators cloned the Pkhd1 promoter region and demonstrated that HNF-1β and
HNF-1〈 directly activate the Pkhd1 promoter. In particular, because its localization in
bile ducts, pancreatic ducts, ureteric buds, mesophrenos and epididymis, HNF-1β is the
principal member of the HNF-1 family that regulates Pkhd1 expression in the kidney.
They showed, in addition, that expression of a dominant negative HNF-1ß mutant under
the control of a kidney-specific promoter in mice resulted in renal cystic phenotype
(Heisberger et al, 2004). To further characterize the molecular mechanism involved in
Pkhd1 regulation by HNF-1β, this group analyzed the effects of different HNF-1β
mutants on Pkhd1 promoter activation and concluded that the HNF-1β C-terminal
domain is required for its activation (Heisberger et al, 2005). These studies suggest a
model of cystogenesis in HNF-1β mutant disorders/models that is based on reduced
Pkhd1/PKHD1 expression secondary to abnormal transcription.
5.3 FC1 and cystogenesis
5.3.1 Tubular morphogenesis
Polycystic kidney disease, especially in its autosomal recessive forms (ARPKD), is
characterized by a progressive increase in tubular diameter and cyst formation (Wilson
PD, 2004a). Notably, early cyst formation is associated with an increase in the number
of cells in the circumference of dilated tubules (Boletta A and Germino GG, 2003; Gresh
et al, 2004). In order to assess the possible impact of defective mitotic alignment on
circumferential tubular cell number expansion, the mitotic alignment in mice with a
renal-specific inactivation of HNF-1β, a transcription factor that is essential for the
expression of genes including Pkhd1, was assessed (Gresh et al, 2004). The vast
majority of these mice develop a severe cystic phenotype owing to dilation of collecting
ducts and Henle's loops. In mutant pups, the mitotic alignments are significantly
distorted (Fischer et al, 2006). These results show a clear correlation between ARPKD
and the loss of planar cell polarization. To determinate if this defect is at the origin of
cyst formation or is a consequence of the disruption of the tubular architecture (tubular
dilation and cyst formation) mitotic orientation was evaluated in the pck rat, a model of
ARPKD because of a strongly decreased expression of Pkhd1 (Ward et al, 2002). Pck
rats develop cysts in Henle's loops, distal tubules and collecting ducts, with a later onset
than for renal-specific HNF-1β-deficient mice. It was found that in young pck rats, before
overt tubular dilation and cyst formation, a substantial number of mitoses were no
longer oriented along the axis of tubules. Moreover, the distortion of mitotic angles in
pck rats was not as pronounced as in the mouse PKD model, which correlates with the
different degree of tubular dilation. In fact, in precystic pck rats, the tubules containing
aberrantly oriented mitoses were not dilated. In this model, mitotic distortion precedes
tubular dilation that in turn becomes visible only several days later and involves only a
small percentage of tubules. In a similar way, few distorted mitoses were detected in
tubules that were still normally shaped in renal-specific HNF-1β-deficient mice at birth.
In conclusion, oriented cell division provides renal tubules the capacity to maintain a
constant diameter, despite the intense proliferative phase that accompanies tubular
lengthening. Proliferation strongly decreases with time, whereas cystic growth is a
continuous process, indicating that this phenomenon involves also non-proliferative
mechanisms (Fischer et al, 2006).
5.3.2 Cell proliferation
Cultured epithelial cells from patients or animal models of PKD have consistently
demonstrated an increased intrinsic capacity for proliferation and survival (Gabow PA,
1993; Grantham et al, 1996; Wilson PD, 2004a). This abnormal proliferation could be
triggered by activation of the cAMP pathway or by epidermal growth factor/epidermal
growth factor receptor (EGF/EGFR) axis.
a) cAMP-mediated proliferation
Growing evidence suggests that the adenyl cyclase-adenosine 3′,5′-cyclic
monophosphate (cAMP) pathway promotes both fluid secretion and cell proliferation in
ARPKD renal epithelia (Belibi et al, 2004). Mutated ARPKD protein is thought to disrupt
intracellular Ca2+ homeostasis or Ca2+ signaling leading to cellular de-differentiation and
hyper-proliferation through an abnormal cAMP-mediated proliferative pathway. In
normal human and mouse renal epithelial cells, cAMP has been shown to inhibit the
Ras/Raf-1/MEK/ERK pathway at the level of Raf-1 and to decrease cell proliferation. In
contrast, cAMP has been shown to stimulate B-Raf and activate the MEK/ERK pathway
in ARPKD cells leading to increased cell proliferation (Grantham JJ, 1996; Wallace et
al, 2002; Yamaguchi et al, 2000, 2003, 2004, 2006).
Therefore, cAMP can be either mitogenic or anti-mitogenic. In renal epithelia, the switch
in cAMP from an anti-mitogenic to a mitogenic stimulus has been shown to be directly
correlated with intracellular calcium levels [Ca2+]i (Yamaguchi et al, 2004) (Fig 18).
Figure 18. Pathways from cAMP and calcium to ERK and cell proliferation. Left, basal cell proliferation. Middle, anti-mitogenic action of cAMP in the presence of normal levels of calcium. Right, mitogenic action of cAMP in the presence of calcium channel blockers. Dark symbols and arrows indicate active pathways; gray symbols and arrows indicate inactive or inhibited pathways.
The PI 3-K/Akt pathway has been shown to regulate cAMP-dependent activation of B-
Raf/MEK/ERK and cell proliferation in CT principal cells (M-1) (Yamaguchi et al, 2003).
Phosphorylation of B-Raf by Akt has been shown to regulate B-Raf activity negatively
(Guan et al, 2000; Zhang BH and Guan KL, 2000). The reduction of intracellular [Ca2+]i
in immortalized mouse M-1 CT cells or primary human kidney epithelial (NHK) cells
converts both cell types from a normal cAMP growth-inhibited phenotype to an
abnormal cAMP growth-stimulated phenotype, characteristic of PKD renal epithelia
(Yamaguchi et al, 2004). Reduction of [Ca2+]i decreases Akt activity, allows cAMP-
dependent B-Raf activation, and stimulates cell proliferation. Direct inhibition of either PI
3-K or Akt causes cAMP-dependent ERK activation and cell proliferation, thus inducing
a phenotypic switch that imitates Ca2+ restriction (Yamaguchi et al, 2004).
Pharmacological elevation of Ca2+ increases P-Akt levels, whereas Ca2+ channel
blockers decrease P-Akt (Yamaguchi et al, 2006). This observation that the reduction of
intracellular [Ca2+] in M-1 or NHK cells with calcium channel blockers replicates the
abnormal proliferative response of ARPKD cells to cAMP establishes a link between the
proliferative phenotype, reduction in [Ca2+]i, and cAMP activity. Evidence for the role of
[Ca2+]i-mediated proliferation has been further strengthen by studies showning that the
elevation of [Ca2+]i levels ARPKD cultured cells increases Akt activity and blocks cAMP-
dependent B-Raf and ERK activation (Yamaguchi et al, 2006). Moreover, an increase in
[Ca2+]i restore the normal anti-mitogenic response to cAMP in renal cells derived from
human ARPKD Kidney. These reported data suggest that FC1 play a role in maintaining
Ca2+ homeostasis.
b) EGF-mediated proliferation
It has been suggested that abnormal expression of epidermal growth factor receptor
(EGFR) in the apical surface of cystic epithelia may contribute to cyst formation and
enlargement. In vitro studies analyzing cystic collecting duct cells derived from ARPKD
patients and different recessive PKD mouse models (bpk, cpk, and orpk) have
confirmed the abnormal apical expression of EGFR (Sweeney WE and Avner ED,
1998). The over-expression and abnormally located EGFRs on the apical (luminal)
surface of cyst-lining epithelia in human ARPKD and murine models have been shown
specifically to bind EGF/TGF-〈 with high affinity, to autophosphorylate, and to generate
mitogenic signals in response to EGF and/or cyst fluid (Sweeney WE and Avner ED,
1996, 1998). This creates a sustained cycle of autocrine/paracrine stimulation of
proliferation in cysts similar to that seen in many forms of cancer.
Moreover, it was demonstrated the importance of EGFR signalling in cystogenesis
engineering mice carrying both the orpk mutation and a point mutation that leads to
decreased EGFR tyrosine kinase activity; these animals were reported to have a
significant decrease in cyst formation (Richards et al, 1998). A number of studies,
moreover, have confirmed the benefits of using EGFR tyrosine kinase inhibitors to
attenuate cystic kidney disease in PKD animal models (Sweeney et al, 2003). It should
be noted, however, that in the orthologous rat model of human ARPKD, the pck rat,
EGFR tyrosine kinase inhibitors were not protective (Torres et al, 2004).
In addition to its role in the kidney phenotype of recessive PKD models, EGFR signaling
appears to be important in the pathogenesis of cystic biliary dysgenesis. It was shown
that biliary epithelial cells were hyper-responsive to the proliferative effect of EGF in a
non-orthologous recessive PKD mouse model, the bpk mouse. Moreover, it was
recently demonstrated, though the biliary epithelia of pck and control rats displayed
similar EGFR localization and signal intensity patterns, an increased proliferative
response to EGF in pck cultured biliary epithelial cells. This effect, in turn, apparently
involves the MEK5-ERK5 signaling pathway (Sato et al, 2005).
The role of the neoplastic-like in cystic epithelial proliferation and the epidermal growth
factor/epidermal growth factor receptor (EGF/EGFR) axis overactivity is confirmed in a
stable PKHD1-silenced HEK293T cell line (Yang et al, 2007). Then cell proliferation
rates, intracellular Ca2+ concentration and extracellular signal-regulated kinase 1/2
(ERK1/2) activity were assessed after treatment with EGF, a calcium channel blocker
and agonist, verapamil and Bay K8644. It was found that PKHD1-silenced HEK-293T
cell lines were hyperproliferative to EGF stimulation. Also PKHD1-silencing lowered the
intracellular Ca2+ and caused EGF-induced ERK1/2 overactivation in the cells. An
increase in intracellular Ca2+ in PKHD1-silenced cells repressed the EGF-dependent
ERK1/2 activation and the hyperproliferative response to EGF stimulation. Thus,
inhibition of PKHD1 can cause EGF-induced excessive proliferation through decreasing
intracellular Ca2+ resulting in EGF-induced ERK1/2 activation (Yang et al, 2007) (Fig
Figure 19. Signaling pathways involved in PKD pathogenesis. Both cAMP- and EGFR-axis-mediated pathways have been shown to be involved in the development and progression of PKD.
c) Other involved mechanisms in cell proliferation
HNF-1β inactivation described by Heisenberger and co-workers induces also an
increase in proliferation of epithelial cells (Hiesenberger et al, 2005). The presence of
renal cysts and the appearance of multilayered epithelia in mutant mice strongly
suggest that the inactivation of HNF-1β leads to an increased rate of cellular
proliferation. Recently, HNF-1α was shown to be involved in the control of cell
proliferation and biallelic inactivation of HNF-1α is frequently observed in liver
adenomas and in some hepatocellular carcinomas (Bluteau et al, 2002). For this
reason, HNF-1α can be considered as a tumor suppressor gene. At the same time,
HNF-1β could have the same properties, and the increased proliferation of HNF-1β/cells
upon kidney- and liver-specific inactivation of HNF-1β could be the result of defective
regulation of cell cycle in the absence of HNF-1β.
A different role of FC1 on cell proliferation has been suggested from results of a study in
an IMCD cell line in which FC1 has been suppressed by RNA interference. Mai and co-
workers demonstrated that the downregulation of FC1 disrupts normal tubulo-
morphogenesis resulting in abnormal cell-cell contact, cell-ECM interaction, cell
proliferation and apoptosis. In particular, pkhd1-silenced IMCD cells show a decreased
cell proliferation. Thus the aberrant proliferation may be mediated by disturbances of
ERK signaling (Mai et al, 2005).
5.3.3 FC1 and apoptosis
During kidney development, high levels of apoptosis are localized to the nephrogenic
zone and the developing medullary papilla (Coles et al, 1993). Apoptosis appears to be
the default pathway for removing uninduced mesenchyme from the developing nephron.
Curiously, the nephrogenic zone is a rapidly dividing population of cells that also
exhibits a high frequency of apoptosis, a paradoxical motif reiterated in PKD.
Recent reports have demonstrated that kidneys from patients with PKD exhibit high
levels of apoptosis (Lanoix et al, 1996; Woo D, 1995). It was observed that the c-myc
and bcl-2 genes are dramatically up-regulated in renal cysts from ADPKD suggesting
inappropriate regulation of the proliferative/apoptosis pathways in ADPKD (Lanoix et al,
An increase in cell apoptosis is evidenced also in the recessive form of PKD, but the
events underlining this process are not well identified (Torres VE, 1999).
In pck rats the index of apoptosis for intra-hepatic biliary epithelial cells differed between
the control rats, suggesting that this imbalance of cell proliferation and cell death is
involved in the dilatation and tortuosity of the intra-hepatic bile ducts (Sanzen et al,
The same increase in apoptotic figures in the cystic kidney is observed in wpn rat
(Gattone et al, 2004).
Analysis of mRNA expression in cpk mice evidenced that the percent of epithelial cells
exhibiting evidence of apoptosis was significantly increased in the cystic kidney and
liver compared to that seen in the normal mice. In kidney, cystic and non-cystic tubules
similarly exhibited in all organs examined increased apoptosis. In the hepatic biliary
ducts, the cystic mouse also exhibited increased epithelial apoptosis compared with
normal mouse liver. In particular, both pro-apoptotic (bak, bax, and bad) and anti-
apoptotic (bcl-2) mRNAs were elevated in cystic kidney and pancreas with the
prevalence of pro-apoptotic factors (Gattone et al, 2002).
An illusive position of the human AP-2β gene at chromosome 6p12–p21.1, within a
region that has been mapped for autosomal recessive polycystic kidney disease
(ARPKD) induced Moser and collaborators to associate to this transcription factor the
cause for massive apoptosis of AP-2β−/− mice.
In fact, sequence analyses of ARPKD patients and linkage analyses using intragenic
polymorphic markers indicate that the AP-2β gene is located in close proximity to but
distinct from the ARPKD gene. Histopathological findings in AP-2β−/− mice show
striking similarity with features of ARPKD, but they are clearly not identical. Kidneys of
AP-2β−/− mice develop small cysts in the renal medulla and paracortical region but any
failure in biliary duct formation was detected in either embryonic or postnatal livers. In
comparison with wild-type pattern it is observed apoptotic cells in mutant mice,
particularly in collecting ducts and distal tubuli. Analysis of the expression pattern of
pro- and anti-apoptotic genes in kidneys of AP-2β mutant mice in comparison to wild-
type and heterozygous animals revealed that the expression of proapoptotic genes, fas,
bad, bax, and myc, was identical in the kidneys of these animals, but a significant
decrease of the anti-apoptotic genes bcl-XL, bclw, and bcl-2 was observed, validating
the supposed function of AP-2 in programming cell survival during embryogenesis.
Unfortunately, any AP-2β mutation was found in 20 different ARPKD patients. Ongoing
studies will address the question of whether AP-2β expression is modified as a
downstream target of the ARPKD mutation (Moser et al, 1997).
More recently, the siRNA suppression of FC1 in IMDC cells, either directly or indirectly,
is found to promote programmed cell death during tubulo-morphogenesis in vitro (Mai et
The collected evidences are still less to indicate the specific role of apoptosis in the
pathogenesis of PKD and, in particular, in ARPKD.
5.3.4 FC1 and fluid secretion
ARPKD cysts have a fundamental structural difference from ADPKD cysts. ADPKD
cysts rapidly close off from urinary flow and continue to expand by transepithelial
secretion. As stated above, ARPKD cysts remain open with respect to the entire
nephron, maintaining both afferent and efferent tubular connections. However, secretion
is still a necessary element of cyst formation in ARPKD, and the difference in cyst
structure suggests a different secretory mechanism. In ADPKD, the weight of the
evidence indicates that Cl− is secreted via a cAMP-mediated co-transport mechanism in
the basolateral membrane and the cystic fibrosis transmembrane conductance regulator
(CFTR) in the apical membrane, leading to expansion of cysts, especially after they
have detached from the nephron of origin (Belibi et al, 2004; Sullivan LP and Grantham
JJ, 1996). This does not appear to be the case in ARPKD. By using a genetic
complementation approach, the bpk mouse (deficient in B-cell progenitor kinase) has
been crossed with a CFTR knockout mouse (Clarke et al, 1992). The results
demonstrate that the absence of CFTR does not alter the course of renal or biliary cyst
development or growth (Nakanishi et al, 2001).
ARPKD cystic epithelia have been shown to exhibit net fluid secretion through a
decrease in principal cell sodium absorption. This is attributable to an EGF-mediated
decrease in the alpha-subunit of the epithelial Na channel (Veizis IE and Cotton LU,
2005). Biliary epithelia in ARPKD have been shown to be hyperproliferative in response
to EGF (Nauta et al, 1995; Sato et al, 2005). However, the effect of EGF hypersentivity
in biliary epithelia on secretory mechanisms is unclear. It should be noted that abnormal
EGFR signaling may be also related to the dysfunctional sodium reabsorption observed
in ARPKD. In the distal nephron, EGF signalling through ERK1/2 activation inhibits
amiloride-sensitive sodium channels (Veizis IE and Cotton LU, 2005). The reported
decreased sodium absorption in bpk mouse-derived cell cultures suggested that this
effect might be mediated by increased EGF synthesis and signalling through apical
EGFR (Veizis IE and Cotton LU, 2005).
Potentially conflicting results were obtained in studies using ARPKD cyst-derived
epithelial cells. In fact, an other group (Rohatgi et al, 2003) showed that these cells not
only retained the normal sodium absorptive direction, but also displayed significantly
increased sodium re-absorption. These investigators suggested that the increased
sodium absorption in ARPKD cells could be partially mediated by the epithelial sodium
channel (ENaC) and might contribute to volume expansion and the clinically verified
systemic hypertension.
5.4 FC1 and signaling
5.4.1 FC1 and proteolitic modifications
FC1 is subjected to site-specific proteolytic cleavage (Hiesberger et al, 2006). At least
six different fragments that contain the C-terminus of FC1 were generated. Although the
abundance of the larger proteolytic fragments varied under different experimental
conditions, a 21 kDa fragment (FCA) was consistently observed. The 21 kDa fragment
contains most of the cytoplasmic domain of FC1 and was primarily observed in the
FC1 thus undergoes regulated proteolysis releasing a cytoplasmic C-terminal fragment
that translocates from the cilium, apical membrane, or cytoplasm to the nucleus. The
protease that mediates FC1 cleavage remains unidentified, but inhibitor studies suggest
that it is not γ-secretase or calpain. Similarly to other proteins that are subjected to
regulate proteolysis, only a small fraction of FC1 appears to be cleaved. In particular,
the pattern of proteolytic cleavage (close proximity to the transmembrane domain,
nuclear translocation of the resulting cytoplasmic fragment) resembles RIP of other type
I membrane proteins. Nuclear signaling of cytoplasmic fragments generated by RIP is
most extensively described for Notch but also found in the case of APP, ErbB4, NRG-1,
CD44, N-cadherin, and lipoprotein receptor-related protein (Landman N and Kim TW,
2004). RIP controls vital signaling mechanisms that are crucial for regulatory processes
and disease pathogenesis.
Overexpression of the C-terminal cytoplasmic domain of FC1 had no effect on AP-1 or
STAT-dependent reporter genes as seen in polycystin-1 proteolysis, which suggests
that at least some of the functions of the cytoplasmic domains of polycystin-1 and FC1
are distinct. Interestingly, FCA appears not to be uniformly distributed in the nucleus but
accumulates specifically in the nucleolus (Heisberger et al, 2006).
Several lines of evidence indicate that the release of intracellular Ca2+ is a prerequisite
for FC1 proteolysis. Constitutive cleavage of FC1 observed in a long-term cell culture
system could be prevented by pharmacological inhibition of Ca2+–induced Ca2+ release.
No cleavage of FC1 was observed under basal conditions in a short-term cell culture
system, but cleavage and nuclear translocation could be induced by pharmacological or
receptor-mediated stimulation of intracellular Ca2+ release. These findings suggest that
signalling cascades that affect [Ca2+]i might act as central regulators or mediators of
One Ca2+-dependent signaling cascade that is considered to be central in the
development of polycystic kidney disease involves primary cilia. It is possible that
primary cilia are also involved in the regulation of FC1 proteolysis. FC1 proteolysis was
observed in long term cultures of mIMCD-3 cells, which form primary cilia, and no
cleavage was observed in short term HEK293 cell cultures, which lack primary cilia.
However, no effect of fluid flow on FC1 cleavage has been detected (Heisberger et al,
Cleavage of FC1 is stimulated by activation of PKC. Conventional PKCs are activated
by intracellular Ca2+ release and represent potential downstream effectors of Ca2+–
induced Ca2+ release. However, it is not clear how activation of PKC triggers FC1
cleavage (Heisberger et al, 2006).
More recently, a more complicated pattern of proteolytic processing was discovered for
FC1 producing multiple smaller products (Kaimori et al, 2007). Some of the proteolytic
reactions were regulated, whereas others appeared constitutive. A likely PC site was
found in the extracellular domain of FC1 that appears responsible for producing a large,
tethered N-terminal fragment present on the cell surface, suggesting that a member of
the ADAM metalloproteinase disintegrins family mediates shedding of this fragment.
Cleavage at this extracellular site is required for the concomitant regulated release of an
intracellular C-terminal fragment, the latter step apparently being a γ-secretase
dependent process. Confocal analysis reveals that FC1 that is localized to the primary
cilium undergoes regulated shedding and intra-membrane proteolysis (RIP).
Many of the same properties are confirmed in endogenous mouse FC1. The presence
of a small C-terminal product, localized to the nucleus is confirmed also by Kaimori et al
(Kaimori et al, 2007). They also found that release of the intra-cellular product was both
constitutive and regulated by calcium and speculated that the process occurred in
conjunction with ectodomain shedding. In contrast with previous study, they localize this
small proteolytic product in to nuclear bodies or splicing speckles.
The post-translational pattern of proteolytic processing of FC1 is very similar to what
has been previously described for the key developmental protein, Notch (Harper et al,
2003; Schweisguth F, 2004). The shed ectodomain may function as a ligand for other
cellular receptors, whereas its RIP product may have direct signaling functions. In the
case of Notch, the receptor–ligand interaction occurs between adjacent cells and
functions to determine cell fate. In the case of FC1, the protein cannot be
unambiguously localized to the site of cell–cell interactions in the cell types examined.
Instead, it has shown that it traffics to the primary cilium from where it undergoes
regulated shedding. This result has a number of important implications. First, it may
mean that ectodomain shedding and RIP for FC1 are not ligand-mediated but instead
regulated by other processes that locally activate ADAM sheddases. The activation of
other ciliary receptors or flow-mediated changes in calcium flux may mediate this
process. Alternatively, FC1 may function like Notch as a receptor, but its ligand is either
a secreted molecule present in the lumen or a factor also present on the surface of the
primary cilium. This observation, coupled to the fact that the ectodomain is shed into the
lumen and thus potentially projected beyond adjacent cell boundaries, suggests
important functional differences between Notch and FC1. At present, it is not possible to
determine whether the FC1 intracellular cleavage products have a fate similar to that of
Notch. One possibility is that the ectodomain functions in a paracrine fashion: in ductal
and tubular epithelial cells that line lumens with flow, its release from primary cilia into
the lumen may be a mechanism to distribute signal to down-stream or adjacent targets
beyond the immediate point of cell–cell contact. One intriguing possibility is that flow-
based delivery of the shed product may be a way of maintaining planar orientation with
respect to the longitudinal axis (Fig 20).
In other cell types, cilia-based release may be a way to project signal beyond the
immediate vicinity. This may serve as a means of coordinating the activity of a group of
cells rather than that of just a single neighbour. This potentially could be an important
way to coordinate the activity of cells to form tubular structures of defined diameter.
Figure 20. Model of FC1 processing and function. A) A subset of FC1 molecules is subject to post-translational processing by a PC, resulting in an N-terminus that is tethered to the C-terminal product. A second set of FC1 molecules traffics to the plasma membrane without processing and undergoes constitutive release of intra-cellular cytoplasmic products. Upon metalloprotease activation, FC1 sheds its ectodomain into the lumen and the cytoplasmic C-terminus leaves the plasma membrane. B) Flow-based delivery of the shed FC1 ectodomain may help maintain cellular planar orientation by helping to deliver an asymmetric gradient of signal. C) Two models of how flow-based distribution of shed product could theoretically establish signal gradients and thus orientation information for tubular cells. The panels on top represent the view looking down on the cell surface of a cluster of six cells, each with a central primary cilium (red) leaning in the direction of flow (purple arrows on top). The yellow-shaded rectangle represents the signal gradient resulting from shed FC1 ectodomain. The panels on the bottom represent sections taken either along the longitudinal axis of the tubule through the primary cilium (left) or orthogonal to the direction of luminal flow through the centre of the cell (right). The two models differ in that the gradient is parallel to the direction of flow in one (left) and perpendicular to it in the other (right).
5.4.2 FC1 and protein interactions
Despite the recent discoveries, the protein interaction network of fibrocystin is not well
defined. Recently, it was suggested that calcium-modulating cyclophilin ligand (CAML)
is a FC1 binding partner. The direct interaction of these two proteins involves the N-
terminus of CAML and the juxtamembrane region of the intracellular C-terminus of FC1.
Moreover, these two proteins co-localize in cilia, the basal body, and the plasma
membrane in cells from the distal nephron (Nagano et al, 2005).
CAML was originally found to interact with cyclophilin-B in lymphocytes (Bram RJ and
Crabtree GR, 1994). It is a 296 aa ubiquitously expressed protein that in lymphocytes is
located in the endoplasmic reticulum, and that is in the same membrane fractions as the
markers of calcium storage organelles, calreticulin and SERCA2 (Holloway MP and
Bram RJ, 1998). The CAML protein has three predicted membrane-spanning domains
and hydrophilic N- and C-terminal domains. The N-terminal domain is directed toward
the cytoplasm and interacts with other proteins including TACI (transmembrane
activator and CAML interactor), a T cell-specific protein, the EGF receptor, the Kaposi's
sarcoma virus K7 protein, and FC1. The C-terminal domain is in the lumen of the ER
and interacts with effector proteins that may include Ca2+ transport proteins (Holloway
MP and Bram RJ, 1996; Holloway MP and Bram RJ, 1998; von Bülow GU and Bram
RJ, 1997; Feng et al, 2002; Tran et al, 2003). CAML interacts with ATRAP (AT1
receptor-associated protein), a protein that binds directly the C-terminus of the AT1
receptor and it contributes to regulation of NF-AT by the AT1 receptor (Guo et al, 2005).
The N-terminal domain of CAML interacts with the kinase domain of the EGF receptor
and contributes to the recycling of internalized receptors to the plasma membrane (Tran
et al, 2003). CAML also interacts with p56Lck and regulates its intracellular location in T
cells (Tran et al, 2005). Finally, the Kaposi's sarcoma virus mitochondrial K7 protein, an
antiapoptotic protein interacts with the N-terminal domain of CAML to raise intracellular
Ca2+ and block apoptosis (Feng et al, 2002).
The significance of the interaction between FC1 and CAML is still unknown. The fact
that these two proteins interact suggests that either FC1 participates in regulation of
intracellular Ca2+ stores like TACI, ATRAP, or the Kaposi's sarcoma virus K7 protein, or
that the interaction of the two proteins relates to protein trafficking, as is the case of the
EGF receptor and p56Lck (von Bülow et al, 1997; Guo et al, 2005; Feng et al, 2002;
Tran et al, 2003; Tran et al, 2005). Co-localization of FC1 and CAML in the cilium is
intriguing because of the fact that PKD1 and PKD2 are also localized in the cilium and
presumably function to regulate intracellular Ca2+ (Zhang et al, 2004; Nauli et al, 2003).
In the distal nephron, bile ducts, and pancreatic ducts, FC1 could interact with CAML to
modulate intracellular Ca2+ by affecting the filling of the intracellular stores.
Probably, homozygous loss of function mutations in FC1 could result in loss of function
of CAML and this would lead to more filling of stores and a lower intracellular Ca2+
(Holloway et al, 1996, 1998; Feng et al, 2002). This scenario is compatible with the
phenotypes of loss of function mutations in PKD1 and PKD2 that also result in reduced
Ca2+ entry in response to fluid flow.
PC2, an other protein involved in calcium signaling, was seen to participate not in a
direct way at the same protein complex with FC1. The linker protein involved in the
creation of a triplex (PC2–KIF3B–FC1) is the kinesin-2 motor subunit KIF3B. Moreover,
several experiments demonstrated that PC2 and FC1 are in the same complex only if
KIF3B is present; altering KIF3B level in IMCD cells by over-expression or by siRNA
significantly affected complexing between PC2 and FC1 (Wu et al, 2006).
Thus, KIF3B represents the first molecular linker between ADPKD and ARPKD
proteins, suggesting that the protein complex PC2–KIF3B–FC1 is part of a common
molecular pathway implicated in renal cystic diseases. Kinesin-2, as a heterotrimer
formed by KIF3A, KIF3B and KAP3, is important for numerous cell functions, in
particular, cilium growth and cell cycle (Miki et al, 2001; Cole et al, 1998, Cole DG,
1999; Haraguchi et al, 2005) and has profound pathological implications. Given the
existence of a triplex PC2–KIF3B–FPC, it is important to determine where the three
proteins co-localize, as this would provide hints at their possible physiological roles. In
ciliated IMCD cells, PC2 partially co-localized with KIF3B and FC1 in primary cilia
suggesting the possibility that the flow sensor is composed of a larger complex
containing not only PC1 and PC2, but also KIF3B, FC1 and possibly other proteins (Wu
FC1 is capable of increasing PC2 channel function in the presence, but not in the
absence, of KIF3B. Thus, KIF3B likely links PC2 and FPC together not only in a
structural complex, but also for the regulation of PC2 channel function.
So, FC1 is another partner of PC2, which functionally upregulates its channel function
through KIF3B regulations. It is also possible that the roles that KIF3B plays in the
PC2–FC1 complexing and in the modulation of PC2 by FC1 are different from its role as
a kinesin-2 motor subunit. One possible scenario would be that a triggering to the
complex, e.g. a ligand binding to FC1 or PC1, induces conformational changes to
partners in the complex, which leads to modulated PC2 channel activity, which will then
affect downstream processes (Wu et al, 2006).
PC2/FC1 interaction is confirmed by Wang and collaborators (Wang et al, 2007). Co-
localization of FC1 and PC2 at the plasma membrane and on the cilium led researchers
to hypothesize FC1-PC2 interaction but not in a direct manner. One of the molecular
candidates mediating the interaction between FC1 and PC2 is retained to be KIF3A and
not KIF3B as seen previously (Wu et al, 2006)
Unlike the biliary ductal epithelial cells (Masyuk et al, 2003, 2004), however, successful,
but not total, reduction of FC1 in the RNA and protein levels did not result in obvious
defects in ciliogenesis, suggesting that the residual FC1 is sufficient for normal
ciliogenesis or there might be other specific splicing events of Pkhd1 (Onucich et al,
In FC1 knockdown IMCD-3 cells, only the combinatory action of an antibody against the
extracellular epitope of FC1 produces a complete blocking of flow-induced calcium
signal. These data were reproduced also in MEK cells. Therefore, disruption of either
FC1 or the PC1/PC2 complex at the primary cilium results in defects in
mechanosensation of fluid flow (Wang et al, 2007) (Fig 21).
SIGNALING
SIGNALING
SIGNALING
SIGNALING
Figure 21. A model of the polycystin-FC1 complex at the primary cilium. A) Upon fluid flow stimulation, mechanical shear stress is transmitted into the cell via membrane proteins on the cilium, which consequently activates a calcium channel such as PC2 and al ows calcium entry and subsequently activates the ryanodine receptor (RyR) through a calcium-induced calcium release intracellular signaling mechanism. B) and C) Disruption of the PC1/PC2 protein complex abolishes the Ca2+ entry signal. D) Blocking of FC1 may diminish the Ca2+ signal through the modulation of the polycystin complex and downstream effectors such as RyR; X, unknown molecule(s).
5.4.3 FC1 and calcium signaling
FC1 is localized in the cilium of renal epithelial cells, which plays a role of sensor of
mechanical and chemical stimulation from the lumen of renal tubules (Ward et al, 2003).
For instance, in vitro bending the cilium initiates a transient increase in intracellular Ca2+
and loss of cilia abolishes the response of the renal epithelium to fluid flow (Praetorius
HA and Spring KR, 2001, 2003). In vivo, mutation of the Tg737, the gene encoding cilia-
associated proteins, leads to attenuation of mechano-regulation of intracellular Ca2+ (Liu
et al, 2005). Apparently, the misregulation of intracellular Ca2+ plays a key role in the
pathogenesis of ARPKD. As previously mentioned, in the distal nephron, bile ducts, and
pancreatic ducts, FC1 interacts with CAML which is involved in upregulation of
intracellular Ca2+ concentration (Nagano et al, 2005). In ARPKD patients, significant
lower basal Ca2+ concentration was observed in cystic cells compared with normal
kidney cells. This event alters the cAMP-proliferative response and the addition of Ca2+
to ARPKD cells reverse this effect (Yamaguchi et al, 2006). Inhibition of PKHD1 by RNA
interference led to lowered intracellular Ca2+ concentration in the HEK-293T cells (Yang
The connection between FC1 and calcium signaling could be explained with the recent
detection of interaction with PC2, a Ca2+-permeable channel located in the primary
cilium in association with PC1 (Fig 22).
Figure 22. The polycystin1/polycystin2 complex (PC1–PC2), which is sensitive to shear stress, is localized within the ciliary membrane (left panel). Fluid-induced ciliary bending activates this Ca2+channel. The Ca2+ influx (right panel) causes Ca2+ release from ryanodine-sensitive intracellular stores and subsequent downstream responses such as activating protein-1 (AP1)-dependent gene transcription by the Ca2+-dependent kinase PKCα.
Moreover, polycystin2 is also an intracellular Ca2+ channel that is required for the
normal pattern of [Ca2+]i responses involving ryanodine receptors and inositol
triphosphate receptors (IP3Rs) e.g. following activation of epidermal growth factor
[EGF] or Gq-coupled protein receptors and phospholipase C activation. PC2 interacts
physically with transient receptor potential channel and contributes to store-operated
Ca2+ channel (SOC) activity.
The activity of PC2 channel can be modulated by FC1 via KIF3B interaction in a planer
bilayer electrophysiology system (Wu et al, 2006).
Total suppression of FC1 induces a complete blocking of flow-induced calcium signal in
both MEK and IMCD-3 cells. Consequently, disruption of either FC1 or the PC1/PC2
complex at the primary cilium results in defects in mechanosensation of fluid flow
(Wang et al, 2007).
Some evidence that ARPKD phenotype is related to disruption in cilia structure, calcium
signalling and related proteins (i.e. PC2), derives from orpk mouse model (Siroky BJ
and Guay-Woodford LM, 2006). Collecting duct cells of orpk mice in which cilia
structure was impaired result in elevated Ca2+ entry across the apical membrane. The
observation that this affected Ca2+ entry pathway in orpk cilia(-) cells is Gadolinium
(Gd3+) sensitive is consistent with a role for PC2 in mediating the enhanced Ca2+ entry.
The finding that store-operated Ca2+ entry pathways are similar in cilia(-) vs cilia(+) cells
indicates that not all Ca2+ entry pathways are affected by the loss of cilia.
It was observed a relocation of PC2 throughout the apical membrane. This loss of
spatial organization may have consequences regarding the functional regulation of PC2
channel activity. In the absence of primary cilia, PC2 apical disposition is released
resulting in unregulated and continuous Ca2+ entry across the apical plasma membrane
(Siroky BJ and Guay-Woodford LM, 2006).
Ca2+ plays an important role in cytoskeletal organization and function. Chronic
elevations in subapical membrane [Ca2+] acting through alterations in cytoskeletal
organization could affect processes such as protein distribution and cellular transport.
Additionally, a strong association has been made implicating Ca2+ in the regulation of
signaling cascades which govern cell growth and proliferation (Berridge et al, 1998;
Kahl CR and Means AR, 2003). Specifically, sustained elevations in [Ca2+]i have been
shown to promote cellular proliferation (Munaron et al, 1995).
All these consequences induced by abnormal [Ca2+]i homeostasis are listed as
characteristic features of ARPKD.
Aim of the thesis
AIM OF THE THESIS
The aim of the thesis was to generate an "in vitro" model based on two different cell
lines that would reproduce the biochemical modifications typical of ARPKD renal cystic
cells by the loss of function(s) of FC1. Two different cell types were chosen to highlight
the various possible roles of FC1 on different cell features mainly including proliferation
and cell death. The first cell line, HEK293, was a human cell line immortalized from an
embryonic kidney, the second was an immortalized primary culture derived from tubular
epithelial cells of human adult kidney, 4/5 cells.
In order to better define the pathobiology of ARPKD we produced cell lines with
downregulated expression of PKHD1. Thus, the first part of the thesis reports data on
the construction of the plasmids expressing the PKHD1 siRNA, the selection and
consequent characterization of potentially suppressed clones.
In the second part, the attention was mainly focused on the analysis of the relation
between abnormal FC1 expression, cell proliferation and apoptosis. Furthermore,
particular interest was devoted to the possible role between FC1 and calcium
homeostasis and signaling.
1. Cell cultures
Human embryonic kidney (HEK293) cells were grown in minimal essential medium
(MEM) supplemented with 10% South America foetal bovine serum (FBS) (Celbio).
SV40-transformed human tubular epithelial cell (4/5), gently provided by Dr. Peter
Harrys from Mayo Clinic of Rochester USA, were grown in 50% Dulbecco's modified
Eagle's/ 50% Ham's F12 (DMEM/F12), supplemented with 10% FBS, 50 mg/ml of
penicillin and 100 mg/ml streptomycin.
4/5 clones expressing PKHD1 si RNA were grown in complete DMEM/F12 10%FBS
supplemented with 500 µg/ml Geneticine sulfate (G418) (Sigma).
2. Production of siRNA expressing vectors
Two siRNAs (A and B) for FC1 were constructed according to a published method
(Brummelkamp et al, 2002). Two unique 19-nt sequences derived from the mRNA
transcript of the PKHD1 (PKHD1 dcDNA: Gene Bank accession number AF480064)
(the "N-19 target sequence") were chosen following the Oligoengene procedure (Table
2). These sequences were introduced in a 64 bp oligonucleotides including the unique
N-19 target in both sense and antisense orientation, separated by a 9 nt spacer and 5'
Bgl II site and 3' Hind III site.
These forward and reverse oligos were annealed and cloned into the pSUPER vector,
between the unique BglII and HindIII enzyme sites. This positions the forward oligo at
the correct site downstream the H1 promoter's TATA box to generate the desired siRNA
duplex (Fig 23).
Exon 6 (nt 646-665)
GTTTATCCACCAAGTGGTG
Exon 8 (nt 766-785) GCTCAAGGAGACAAATGGG
Table 2. shRNAs against human PKHD1 cDNA (Gene Bank accession number AF480064)
The forward PKHD1A primer sequence:
TTTTGGAAA3' and the reverse primer sequence:
The forward PKHD1B primer sequence:
TTTTTGGAAA3' and the reverse primer sequence:
Anti sense
Figure 23. Schematic representation of PKHD1 siRNA A and B plasmids.
3. Stable transfection of PKHD1 siRNA oligonucleotides
Wild type (pSuper), scramble vector and recombinant constructs (pSsiPKHD1 A and B)
were co-transfected (ratio 1:10 respectively) with the G418 antibiotic-resistance
pCDNA3 vector by calcium phosphate method in HEK293 cells at 70%-80% of
confluence. The medium was refreshed one hour before transfection. 2X HEPES
buffered saline (HEBS) was added to CaCl2 in 10 mM HEPES pH7.2. The recombinant
plasmids, pCDNA3 and CaCl2 2.5M were mixed and, after 30 min at room temperature, the DNA CaPO4 co-precipitated was added to the cells. After 6 hours, the CaPO4 containing medium was removed and replaced by culture medium. After 24 hours cells
were splitted in a ratio of 1:10, 1:50, 1:100 and cultured in selection medium (MEM 10%
FBS with 500 µg/ml G418). After 3 weeks of selection, stable HEKsiPKDH1A/B clones and
HEKpSuper control clones were isolated.
Electroporation was used to transfect 4/5 tubular kidney cells with pSsiPKHD1 A and B
vectors. 5X10⁶ cells were washed two times in electroporation buffer HeBS (10mM
HEPES pH 7.2, 150mM NaCl, 5mM CaCl2, 6mM glucose), resuspended in 0.45ml of
HeBS and mixed with 10%FBS and 10µg of 5:1 pre-mixed plasmidic vectors (pS empty
vector or pSsiRNAPKHD1 A/B and pCDNA3, respectively). After 10 minutes of incubation on
ice, the mixture was pipetted into a disposable electroporation cuvette. The samples
were treated with one or two electric pulses at 0.3kV and 250mF using a BioRad Gene
Pulser. To test the efficiency of electroporation, 4/5 cells were transfected with a
plasmid containing the cDNA for PKCα-GFP. After electroporation cells/DNA mixture
was pelletted at low speed and plated in F12 10%FBS in 100mm dishes. After 24 hours
cells were splitted with a ratio of 1:10, 1:50, 1:100 and let to grow in selection medium
(DMEM/F12 10% FBS with 500 µg/ml G418). After 3 weeks of selection, stable
4/5siPKDH1A/B clones were isolated.
4. FC1 mRNA analysis
4.1 RNA extraction
G418-resistant clones (both HEK293 and 4/5 tubular epithelial cells) were washed two
times in 4°C cold D-PBS and lysed directly in T25 flask with TRIZOL. After the addition
of chloroform in ratio of 1:5, they were centrifuged at 8,500g for 20 minutes; the
aqueous phase was collected and RNA was precipitated with isopropanol at 8,500g for
20 minutes, 4°C. After two washes with 75% ethanol, RNA was checked by
electrophoretic analysis on a 0.8% agarose gel.
4.2 RT-PCR
Total extracted RNA (3-5 µg) was subjected to reverse transcription using the Im-Prom
II reverse transcriptase kit (Promega). The reverse transcription was performed both
with random primers and with a specific primer for FC1 mRNA sequence, RT2 (table 3)
(Wang et al, 2004). mRNA was incubated at 25°C for 5 minutes, at 42°C for 1 hour and
at 70°C for 15 minutes to inactivate the reverse transcriptase.
4.3 PCR and Nested PCR
cDNAs was amplified with two specific primers for FC1 (hPKHD1 Up, hPKHD1 Down)
and for β-actin (ACT-F, ACT-R) as reference gene.
PCR products were diluted at ratio of 1:100 and subjected to nested PCR with a pair of
internal primers (PKHD1 1651F and PKHD1 1895R) to the FC1 PCR products (Wang et
al, 2004) in order to enrich the amplified product.
Primers sequences and annealing conditions are described in table 3.
Anealing
Length of
Primers Primer
sequence
condition
(30 cycles) fragment
(nt 8245-nt 8274)
(nt 1432-nt 1461)
(nt 2044-nt 2079)
5'AGAAGGATGTTAGACCAAAG3
ACT-F 5'TGACGGGGTCACCCACACTGTGCCCATCT3'
ACT-R 5'AGTCATAGTCCGCCTAGAAGCATTTGCGG3'
Table 3. Primers sequences and conditions for FC1 RT-PCR, PCR and Nested PCR (Wang et al, 2004).
5. Western blotting analysis
Western blotting through the detection of the endogenous FC1 protein was especially
performed on membrane fraction.
Detection of 42/44kDa p-ERK/ERK, NFkB-p65, p21, p53 β-tubulin was performed on
total cell lysates.
5.1 Membrane preparation
The membrane fraction was prepared according to Nagano et al (Nagano et al, 2005).
Cells were harvested in buffer containing 20mM Hepes pH 7.5, 2mM MgCl2, 1mM
EDTA pH 8, protease inhibitors, and homogenized with 30 strokes of a Dounce B
homogenizer. Homogenates were centrifuged at 1500rpm for 10 minutes at 4°C to yield
a post-nuclear pellet. The resultant supernatant was centrifuged at 15,000rpm for 1
hours at 4°C to yield crude membrane and cytosol fractions. Protein contents were
measured by Bradford colorimetric method.
5.2 Cellular total extract
To obtain total cell extracts, cells in T25 confluent flasks or sub-confluent 6-well plates
were washed twice with D-PBS containing protease inhibitors. After mechanical
detachment, cells were harvested and centrifuged at 1600rpm for 5 minutes, 4°C. The
pellet was resuspended in a single detergent lysis buffer (10mM TRIS-HCl pH 7.5, 10
mM NaCl, 3 mM MgCl2, 1% v/v triton X-100 and complete protease inhibitor cocktail) for 30 minutes on ice. After centrifugation at 10,000g for 2 minutes 4°C, an amount of cell
lysate was assayed for protein content by Bradford method.
5.3 Electrophoresis and immunoblotting
The membrane fractions (50 µg), premixed with 6X loading buffer (60mM Tris pH 6.8,
1.8% SDS, 6% v/v glycerol, 0.6M DTT, 0.002% p/v bromophenol blue), were subjected
to 4-12% SDS–PAGE and proteins were transferred to nitrocellulose membrane
(Pierce) for 2 hours in transfer buffer (25mM Tris, 192mM Glycine, 20% methanol pH
8.3). Blots were blocked overnight at 4°C in 5% non-fat dry milk in D-PBS, 0.05%
Tween20. Then, membranes were processed for immunoblotting with the monoclonal
antibody anti FC1 14A N-Ter gently provided by Dr. Peter Harris, diluted 1:1000 in 5%
non-fat dry milk in D-PBS, 0.05% Tween20. After 2 hours of incubation, three washes
with D-PBS 0.05% Tween20 were performed and consequently nitrocellulose
membranes were incubated with the anti mouse HRP-coniugated IGg antibody
(1:50,000). After three washes with D-PBS, 0.05% Tween20, immuno-bands were
visualized by autoradiography with the enhanced chemioluminescence system
(SuperSignalFemto, Pierce).
25-50 µg of total extracts were loaded on 8%-10% SDS-PAGE, pre-mixed with 6X
loading buffer (60mM Tris pH 6.8, 1.8% SDS, 6% v/v glycerol, 5% β-mercaptoethanol,
0.002% p/v bromophenol blue). After protein transfer to the nitrocellulose membrane,
immunoblotting was performed with different primary antibody: anti mouse ERK/pERK
and p21 (1:1000) (Cell Signaling), anti mouse NFkB-p65 (1:2000) and anti mouse p53
(1:2000) (Santa Cruz Biotechnology), anti mouse β-tubulin (1:1000) (Sigma).
All the primary antibody were incubated for 2 hours, exceptionally anti mouse
ERK/pERK was incubated overnight in 5% non-fat dry milk in D-PBS, 0.05% Tween20.
The respective HRP-coniugated secondary antibody were added after three washes
with D-PBS, 0.05% Tween20. Chemioluminescence from immuno-bands were
detected by autoradiography.
Band intensity was quantitatively analyzed by using the Model GS-700 Imaging
Densitometer (BioRad).
6. Cell proliferation and cell cycle analysis
After plating at low density (30,000 cells/ml) in 24 well plates, cell proliferation was
measured after a 24h starvation (MEM or DMEM/F12 plus 0.4%BSA). Direct counting
was performed after 12, 24, 48 and 72 h of incubation with 0.1%FBS, 1%FBS and 10%
FBS with exclusion of death cells by Trypan blue staining (Sigma). Cell proliferation was
also evaluated after 72h of incubation with 100 µM ATP (Sigma) in culture medium with
0.1%FBS or 20-40ng/ml EGF (Sigma) for 24 hours in culture medium added of
0.4%BSA. Cell proliferation was also performed in HEK293 cells by adding 10µM
parthenolide (Alexis), an inhibitor of NFkB pathway. The evaluation of cell detachment
was performed with Trypan blue staining inclusion in presence of 1%FBS, 0.2%DMSO
and 10µM parthenolide for 1h. Cell cycle was analyzed by flow cytometry of propidium
iodide (PI)-treated cells according the manifacture instruction, using the FACSCalibur
Becton Dickinson Immunocytometry System. Both HEK293 and 4/5 cell lines were
plated at the density of 3x10⁵ cells, starved for 24h in 0.4%BSA and then stimulated for
12h in the respective medium added with 1%FBS. Cells were collected, wash twice with
ice cold D-PBS and centrifuged at 1600rpm for 5 minutes. Cell pellets were
resuspended at a density of 1x10⁶ cells/ml with D-PBS and incubated with PI solution
for 30 minutes at 4°C in the dark. 20,000 events were collected for each analysis.
Amount of cells in G1-G0, S or G2-M phase were expressed as percentage of the total
number of PI positive counted cell (Software Cell Quest Pro, Becton Dickinson).
7. Apoptosis analysis
7.1 Hoechst 33258 staining
HEK293pSuper and HEK293pSsiPKHD1 cells were cultured on 24-mm coverslips for 24h,
starved 24h with 0.4% BSA. Apoptosis was evaluated after treatment with 1%FBS for
24h; when present, 10µM partenolide was pre-incubated for 1h before treatments.
Then, cells on coverslip were fixed with a 10% formalin solution, permeabilized with
0.1% Triton X100, 2% BSA in PBS, and stained with Hoechst 33258 (10mg/ml). Before
analysis, cells were washed twice with D-PBS and fluorescence at 510-540nm was
recorded by a Zeiss Axiovert 200 fluorescence microscope equipped with a back-
illuminated CCD camera (Roper Scientific, Tucson, AZ), excitation and emission filter
wheels (Sutter Instrument Company, Novato, CA), and piezoelectric motoring of the Z
stage (Physik Instrumente, GmbH and Co., Karlsruhe, Germany).
7.2 Caspase 3 assay
Caspase 3 activity was evaluated using EnzChek caspase-3 Assay Kit (Invitrogen).
After treatment with 0.4%BSA, 1%FBS for 48h, or with 10µM parthenolide for 1h cells
were harvested, and then were lysed for 30 min on ice, according to the manufacture
instruction. UV-induced apoptosis was investigated in cells previously irradiated with UV
(30min at 312nm). After centrifugation, 50µl of supernatant were incubated with 50µl of
2X substrate working solution containing 5mM Z-DEVD-R110. Fluorescence was
measured every minute for 90 min at 520nm by a fluorimeter (VICTOR3 1420 Multilabel
Counter, PerkinElmer). Values were normalized to the amount of protein samples by
Bradford method.
8. Calcium measurements
8.1 Aequorin method
Measurements of ATP-evoked calcium levels were performed in cells grown on
coverslips and transfected with recombinant cytoplasmic aequorin cDNA (cytAEQ). 72h
after transfection, the prosthetic group of aequorin, celenterazine, was added and after
two hours of incubation, reconstituted cells on coverslips were transferred into a
thermostated perfusion chamber of a luminometer. After 1 min of perfusion with a saline
solution with or without 1mM calcium, cells were stimulated with 100µM ATP. To ensure
the correct measure of ATP-evoked calcium, the maximum signal due to the complete
aequorin saturation was obtained by lysis of cells on coverslip with a solution of 100µM
8.2 Fura 2AM Ca2+ measurement
Cytoplasmic Ca2+ oscillations and ATP- or serum-evoked calcium were measured in
Fura-2AM-loaded cells (Manzati et al, 2005). Cells, grown on coverslips, were starved
overnight with 0.4% BSA, loaded with Fura-2AM (4µM/30min/37°C), and transferred to
the thermostated stage of a Zeiss Axiovert 200 inverted microscope, equipped with a
Sutter filterwheel and 340/380 excitation filters. Cells were stimulated with 1% FBS or
with 100µM ATP. In order to calibrate the system, cells on coverslip were also perfused
with a saline solution added with 5µM Ionomicine and successively with a 50mM EGTA
solution to chelate all calcium released.
Recording was performed for 15 min, acquiring 1 image every 1 sec, respectively.
Signals were computed into relative ratio units of the fluorescence intensity of the
different wavelengths (340/380 nm).
9. NFAT and NFkB luciferase assay
Cells were seeded in 6-well plates, cultured to 80% confluence in 10% FBS
supplemented medium, and transfected, by Ca2+ phosphate method, with 4µg/well
pNFκB-TA-Luc reporter construct (containing four NF-κB consensus sequences
upstream the firefly luciferase reporter gene) or with pNFAT-TA-Luc. After 6h post-
transfection, the cells were washed and medium supplemented with 0.4% BSA was
added. Twenty-four hours later, cells were treated for 16h with medium 0.4%BSA,
1%FBS, with TNF-α (15ng/ml) or parthenolide alone (10µM/1 hours) and in combination
and with 14 or 24h 1%FBS. Cell extracts were normalized for the protein content and
assayed, in triplicate, with a Promega's luciferase assay system using a 20/20n
luminometer (Turner Biosystems). Data were expressed as relative firefly luciferase
units (RLUS) normalized by the β-galactosidase units as fold increase with respect to
10. NFkB-GFP localization assay
Cells were seeded in 6-well plates on coverslips, cultured to 80% confluence in 10%
FBS supplemented medium, and transfected, by Ca2+ phosphate method, with 4µg/well
pNFκB-GFP construct. After 6h post-transfection, the cells were washed and medium
supplemented with 0.4% BSA or 1%FBS was added. After 48 hours, localization of
NFkB-GFP fluorescence was analyzed. Fluorescence was collected at 510-540nm and
recorded by a Zeiss Axiovert 200 fluorescence microscope equipped with a back-
illuminated CCD camera (Roper Scientific, Tucson, AZ), excitation and emission filter
wheels (Sutter Instrument Company, Novato, CA).
11. Statistical analysis
When applicable, statistical errors of average were given as means ± SD or SEM and
statistical significance was assessed by Student's t-test.
1. RT-PCR detection of PKHD1 RNA in human kidney HEK293 cells
HEK293 cells were chosen to produce PKHD1 siRNA-downregulated clones because
they are easely transfectable and because PKHD1 RNA expression is easely
detectable in these cells by RT-PCR analysis (Fig 24). This amplification system, in fact,
was used to test the efficacy of PKHD1 siRNA silencing in the pSuper vector-
transfected cells.
White blood
FC1 244 Kb
Figure 24. Expression of FC1 in different cell lines (4/5 tubular epithelial cells, HEK293, linfoblastoid cells and white blood cells) ensure the robustness of amplification system and the presence of FC1 in studied cell line. A double dose of cDNA was used in the analysis of blood derived compared to kidney derived cells.
2. Effect of stable suppression of two siRNA oligonucleotides for PKHD1 in
HEK293 and 4/5 tubular epithelial cells
After three weeks of G418 selective culture, the HEK293 clones either transfected with
PKHD1 siRNA A or B expressing vectors and control vectors were assayed for the
PKHD1 mRNA and FC1 protein content.
RNA was extracted from 43 HEK293 siRNA A and B clones, reverted with PKHD1-
specific and random primers, and amplified with PKHD1 and β-actin specific primers
(Fig 25). The densitometric values of PKHD1 RNA bands were normalized to those of
actin RNA. The PKHD1 RNA values in siRNA-transfected clones were compared to
those of control clones and expressed as their percent values.
Both PKHD1 siRNA A and B sequences produced a variable reduction in PKHD1 RNA
in HEK293 cells. The number of suppressed A and B clones was determined
considering a cut off value of suppression equal to or lower than 78.11% of control
values (25% over the mean percentage of PKHD1 expression values in total A and B
clones (62.49%) compared to control cells).
specific sequences
PKHD1 gene
A/B PKHD1
sense antisense
Exon6 Exon7 Exon8
Exon5 Exon9
SeqA: nt 646
SeqB: nt 766
CTCTTATAAATAGGCAGATGGGAAGCTG nt824
siPKHD1 A clones
siPKHD1 B clones
RT-PCR β-actin
siPKHD1 A clones
siPKHD1 B clones
RT-PCR PKHD1
Cut-off 78.1%
(% values)
expressi 20
siPKHD1 A clones
siPKHD1 B clones
Figure 25. Schematic representation of siRNA suppression procedure and analysis. A) siRNA suppression recombinant vector. B) Localization of suppressing sequences on PKHD1 gene (Gene Bank accession number AF480064). C) RT-PCR analysis of PKHD1 and β-actin RNA in some potentially suppressed HEK293 clones. D) % value of PKHD1 expression in PKHD1 siRNA-transfected relative to control clones. The suppression cut off value (78.1%) was indicated.
Based on data summarized in table 4, siRNA A appeared more efficient than siRNA B
in suppressing PKHD1 RNA. Of the 20 analyzed siRNA A transfected clones, in fact, 14
resulted suppressed (70%), with a mean value of mRNA expression of 35.84% ± 25.2%
of control clones (ranging from a 2.35% minimum to a maximum 62.2% value). 10 of 24
siRNA B-transfected clones (41.7 %) were suppressed, with a mRNA expression mean
value of 26.09% ± 15.32%, from 6.9% min to 62.2% max value.
9 A and 9 B clones had PKHD1 RNA percent expression lower than 50% of control
values, with a comparable average expression of 21.63% ± 18.7% and 22.07% ±
9.08%, respectively. The siRNA A was more efficient than siRNA B also in the maximal
suppression: 3 A clones had an expression lower than 10% with a minimum value of
2.35%, whereas 1 B clone had an expression lower of the 10% with the minimum value
of 6.29%. These findings are summarized in table 4.
siPKHD1 A
siPKHD1 B
N° of total analyzed clones
N° of suppressed clones*
Mean value of PKHD1 RNA in suppressed clones 35.84% ± 25.2%
N° of clones with < 50% of PKHD1 RNA levels
Mean value of PKHD1 RNA expression < 50%
Minimum value of PKHD1 RNA expression
N° of clones < 10% of PKHD1 expression
Table 4. Summary of PKHD1 suppressed clones. PKHD1 RNA suppression was based on the cut off value of 78.11% (≤ the 25% over the average PKHD1 RNA levels in A+B clones, expressed as percentage of values of HEK293 control cells (untrasfected or transfected with scramble RNA and empty vectors).
The effect of PKHD1 RNA suppression was then evaluated at protein level by
immunoblot analysis of a restricted number of A and B clones.
The FC1 expression was detected by a monoclonal antibody directed against the N-
terminus of FC1 (mAb 14A N-Ter). This antibody recognized two bands: a 400 kDa
band corresponding to full length protein and a ≈ 200 KDa band corresponding to a
splicing variant of the protein (Fig 26).
FC1 was detected both in membrane fractions and in total lysates. Densitometric
analysis of FC1, normalized for β-tubulin, revealed that the protein expression was
markedly reduced in some clones (reduction of ≈ 70% or more), as in A6 and B14
clones which were chosen as reference clones for further analysis.
FC1 400KDa
ß-tubulin 50 KDa
HEK pS A4 A6 A7 A17 B3 B4 B14 B15 B17 B18
FC1 400 KDa
FC1 200 KDa
β-tubulin 50 KDa
HEK PS A4 A6
B15 B17 B18
Figure 26. A, C) Western blot analysis of some potentially PKHD1 suppressed HEK293 clones with the moAb against the N-terminal of FC1 in total lysates (A) and membrane fractions (C). B, D) Bars indicate FC1 expression that was calculated by densitometric analysis of FC1-positive bands in total lysates (B) and in membrane fractions (D) after normalization for β−tubulin positivity.
SV-40-trasformed tubular epithelial 4/5 cells were transfected with the oligonucleotide
siPKHD1 A that appeared more efficient on FC1 suppression. The suppressor siRNA A
expressing vector was introduced in 4/5 cells by electroporation; after three weeks of
G418 selection, clones were assayed for mRNA expression and FC1 protein content
(Fig 27). Ten clones were isolated but only two clones (A1 and A2) resulted partially
suppressed (PKHD1 cDNA levels were 73.3% in A1 and 68.2% in A2 compared to
controls) and were considered for future analysis. The low number of positive clones
was probably due to the very low efficiency of 4/5 cells transfection.
ession e vs 80
FC1 244 Kb
expr valuc tri
β-actin 600 Kb
FC1 400 KDa
β-tubulin 50 KDa
Figure 27. RT-PCR and Western blotting analysis of 4/5 A1 and A2 clones. A) PKD1 RNA reverse transcription demonstrated a low reduction in PKHD1 expression. B) FC1 expression detected by anti-FC1 N-ter 14A antibody in total lysates resulted reduced in A1 and A2 cells.
3. Functional analysis of HEK293 and 4/5 selected clones
3.1 Cellular effects of FC1 downregulation in HEK293 epithelial cells
A previous study of PKD1 siRNA suppressed clones showed that, as expected, the
downregulation of PKD1 expression was associated to an increase in FBS-stimulated
cell proliferation (Aguiari et al, 2008 in press; Torres VE and Harris P, 2006). Therefore,
due to the similarity between autosomal and recessive PKD, HEK293 cells stably
transfected with PKHD1 siRNA were analyzed for possible changes in cell proliferation.
Surprisingly, the proliferation induced by FBS in FC1-downregulated (FC1(-)) A and B
clones was lower than in pSuper control cells. After 24 h of culture, the reduction was
found to be dose dependent (10% FBS> 1% FBS> 0.1% FBS), with a similar 30%
maximal decrease both in A6 and B14 suppressed clones (panel A in Fig 28).
In addition, a time course analysis performed after 12, 24, 48 and 72 h of culture,
showed that the FBS-induced reduction in proliferation was yet present after 12 h and
maintained at least up to 72 h culture (panel B and C of Fig 28).
12h 24h 48h 72h 0h 12h 24h 48h 72h
Relative
Figure 28. Cell proliferation in FC1(-) HEK293 cells. A) After 24 h of starvation (0.4% BSA), stable clones were
stimulated with different concentration of FBS (0.1%, 1% and 10%) for other 24 h. B) Representative time course of pSuper control cell and A6 and B14 stable transfected clones cultured in 1% FBS. C) 1% FBS-induced reduction in cell proliferation was already present after 12 h stimulation.
Cell proliferation analysis, that was based on the counting of trypan blue negative cells,
revealed that the reduction in cell proliferation was associated to an increase in the
number of dead cells (trypan blue positive cells) in both A and B selected clones (panel
The increased number of dead cells in HEK293 suppressed clones was also detected
after 12h culture (panel B in Fig 29). Moreover, the presence of 0.2% DMSO, in addition
to 1% FBS, for 12 h culture markedly highlighted the percentage of dead cells in FC1(-)
cells (from 3.8 to 12.4 times higher than in control cells) (panel C of Fig 29).
tal cells
tal cells
to
Figure 29. Trypan blue positive HEK293 cells. A) After 3 days of incubation in 1% FBS, trypan blue positivity was higher in A and B cells. B) The increase in A and B dead cells was also detected after 12 h culture. C) In presence of 0.2% DMSO combined to 1% FBS, cell positivity to trypan blue staining was markedly increased in FC1(-) cells.
The FC1 downregulation was also accompanied by an increased number of cells in
suspension (Fig 30), indicating that FC1 expression play a role in the adherence of
epithelial cells to plastic surface.
Figure 30. Number of HEK293 cells in suspension. After 12 h of incubation in 1% FBS and 0.2% DMSO, the number of cells in suspension was higher in A (red) and B (dark yellow) cells than in pSuper control cells (blue). Cells in suspension were expressed as percentage of total adherent plus non adherent cells.
Since cell proliferation in PKD is known to be modulated by ATP and EGF (Schwiebert
et al 2002; Torres VE and Harris P, 2006), we studied if these molecules could be
responsible for the serum-dependent effects on FC1(-) cell proliferation and survival.
Therefore, cell proliferation analysis was performed in presence of 100 µM ATP, 20 and
Treatment with ATP (100 µM) for 72 h in the presence of 0.1% FBS, induced a slight
increase in cell proliferation in stably suppressed clones (A6, B14), thus showing that
ATP-induction of cell proliferation was capable to blunt the effect of FBS-dependent
reduction in cell proliferation (panel A in Fig 31). Moreover, the treatment with ATP
appeared to reduce, though not significantly, cell death in FC1(-) cells. In fact, treatment
with ATP reduces in both HEK293 suppressed clones (A and B) the percentage of
trypan-blue positive cells (panel B, Fig 31), suggesting that ATP could protect PKD cells
from cell death.
Relative cell
Figure 31. Effects of ATP on cell proliferation and trypan blue positive cell number. ATP treatment induced an increase in cell proliferation of FC1(-) clones (panel A) and a decrease in trypan blue stained cells compared to pSuper control cells (B). Data are espressed as percent of total cells.
After 24 h of incubation in absence of FBS, EGF at 20ng/ml induced a slight increase in
both pSuper and FC1(-) HEK293 clones without increasing the growth capacity of FC1(-
) in comparison with pSuper cells (Fig 32). However, the double dose (40ng/ml)
maintained a slight stimulatory effect on control cells, but produced an inhibitory effect
on both A and B clones (A&B in Fig 32), indicating that EGF possibly present in the fetal
serum may contribute to the inhibitory role of FBS in FC1(-) cell proliferation.
Cell rel n
(-) (+20) (+40) (-)
(+20) (+40)
(+20) (+40)
(-) (+20) (+40)
Figure 32. Effect of EGF treatment on cell proliferation. Cells were treated with either 20 or 40 ng/ml EGF for 24 h in Medium added of 0.4% BSA. The lowest dose (20 ng/ml) induced an increase in cell proliferation both in pS and in A&B cells, calculated as mean of A6 and B14 clones. The higher dose maintained the increase in cell proliferation in pS, but induced a decrease in A&B cells.
3.2 Cellular effects of FC1 downregulation in 4/5 tubular epithelial cells
In order to verify if the FC1(-) dependent effects observed in HEK293 cells were also
present in other kidney epithelial cells, the effect of siRNA PKHD1A on cell proliferation
was evaluated in 4/5 cells which were derived from tubular cells of a normal kidney, and
maintained a quite differentiated phenotype (Loghman-Adham et al, 2003).
As found in HEK293 cells, after culture in 1% FBS the stably transfected FC1(-) A1 and
A2 4/5 clones showed a constant decrease in cell proliferation (from 12 until to 72 h of
incubation) with respect to untransfected 4/5 control cells (Fig 33). In particular, the
inhibitory effect of siPKHD1A was more evident in 4/5 A1 than in A2 cells, consistently
with the lower FC1 immunodetection in the latter clone.
To verify if the decreased cell proliferation was accompanied to an increased cell death,
trypan blue positive cells were counted and compared after 12 h of culture in 1% FBS.
As observed in HEK293 cells, cell positivity to trypan blue was increased in both clones,
suggesting that cell survival was reduced by FC1 depletion in 4/5 cells too.
Relative cell
Figure 33. Effect of siRNA PKHD1 A expression on cell proliferation and survival in 4/5 tubular epithelial cells. A) Representative time course of proliferation in 4/5 control, A1 and A2 stably transfected clones. B) FBS-induced reduction in cell proliferation was maintained for up to three days after serum stimulation (72 h) and was yet present at 12 h after stimulation, recalling the effect of siPKHD1 on HEK293 cell line. C) Trypan Blue positive cells were increased in both A1 and A2 clones after 12 h of treatment with 1% FBS.
It is noteworthy that the reduction of cell proliferation in FC1(-) 4/5 cells (about 50% of
control) was higher than that found in HEK293 FC1(-) cells (about 30% of control) in
despite of the degree of PKHD1 downregulation by siRNA that appeared lower in 4/5
than in HEK293 cells (see results of Fig 26 and 27). This observation indicated that FC1
could play similar but also different functions in the two different kidney epithelial cell
3.3 Cell cycle was impaired in FC1 deficient HEK293 and 4/5 tubular epithelial
To investigate the mechanism responsible for the decrease in cell proliferation of FC1
deficient cells, and in the light of FC1 localization in centrosome and basal bodies that
are important for cell replication, cell cycle analysis was performed. HEK293 and 4/5
cells were starved overnight, and the analysis was performed by measuring Propidium
Iodide (PI) incorporation after 12 h treatment with 1% FBS.
The analysis revealed in FC1(-) cells a slightly increased amount of cells in G1-G0
phase (significant in 4/5 cells) and a significant decrease in G2-M phase cells, while no
differences were found in DNA synthesis (S) phase. This pattern was observed in two
different FC1(-) expressing clones for each HEK293 and 4/5 tubular epithelial cell line
tal cells
pS A&B pS A&B
tal cells
to 30
Figure 34. Cell cycle analysis in HEK293 (A) and 4/5 tubular epithelial cells (B). On the left, the distribution of PI stained cells in G1-G0, S and G2-M phases. On the right, diagrams show the average percentages of cells in different cell cycle phases obtained by results of at least four experiments in duplicate. The analysis was performed collecting about 20,000 events and calculating the percentage of cells in the cycle phases. The number of cells in G1-G0 was higher whereas that in G2-M phase was lower in FC1-depleted than in control cells. Increase in G1-G0 phase and decrease in G2-M phase could be hypothesized for an increased amount of cells starting programmed cell death cells and/or waiting to enter in mitosis.
3.4 Apoptosis was increased in PKHD1 suppressed clones
Results from proliferation and cell cycle analysis led to the hypothesis that the lack of
FC1 in both cell lines could introduce critical impairments that induce the cell to die for
apoptosis. To assess if apoptosis was really increased in FC1(-) clones, it was analyzed
in HEK293 cells through both staining of apoptotic nuclei by Hoechst 33258 dye (Fig
35) and caspase-3 activity assays.
HEK293 cells were treated with 1% FBS that was capable to induce a decrease in cell
proliferation. As expected, both FC1(-) A6 and B14 cells demonstrated an increase in
the percentage of nuclear fluorescence (1.47 ± 0.56 higher in A6 vs pS1, *p=0.034; 1.24
± 0.27 higher in B14 vs pS, *p=0.034) (Fig. 35).
Figure 35. Hoechst 33258 staining in HEK293 cells. Images of nuclear staining with Hoechst 33258 dye in absence and presence of 1% FBS (upper and lower images). Histogram of relative apoptotic index. The apoptotic index by Hoechst 33258 staining was calculated on the mean fluorescence value of a group of 50 or more cells on a coversleep collected along 20 planes in the Z axes (Z-series). Z-series analysis of nuclear staining indicated a significantly increase of apoptotic index (*p=0.034) in FC1(-) cells.
The caspase-3 assay was performed both in HEK293 cells and in 4/5 tubular epithelial
cells in presence of 1% FBS incubated for 24 h. Caspase-3 was indistinguishably
increased in both types of FC1(-) cells.
In HEK293 cells after 24 h in 1%FBS the caspase-3 activity was increased of 1.3 fold in
FC1(-) cells (mean activity values: 357222 ± 25878 in pS vs 456631 ± 53959 in B14)
Figure 36. Caspase-3 activity in HEK293 cell line. A) The enzyme kinetic in 1%FBS demonstrated an increased apoptotic index in FC1(-) B14 clone. The mean fluorescence intensity was represented with bold lines. B) 1.3 fold increase in caspase-3 activity was shown in B14 clone taken as reference FC1(-) HEK293 clone.
In 4/5 tubular epithelial cells caspase-3 activity was investigated under different
experimental conditions. First of all an increase in caspase-3 activity was confirmed
after serum incubation in two different 4/5 clones (A1 and A2) (37091.38 ± 15326 in 4/5
vs 64411.9 ± 15245.41 in A1&A2 clones) (panel A, C (-) in Fig 37).
nce 100000
flu 50000
trated vs
Figure 37. Caspase-3 activity in 4/5 tubular ephitelial cells. Both in presence of 1%FBS and after UV-irradiation, caspase-3 activity in FC1(-) 4/5 cells (A2, dark pink; A1, light pink) is higher than in control cells (A, B). The fold increase of caspase-3 activity by UV treatment is shown in panel C (1.408 ± 0.33 in UV-treated 4/5 control (blue) vs 1.774 ± 0.2 in UV-treated FC1(-) A1&A2 cells (pink). In presence of 0.4% BSA and absence of FBS (panel D), caspase activity is also 1.7 fold higher (averages of the first 25 min) in FC1(-) A2 compared to control cells.
The increase in caspase-3 activity was highlighted by the treatment with UV rays for 30
minutes (from 52252.8 ± 11026.7 in 4/5 to 114309.8 ± 12923.03 in A1&A2). 4/5
demonstrated a 1.408 ± 0.3 fold increase by UV treatment in enzyme activity, while A1
and A2 suppressed clones demonstrated a 1.774 ± 0.2 fold increase with respect to
untreated basal values (panel B, C in Fig 37). This increase was still evident in absence
of serum, being a 1.7 fold higher in FC1(-) than in control cells (panel D in Fig 37).
The caspase-3 apoptotic marker was also evaluated in a transient suppression of 4/5
cells with the siPKHD1A suppressor. In comparison with pSuper transfected 4/5 cells
(control cells), caspase-3 activity resulted slightly increased in cells transfected with
PKHD1 siRNA A expressing plasmid. This occurred only after 1% FBS stimulation for
16h, but not in presence of D-MEM 0.4% BSA (Fig 38). In presence of 0.4% BSA
caspase 3 activity was in fact not increased in FC1(-) with respect to control cells
(62845.08 ± 7301.38 in pS vs 50349,38 ± 9673,78 in siPKHD1A), while in 1% FBS the
activity was increased (78551.53 ± 14751.55 in pS vs 96737.85 ± 13901.78 in
siPKHD1A) with a fold increase of 1.25 for pS and 1.92 for siPKHD1A FBS-treated vs
FBS untreated cells.
pS empty vector
Figure 38. Caspase-3 analysis in siPKHD1 A transient trasfected 4/5. The increase in caspase-3 activity was confirmed in PKHD1A siRNA transiently transfected cells only after 1% FBS treatment (bold lines) compared to samples in BSA (regular lines).
4. Calcium homeostasis in FC1 deficient cells
4.1 ATP-evoked calcium was increased in FC1 suppressed HEK293 cells
The presence of FC1 and PC2 in the same protein complex (Wu et al, 2006) is
suggestive of a functional interaction between these proteins, possibly in the control of
intracellular Ca2+ homeostasis and signaling. If this is the case, protein interaction could
be reavealable, for instance, by changes in evoked-Ca2+ levels in cells with different
levels of FC1 expression, like those produced by PKHD1 siRNA silencing. Moreover,
PC2 is considered an endoplasmic reticulum resident channel (Nauli et al. 2003)
involved in the Ca2+ release from the intracellular stores (Koulen et al, 2002). It is also
well known that extracellular ATP elevates the cytoplasmic Ca2+ concentration by
mobilizing Ca2+ from internal stores via activation of purinoceptors in the plasma
membrane in HEK-293 cells too (Aguiari et al, 2003). Therefore, in addition to cell
proliferation and death, the possible role of FC1 suppression on intracellular calcium
homeostasis was studies by analysing ATP-evoked calcium levels in FC1(-) cells.
The analysis was initially performed in A and B HEK293 clones. As shown in Fig 39,
only clones with high degree of FC1 depletion responded to ATP with cytoplasmic Ca2+
levels higher than those measured in pSuper cells, while selected clones with no FC1
depletion did not show such an increase.
1 8 15 22 29 36 43 50 57 64 71 78 85 92 99 106 113 120 127 134
µM calcium
Figure 39. ATP-evoked cytoplasmic Ca2+ concentrations in different A and B clones. A) Representative trace of calcium levels in cytAeq-transfected cells. Addition of ATP (100 µM) was indicated by arrow. B) average values ± SD are indicated by bars. Clones were chosen in relation to their FC1 expression (see panel D in Fig 26): A6, B3, B14, B15 showed high degree of FC1 suppression, while A7, A17, B17 appeared to be not suppressed cells (scratched bars). Ca2+ concentrations were measured in cyt Aeq transfected cells as detailed in the method section (see next figure for representative Ca2+ traces).
So, it was also possible to establish that FC1 depletion induced an increase in ATP-
evoked cytoplasmic Ca2+ levels. In particular, further analysis of A6 and B14 clones
demonstrated a 1.4 fold significant increase in ATP-evoked Ca2+ (1.421 ± 0.168 in A6,
1.447 ± 0.082 in B14 compared to 1 ± 0.086 in pS; **p= 0.007 in A6 vs pS, ***p=0.000
in B14 vs pS) (Fig 40).
Time (sec)
Time (sec)
Figure 40. ATP-evoked cytoplasmic Ca2+ in A6 and B14 clones. A) Representative traces of ATP-evoked Ca2+ levels in HEK293 cells. 100 µM ATP was used. B) The ATP-stimulated pick value was higher in both A and B clones compared to control pS clone, and this increase was statistically significant (pS, 1 ± 0.086; A6, 1.421 ± 0.168; B14, 1.447 ± 0.082; **p= 0.007 in A6 vs pS, ***p=0.000 in B14 vs pS).
The increase in ATP-evoked Ca2+ release in FC1(-) cells may have different origins:
from ER stores, as initially hypothesized, but also from plasma membrane channels.
Because of the FC1 depletion, plasma membrane resident TRP channels may in fact
modify their functional properties or new channels may be redistributed from other
districts (from cilia to plasma or endoplasmic reticulum membranes). Thus, ATP-evoked
Ca2+ was evaluated in calcium free experimental conditions, in presence of saline buffer
without addiction of external Ca2+: the observed pick was, therefore, due to Ca2+ release
from intracellular stores (panel A of Fig 41). When 1mM Ca2+ was added to the
perfusion saline, a second pick was observed caused by the opening of membrane
channels. The third pick was obtained by treatment with ATP in presence of
saline/calcium 1mM. Results obtained showed that FC1(-) cells had higher increase in
evoked calcium after ATP-treatment in calcium free saline that was higher of that
observed after the addition of external calcium. This observation indicated that the ATP-
evoked increase in FC1(-) cells could be contributed by both intracellular store and
plasma membrane channels, the former directly affected by FC1(-) deficiency, the latter
more open because of the more Ca2+ release from the endoplasmic reticulum (Fig 41).
µM calcium 0.5
+ATP/ (+)Ca2+
Figure 41. ATP-evoked calcium in FC1(-) cells in absence and in presence of external calcium. A) Representative traces of ATP-evoked Ca2+ levels in HEK293 cells. 100 µM ATP and calcium 1mM was used. B) Mean values of cytoplasmic Ca2+ levels in cytAeq-transfected cells pSuper and A6 clones are indicated by bars. Aequorinometer method was described in the method section.
4.2 Evoked calcium was higher in FC1 suppressed 4/5 cells
Analysis of evoked cytoplasmic calcium was performed also in 4/5 cells transiently
transfected with plasmid expressing the siPKHD1 B sequence. Because of the low
transfection efficiency of 4/5 tubular epithelial cells, evoked calcium was measured with
the calcium sensitive dye Fura-2AM. Fura-2AM loaded cells were stimulated either with
ATP (100 µM) after 24 h of starvation.
In 4/5 cells transiently transfected with siPKHD1 B, the ATP treatment induced an
increase in calcium levels which was statistically significant higher (2.78 fold) than that
observed in pSuper empty vector transfected cells (384.59 ± 90.02 nM in pS versus
1071.3 ± 354.11 nM in siPKHD1B transfected cells, *p<0.05) (Fig 42). This FC1
depletion-dependent increase in 4/5 cells was therefore consistent with (and even more
evident than) that observed in HEK293 cells with the aequorine calcium measurement.
Since abnormal cell proliferation and apoptosis observed in FC1(-) cells was caused by
serum stimulation, a possible effect of 1% FBS on evoked cytoplasmic calcium levels
was also tested in 4/5 transiently transfected cells. The suppression of FC1, even if in a
transient manner, caused a significant increase (2.5 fold) in the pick amplitude of
serum-evoked calcium with respect to 4/5 pS transiently transfected cells (130.12 ±
21.55 nM in pS versus 325.66 ± 123.77 nM in siPKHD1B transfected cells, *p<0.05)
1 11 21 31 41 51 61 71 81
FC1siRNAB
Figure 42. ATP-evoked calcium in 4/5 transiently transfected cells. Analysis was performed in Fura-2AM loaded cells by recording fluorescent images with a fluorescent microscope as described in the method section. Cells were stimulated with ATP (100µM) after about 80 second. FC1siRNA B transfected cells demonstrated an ATP-evoked calcium pick value 2,78 fold higher than that in pSuper transfected cells (1071.3 ± 354,11 in siPKHD1B vs 384.59 ± 90.02 in pS, *p<0.05).
FC1siRNAB
time (10xsec)
Figure 43. FBS-evoked calcium in 4/5 transiently transfected cells. 4/5 transfected with FC1siRNAB demonstrated an FBS-evoked calcium pick 2,5 fold higher than that in pS transfected cells (325.66 ± 123.77 in siPKHD1B vs 130.12 ± 21.55 in pS, *p<0.05). See previous legend for technical details.
4.3 FC1 suppression does not affect Ca2+ oscillation in HEK293 cells
In HEK293 cells with depletion of PC1 by PKD1 siRNA interference an increase in cell
proliferation was found: it was related to the PC1 depletion and was dependent from an
increase in the frequency of Ca2+ oscillations (Aguiari et al, in press). In FC1(-) HEK293
cells, that demonstrated a decrease in cell growth, it was, therefore, putatively expected
a decrease in the frequency of Ca2+ oscillation. Results presented in Fig 44 show that
there were no differences in the variability of the FBS-induced Ca2+ oscillation-
frequency between pS and A and B cells. PKHD1 silencing, therefore, did not
significantly affect the frequency of Ca2+ oscillations.
Figure 44. FBS-induced Ca2+ oscillations in FC1(-) HEK293 cells. A) Three different examples of Ca2+ oscillation traces both for pS control and A suppressed cells showing the variability in oscillation frequency in control and suppressed cells. B) Bars represent mean oscillation frequency per cell in 15 minutes of record. There was no difference between pS, A and B clones.
5. Cell signalling in FC1 suppressed cell lines
Suppression of FC1 in two different epithelial cell lines, HEK293 and 4/5 tubular cells,
caused evident effects like the increased response in intracellular evoked-calcium, the
reduction in cell proliferation and the more susceptibility to cell death.
Regulation of proliferation and apoptosis could be obtained by modulation of different
pathways. For example, variation in intracellular calcium level and activation of its
related effectors (NFAT, PKC-alpha, etc) must be considered a common way to
modulate cell proliferation. In the same way, activation or inhibition of a transcription
factor such as NFkB could direct the cell towards cell division or programmed cell
death. Moreover, considering the role of FBS treatment in the production of FC1
depletion-dependent effects, the extracellular regulated kinase signaling should be also
involved. Therefore, the assessment of the activity of these pathways was essential to
understand the role of FC1 in cell survival and cell death.
5.1 ERK signaling was down regulated in FC1(-) HEK293 cells
The phosphorylation and dephosphorylation of 42/44 MAP kinases are well known
regulators of cell survival and cell proliferation. Expression of phosphorylated and non-
phosphorylated ERK was therefore assessed in both FC1(-) and control cells. The
analysis was performed in basal conditions and after treatment with either 1% FBS or
ATP (100 µM) that were used in cell growth and survival experiments.
The western blot analysis with the anti p-ERK antibody showed that the levels of
phosphorylated forms, normalized for the positivity to the anti-ERK antibody signals,
were higher (a mean increase of 2.7 fold) in pSuper control than in FC1(-) cells (Fig 45).
The depletion of FC1, therefore, could induce a basal decrease in ERK activity, which is
consistent with the reduction in proliferation and survival in these cells. However, when
cells were treated with 1% FBS for 15 min, an increased level of p-ERK (from 1.8 to 5
fold) was observed in FC1(-) cells, but not in pS control cells where instead a clear
decrease was observed. On the contrary, ATP treatment caused an increase in p-ERK
in both pS cells and FC1(-) cells, but with a higher effect in control cells (Fig 45). Taken
together, these results showed that the behaviour of p-ERK in FC1(-) cells was different
from that of control cells, though without a clear association with cell growth.
0.1%FBS 1%FBS ATP 0.1%FBS 1%FBS ATP 0.1%FBS 1%FBS ATP
Figure 45. Analysis of ERK signaling in HEK293 cells. A) Ponceau red, samples were loaded onto 10% acrylamide SDS-PAGE. Anti-42/44 MAPK antibodies were used to evaluate the expression of phosphorylated and non-phosphorylated forms of ERK proteins under different conditions (15 min treatment with 1% FBS or 100 µM ATP). B) Bars represent the mean ± SD of p-ERK/ERK values in basal conditions in pS (blue) and FC1(-) (A6, red; B14, yellow) cells, in three independent experiments.
5.2 The regulator of cell cycle p21/WAF and p53 were not affected by PKHD1
silencing in HEK293 cells
Because of the increased apoptosis and the reduction in the cell cycle observed in
FC1(-) cells, the expression of p53 and p21/WAF (the cyclin-dependent kinase inhibitor
1A involved in the regulation of progression to the S phase during cell cycle (Harper et
al, 1993)) were also investigated. Differently from ERK, the expression of these proteins
did not show consistent differences between pSuper and FC1(-) cells (data not shown).
5.3 NFAT signaling was increased in FC1 deficient HEK293 cells
The assays of NFAT binding activity in HEK293 cells revealed a clear increase in
transcription of luciferase reporter gene in FC1(-) cells with respect to control cells. The
increase in NFAT activity was present both in A6 and in B14 clones, with a 2.5 and 4.9
fold increase in A6 and in B14 clones, respectively (1642 ± 624.85 SE in pS, versus
4134.57 ± 2118.47 SE in A6 and 8033.8 ± 2104.07 SE in B14, the only one significant:
B14 vs pS, *p=0.026) (Fig 46). This observation strongly indicates the functionality of
the calcium increase in both suppressed clones.
Figure 46. NFAT promoter-luciferase reporter gene activity. NFAT activation in FC1(-) A6 and B14 clones was increased and statistically significant in B14 (B14 vs pS *p=0.026).
5.4 NFkB binding activity was deregulated in PKHD1 suppressed clones
The activity of the transcription factor NFkB was assessed both in HEK293 and 4/5
human epithelial cells as DNA binding activity to a luciferase reporter promoter
construct. NFkB-depending luciferase activity was evaluated both in transiently and
stably PKHD1 siRNA transfected cells.
Differently from that expected for a reduction in cell proliferation, in both types of FC1(-)
cells the luciferase activity was greatly increased. In PKHD1 siRNA transiently
transfected HEK293 cells a 31.88 and 16.6 fold increase was evident in A6 and B14
cells, respectively, compared to control cells (0.0036 ± 0.0011 in pS empty, 0.115 ±
0.00029 in siPKHD1A and 0.06 ± 0.0007 in siPKHD1B transfected cells) (panel A in Fig
47). In HEK293 A6 and B14 stable cells, a 6 fold increase was found for either clone
versus pS cells (0.043 ± 0.0004 in pS, 0.276 ± 0.02A6 in A6 and 0.298 ± 0.008 in B14;
6.36 fold in A6 vs pS, 6.87 fold in B14 vs pS) (panel B in Fig 47). The increase in NFkB
binding activity was confirmed in seven different and independent experiments.
Also in stably transfected 4/5 A2 clone compared to 4/5 control cells the increase in
NFkB binding activity was confirmed: the luciferase activity was 0.0031 ± 0.0023 in 4/5
and 0.0117 ± 0.0001 in A2 cells (3.84 fold increase in A2 vs 4/5) (panel C in Fig 47).
These results strongly indicated that FC1 depletion caused a marked increase in NFkB
DNA binding activity, likely indicating in FC1(-) cells an increase in NFkB signaling
siPKHD1 A
siPKHD1 B
β-G 0,010
Figure 47. NFkB binding activity in FC1-depleted HEK293 and 4/5 cells. A) Increase in luciferase reporter gene activation was evaluated in transiently transfected HEk293 cells after 1%FBS stimulation for 24 h (31.88 fold increase in siPKHD1A-transfected vs pS-transfected cells, 16.60 fold increase in siPKHD1B vs pS-transfected cells). B) FBS induced luciferase activity in stable transfected pS, A6 and B14 cells. A six fold increase in A6 and B14 cells compared to control cells was found (6.36 in A6 and 6.87 in B14 vs pS) (data from seven independent experiments). C) Luciferase activity in 4/5 control and A2 stably suppressed cells; after 24 h of 1% FBS treatment A2 cells demonstrated an increase in gene reporter activity (3.84 in A2 vs pS). Data were normalized for transfection efficiency by cotransfecting β-galactosidase expression vector.
Moreover, NFkB binding activity in FC1(-) cells was dependent on FBS incubation time.
While 14 or 24 h treatment with 1% FBS did not changed luciferase activity in pSuper
control cells (the ratio between 24 and 14 h values was 0.96), in A6 and B14 cells the
24 h treatment caused a clear increase in NFkB activity compared to 14 h treatment
(approximately 1.3 and 1.7 fold increase after 24 h in A6 and B14 values compared to
those after 14 h) (Fig 48).
se activi
Relative l
1% FBS 14 h
1% FBS 24 h
Figure 48. Effect of FBS incubation time on NFkB binding activity. A slightly increase was observed mainlly after 24 h of treatment both in A6 and B14 cells (4.33 in A6 vs pS and 6.05 in B14 vs pS). After 24 h the NFkB activity in pS control cells was compared to that evaluated after 14 h incubation (0.96 pS 24h vs pS 14h).
This observation indicated that the increase in NFkB activity that was dependent on
FC1-depletion was also associated to the FBS treatment.
The cytokine TNF-α induces activation of NFkB and thus impeding the TNF-α-induced
apoptosis by activation of anti-apoptotic gene transcription. So this treatment was
performed to investigate the role of NFkB in FC1(-). As expected, TNF-α treatment
induced a significative activation of NFkB in control cells with a great increase of DNA
binding activity (3.42 ± 0.96 SE fold increase in pS, **p=0.008), while there was no such
effect in A and B suppressed clones (0.906 ± 0.095 SE fold increase in A6 and 1.117 ±
0.084 SE fold increase in B14) (Fig.49).
The lack of TNF-α-dependent stimulation of NFkB binding activity in FC1(-) cells could
be related to their high basal level. Alternatively, this lack of effect could reflect a
condition of deregulation of TNF-R1 and its related pathway in FC1(-) cells.
(+)TNF-α
(+)TNF-α
(+)TNF-α
Figure 49. Effect of TNF-α treatment on NFkB DNA binding activity. The cytokine TNF-α induced activation of transcription factor NFkB only in pSuper control cells, while in FC1(-) cells this activity remained unchanged (pS(+) vs pS(-), **p=0.008).
This treatment did not clarify the possible role of NFkB in FC1(-) HEK293 cells, but
likely evidenced an exacerbated condition. So in HEK293 cells parthenolide, an inhibitor
of NFkB through inactivation of IkB, was employed in association with TNF-α. The
combination of parthenolide and TNF-α was effective in inhibiting NFkB binding activity
in both control and FC1(-) cells.
se activi
relative l
(+)TNF (+) Part
(+)TNF (+) Part
(+)TNF (+) Part
Figure 50. Effect of parthenolide pre-incubation on TNF-α dependent NFkB-luciferase activity. Parthenolide reduced modestly the effect of TNF-α in pSuper, while markedly decreased that in A6 and in B14 cells.
In particular, in control cells, the incubation with parthenolide before TNF-α treatment
slightly, but not significantly, reduced the TNF-α-induced NFkB activity that, however,
still remained higher than in untreated control cells. In FC1(-) cells the pre-incubation
with parthenolide caused a decrease in NFkB binding activity that reached values
significantly lower than those of untreated FC1(-) cells (Fig 50). Since parthenolide
specifically blocks the degradation of IkB, this inhibitor should be important in the TNF-
α −dependent and -independent activation of NFkB in control cells, but especially in the
TNF-α -independent activation in FC1(-) cells.
5.5 NFkB-p65 localization in HEK 293 cells
To further investigate NFkB activation in FC1(-) cells, its cellular localization was
analyzed in cells transfected with a recombinant plasmid expressing a NFkB p65
subunit conjugated to the GFP protein. In presence of 1% FBS a different distribution of
the fluorescent green staining was observed between control and FC1(-) cells (Fig 51).
Figure 51. NFkB p65-GFP localization in HEK293 cells maintained in 1% FBS. In pS control cells the cytoplasmic positivity was prevalent (only one cell demonstrated a positive nucleus (white arrow)), while in A6 and B14 cells the nuclear positivity was demonstrated in some more cells (white arrow). A puntiform and strong positivity mainly in a perinuclear (likely endoplasmic reticular) position (red arrow) was notable.
Nuclei of pS control cells appeared predominantly quite dark demonstrating a very low
nuclear localization of NFkB-GFP (white arrows of Fig 51), while nuclei appeared less
dark in A6 and B14 and some was markedly fluorescent. Furthermore, in FC1(-) cells
the NFkB-GFP also appeared as a granulated network surrounding the nucleus (red
arrows of Fig 51). This phenomenon could result from an accumulation of NFkB-GFP in
the endoplasmatic reticulum, or from NFkB sequestration/aggregation in high molecular
mass conjugates.
When cells were maintained in MEM/0.4% BSA for 48 h, a prevalence of the NFkB-GFP
aggregated forms was also demonstrated in pS control cells (red arrows in Fig 52),
while in A6 and B14 cells the NFkB fluorescence remained in part aggregated and in
part distributed in the cytoplasm.
Figure 52. NFkB p65-GFP localization in HEK293 maintained in 0.4% BSA starvation medium. Red arrows indicated aggregation of p65 in perinuclear position both in pSuper control cells and in FC1(-) clones.
Differences in nuclear staining between pS and FC1(-) cells were less evident than in
1% FBS culture (Fig 52). The addition of 1% FBS caused a redistribution of NFkB
localization in aggregated manner in A6 and B14 clones and no changes in control cells
(data not shown).
5.6 p65 (RELA) undergoes to increased turnover in FC1(-) HEK293 cells
In order to look for possible changes in NFkB expression in FC1(-) cells, levels of p65
(RELA), a subunity that constitutes the transcriptional factor NFkB, were evaluated in
total cell lysates by western blot analysis (Fig 53). The p65 expression level, evaluated
in different experiments, was not substantially changed in FC1(-) A and B compared to
control cells (panel A in Fig 53). Nevertheless, a different level of p65-positive bands
migrating either to lower or higher speed was observed between pS control and FC1(-)
cells (panel A and B in Fig 53). This positivity was higher in A6 and B14 cells, and
slightly more evident (even in control cells) in presence of the apoptotic inducer TNF-α
(15 ng/ml) alone or in combination with parthenolide (10µM), an inhibitor of the NFkB
(-) Part TNF-α P+T
(-) Part TNF-α P+T
(-) Part TNF-α P+T (-) Part TNF-α P+T
Ponceau Red
Figure 53. Western blotting analysis of p65 (RELA) in HEK293 cells. Cells were in presence of 1% FBS (A) or in absence of FBS (-), in presence of 10µM partenolide (Par) and 15ng/ml TNF-α, alone or in combination (B), as described in methods. The p65 expression level was not substantially different between cells, while in FC1(-) clones the p65 positive bands at higher and lower molecular weigh were more marked. Levels of p65 were compared to β-tubulin levels or to the content of Ponceau red staining.
The faster p65 positive bands could correspond to processed peptides; the slower
bands could be due to dimeric/oligomeric forms like p110 (Burstein E and Duckett CS,
2003), or other high molecular weight complexes that co-migrate with p65 subunits,
putatively including the aggregated forms detected in FC1 deficient NFkB-GFP
expressing cells. If this were the case, NFkB could be over-expressed and undergo an
elevated turnover in FC1(-) cells without changing the overall amount of the protein.
5.7 Effects of parthenolide on cell survival and cell death in HEK293 and 4/5
tubular epithelial cells
The initial studies of NFkB suggested its impairment or disregulation in FC1(-) cells,
which could play a pivotal role in their destiny. Thus, to further investigate the role of
NFkB signaling, the effect of NFkB inhibitor parthenolide (that inhibits IKK, the IkB
inhibitor kinase) was more closely investigated. Initially, the possible toxicity of the
inhibitor was checked by analysing 1% FBS-induced cell proliferation in both HEK293
and 4/5 cells after 2 and 6 h treatment.
Figure 54. Parthenolide effects on cell proliferation in HEK293 and 4/5 tubular epithelial cells. A) In HEK293 cells, after 6 hours the growth of control and A6 cells was decreased by 10µM parthenolide. B) In 4/5 cells, the inhibitory effect of parthenolide on cell proliferation was higher in control than in A2 FC1(-) cells.
In HEK293 cells, parthenolide induced a slight decrease in cell proliferation which was
already evident after 6 hours of incubation both in pS control and in FC1(-) A6 cells
(after 6 h, 0.85 and 0.89 was the ratio between cell number in treated vs untreated pS
and A6 cells, respectively). Nevertheless, after 6 h the parthenolide-dependent
reduction in cell proliferation was less evident in A6 than in control cells (see green
slops in panel A of Fig 54).
In 4/5 tubular epithelial cells the inhibitory effect of parthenolide on cell proliferation was
more evident than in HEK293 cells. In particular, after 6 h treatment the proliferation of
4/5 control cells was almost blocked (0.69 the ratio between treated and untreated cell
number), while A2 FC1(-) cells kept on growing (0.78 the ratio between treated and
untreated cells) (see green slops in panel B of Fig 54).
In order to associate the parthenolide-dependent decrease in cell proliferation to a
reduced NFkB pathway, NFkB binding activity was investigated in cells pre-treated with
se activi 1,5
Relative l
(+) parth
(+) parth
(+) parth
Figure 55. Effect of parthenolide on NFkB binding activity in HEK293 cells. In control cells the DNA binding activity was increased, though not significantly, after treatment with the NFkB inhibitor, while a slight decrease was observed in both A and B clones.
An opposite effect was observed comparing control and FC1(-) cells: the parthenolide
treatment could increase luciferase reporter activity in pS (1.81 ± 1.54 the ratio between
the activity in treated vs untreated pS cells), while in A6 and B14 cells parthenolide
decreased such activity (0.771 ± 0.35 and 0.683 ± 0.44 the ratios between treated and
untreated A6 and in B14 cells, respectively) (Fig 55). These results therefore
demonstrated that parthenolide did not suppress basal NFkB activity in control cells,
while it was able to inhibit the NFkB pathway in FC1(-) cells.
Therefore, the observed decrease in cell proliferation by parthenolide could be
consistent with the activation of apoptosis in a NFkB-independent pathway in control
cells and depletion of pro-survival/anti-apoptotic role of NFkB activity in FC1(-) cells. In
particular, the higher binding activity of NFkB in FC1(-) cells could explain their lower
response to parthenolide-dependent growth inhibition. Alternatively, the same result
may be explained by a prevalence of a pro-apoptotic role of NFkB in FC1(-) cells.
The effect of parthenolide on cell death was therefore evaluated by counting trypan blue
positive cells after 12 h culture (Fig 56).
Figure 56. Parthenolide effect on cell death. The NFkB inhibitor induced a great increase in trypan blue stained cells in control (pS), but not in FC1(-) A6 and B14 cells after 12h culture in MEM/1%FBS.
In control cells parthenolide induced a marked increase in trypan blue positive cells that
was not observed in A and B cells. Compared to the critic effect of pathenolide in cell
death in control cells, in FC1(-) clones the inhibitor of NFkB was not so effective,
supporting the hypothesis of an additional pro-apoptotic role of NFkB in these cells.
Then, the effect of parthenolide on apoptosis was evaluated in HEK293 cells by
measuring apoptotic index after Hoechst 33258 staining and by caspase-3 assay.
Figure 57. Partenolide effect on apoptotic index in HEK293 cells. Apoptotic index was measured by Hoechst 33258 staining in cells treated with 10µM parthenolide for 1h, as described in the method section. The staining was significatively increased in pSuper control and in A&B FC1(-) clones (mean of A6 and B14 apoptotic index) (pS(-) 1±0.069, pS(+) 3.939±1.168, **p=0.008) (A&B(-) 1±0.116, A&B(+) 2.226±0.825, **p=0.005). 0.565 is the ratio between relative values in A&B(+) vs pS(+), (*p=0.025).
Apoptotic index was significantly increased by parthenolide in pSuper control cells
(3.939 ± 1.168 times higher than in untreated cells, **p=0.008), as well as it was
increased in FC1(-) cells (2.226 ± 0.825 times higher than in untreated A&B (the mean
of A6 and B14 values, **p=0.005). Nevertheless, the lower response of FC1(-) cells to
parthenolide, almost reduced to a half compared to control cells (0.565, A&B(+) vs
pS(+), *p=0.025) (Fig 57) strongly indicated that control cells were more susceptible to
apoptosis than FC1(-) cells.
The different response of FC1(-) cells to parthenolide-induced cell death shown by
Hoechst 33258 staining was confirmed by analysis of caspase-3 activity. In particular,
parthenolide induced an increase in caspase-3 activity in HEK293 control cells (1.34
fold higher in treated vs untreated pS cells). On the contrary, parthenolide slightly
reduced caspase-3 activity in A6 FC1(-) cells (0.90 fold in treated vs untreated A6 cells).
Similarly in 4/5 cells, the caspase-3 activity was increased by parthenolide in control
cells, but was reduced in A2 FC1(-) cells (1.36 fold in 4/5(+) vs 4/5(-), 0.76 A2(+) vs
A2(-)) (Fig 58). Moreover in FC1(-) 4/5 cells the effect of parthenolide was more evident
compared to FC1(-) HEK293 cells.
(+) Parth
(+) Parth
(+) Parth
(+) Parth
Figure 58. Effect of parthenolide on caspase-3 activity in HEK293 and 4/5 tubular epithelial cells. A) In HEK293 Parthenolide induced an increase in caspase-3 activation in control cell and in A6 silenced clone this activity was reduced (1.34 pS(+) vs pS(-); 0.90 A6(+) vs A6(-)). B) Parthenolide induced a comparable increase in caspase-3 activity in 4/5 control cell respect to HEK293, in A2 silenced clone the decrease of caspase-3 kinetic was more evidenced (1.36 4/5(+) vs 4/5(-), 0.76 A2(+) vs A2(-)).
Taken together these results showed in both HEK293 and 4/5 control cells that
parthenolide induced an increase in apoptosis. On the contrary, in cells depleted of FC1
the increase in apoptosis did not occur. The lower response to apoptosis in
parthenolide-treated FC1(-) cells further suggest that NFkB could play a pro-apoptotic
role in these cells.
In that case, parthenolide should have induced an increase in a prosurvival pathway in
FC1(-) cells. To test this hypothesis, the effect of parthenolide on the activity of the pro-
survival 42/44 ERK was analyzed in FC1(-) cells (Fig 59).
(-) Part TNF-α P+T (-) Part TNF-α P+T
(-) Part TNF-α P+T
Figure 59. Signaling analysis through western blotting assay in HEK293. A) Ponceau red, samples were loaded onto 10% acrylamide SDS-PAGE. B) Anti 42/44 MAPK antibody was used to evaluate the expression of phosphorylated and non-phosphorylated forms of ERK proteins under different conditions.
In basal condition, as already observed, p-ERK levels were higher in control than in
FC1(-) cells. In control cells, the treatment with either parthenolide alone or in
combination with TNF-α produced an increase in ERK phosphorylation that may
represent a cell reaction to the apoptotic stimulus of these drugs. On the contrary, in
FC1(-) cells only the treatment with parthenolide appeared to increase ERK
phosphorylation, while its combination with TNF-α markedly reduced this effect (panel
B in Fig 59). This result again demonstrated the reduced ERK activation/signaling in
FC1(-) cells compared to control cells, not only in basal conditions, but also in presence
of either parthenolide or TNF-α . It is, however, noteworthy that the parthenolide
treatment did increase ERK activity in FC1(-) cells. This observation therefore was
again consistent with a pro-apoptotic activity of NFkB in these cells. Furthermore, the
ERK phosphorylation was strongly inhibited by the combined treatment in FC1(-) cells,
indicating that the attenuation of NFkB activity dramatically changed the role of TNF-α
on the ERK pathway in these cells.
DISCUSSION
The mapping of PKHD1, the gene involved in ARPKD, on chromosome 6
occurred recently in 1995 (Guay-Woodford et al, 1995) and seven years later, the
PKHD1 protein product FC1 was characterized at the same time by two different groups
(Ward et al, 2002; Onuchic et al, 2002). Previous studied to characterize ARPKD cell
features were based on animal model derived by spontaneous mutations that simulated
the phenotypic characteristics of ARPKD or on ARPKD patients renal tissues. In the last
years some progress has been made in understanding the function of FC1 also by
using the siRNA interfering strategy on "in vitro" cell models (Mai et al, 2005; Yang et al,
2007). Thanks to this advantage new highlights on FC1 were discovered. For example,
it was understood that FC1 could be involved in the regulation of different cellular
processes including cell proliferation, cell death, calcium homeostasis and signaling.
Downregulation of FC1 in the mouse IMDC silenced cells was, in fact, accompanied by
a decrease in cell proliferation and consequent increase in cell death (Mai et al, 2005).
Moreover, a link was established between FC1 and PC2, a calcium channel protein
involved in ADPKD, on the regulation of intracellular calcium (Wu et al, 2006) and also
with CAML, an other protein involved in calcium signaling (Nagano et al, 2005). These
observations were consistent with the results of our study obtained by down regulating
the human FC1 expression with two different siRNA interfering plasmids in two different
renal human cell systems, HEK293 and 4/5 tubular epithelial cells.
Because of the complex pattern of PKHD1 alternative splicing (Bergmann et al, 2004),
numerous RNA isoforms could be produced with different functions; so, we produced
two siRNA oligonucleotides (A and B) localized on two different exons of the gene,
possibly affecting different RNA transcripts and causing cellular effects different in A
Both the two siRNA sequences were able to reduce FC1 expression even if the siRNA
A, targeting exon 6, was more efficient both in the number of produced clones and in
the percentage of reduction of PKHD1 expression. Because of the more effect on FC1
suppression we transfected only PKHD1 siRNA A expressing plasmid in 4/5 tubular
epithelial cells. We obtained a relative low number of silenced clones, likely because of
the very low transfection efficiency of this cell line.
Consistent with findings of Mai et al (2005) in mouse IMDC silenced cells, in both
HEK293 and 4/5 cells we demonstrated that loss of FC1 induced a reduction in cell
proliferation associated to an increase in cell death by apoptosis. Unexpectedly, the
decrease in cell proliferation was directly related to the percentage of FBS added in the
culture, indicating that FBS may contain some factor inhibiting cell proliferation and
survival in these cells.
ATP release was thought to be responsible for cyst volume expansion in ADPKD or
tubule dilatation in ARPKD, thus accelerating disease progression (Schwiebert et al
2002). We found that ATP treatment in HEK293 FC1(-) cells produced a slight increase
in cell proliferation, which was not observed in pSuper control cells. The ATP effect in
FC1(-) cells was also evident as a reduction in the number of dead cells. Thus, ATP
apparently blunted the inhibitory effect of FC1 suppression, but also showed that FC1(-)
cells, under particular stimuli, may have an abnormally increased proliferation rate, as
expected for the loss of a protein associated to a cystic disease.
In the literature EGF/EGFR axis overactivity was known to be important for
cystogenesis (Torres VE and Harris P, 2007). During the progression of our experiment
a group showed that the loss of FC1 could lead to abnormal cell proliferation by
modulating intracellular calcium via EGF/EGFR pathway in HEK293T cell line (Yang et
al, 2007). In particular, the stimulation with EGF through EGF receptor increased cell
growth by modulating ERK signaling.
We too treated HEK293 FC1(-) cells with two different concentrations of EGF and we
observed that lower EGF concentration did not induce a great increase in cell
proliferation in FC1(-) compared to control cells. Rather, the doubled dose (40 ng/ml)
slowed down the proliferation to the basal level, probably simulating the effect on cell
proliferation of serum containing EGF. Our different data in the same cell system could
be due to the different localization of the siRNA oligonucleotides used by Yang and co-
workers (exon 4 and exon 5) on PKHD1 gene and to the different alternatively spliced
forms silenced by siRNA interfering method. Otherwise, our culture conditions may be
responsible for these differences. It will be interesting to investigate whether FC1(-)
cells "in vitro" are able to produce by themselves factor/s to counteract the increased
proliferation that is typical of these cells "in vivo".
The observation of low adherence of FC1(-) cells, even increased by FBS and DMSO
treatment, is consistent with a role of FC1 on cell adhesion, as was also reported by Mai
and co-workers in IMDC mouse cell line (Mai et al, 2005). It is possible that the low
adherence to the plastic matrix by FC1 depletion could induce a response that requires
a slow down of cell survival in FC1(-) cells. The treatment with 0.2% DMSO
exacerbated the increase in trypan blue positive cells supporting a role of FC1 in cell
survival. The decrease in cell proliferation and survival in FC1(-) 4/5 cells reinforced the
data obtained in HEK293 cells demonstrating that the effects produced by loss of FC1
are independent on "in vitro" cell lines.
Consistent with the impaired cell proliferation of FC1(-) cells and the subcellular
localization of FC1 in basal body and centrosome, important for the correct mechanism
underling cell division (Wang et al, 2004), we found an alteration in the cell cycle that in
FC1(-) resulted in a decrease in the G2-M phase associated to an increase in G0/G1
phase. These data are consistent with cells that are unable to undergo cell division and
that have started programmed cell death.
Cell death for apoptosis is a typical biochemical feature of PKD pathology. In fact, PC1
induces a resistance to apoptosis (Boletta et al, 2000), and PKD1 suppressed cells are
more susceptible to programmed cell death (Banzi et al, 2006). Also FC1 could play an
important role in cell survival.
Both apoptotic indexes obtained by nuclei Hoechst staining and assaying caspase-3
activity confirmed that the loss of FC1 greatly increases these parameters in all tested
FC1(-) clones. This effect was present in absence of serum, and, when serum was
added, this effect was exacerbated. Consistently, UV, a typical treatment capable to
induce apoptosis in different cell types, greatly increased it in 4/5 FC1(-) cells.
FC1 interaction with other protein involved in calcium signaling such as PC2 (Wu et al,
2006) and CAML (Nagano et al, 2005), and even more its localization in cilia with
mechanosensation properties (Wang et al, 2004), could attribute to FC1 a role in
regulation intracellular calcium homeostasis.
We in fact demonstrated that PKHD1 downregulation was capable to increase the ATP-
evoked-calcium entry in cytoplasm of HEK293 cells and even more in 4/5 cells. The
increase in ATP-evoked calcium in FC1(-) cells is relevant mainly considering the
increased levels of ATP in cyst fluids and the likely increased activation of selective
pathways via purinergic receptors. The observation that this increase was associated to
cellular store opening may also be consistent with a redistribution of FC1-associated
channels, likely including PC2. The FC1 depletion in the cilium may allow the
endogenous PC2 to delocalize from the cilium to reticular membranes, where it is able
to function as a calcium store release channel (Koulen et al, 2002). PC2 abnormal
function could be therefore critical in FC1(-) cells.
On the other hand, the involvement of PC1, which is known to negatively control cell
proliferation and apoptosis, appears to be not relevant in the FC1(-) dependent cellular
features. A relation between deficiency of PC1, FBS-induced increase in cell
proliferation and increased calcium oscillations, was recently assessed in our group
(Aguiari et al, 2008 in press) in PKD1 silenced cells, which was reverted by
overexpression of PC1. The reduction in FBS-induced cell proliferation in FC1(-) cells
could therefore be dependent on an increased activation of the endogenous PC1. In
that case a decrease in the frequency of calcium oscillation and a reduction in cell
apoptosis should have been found.
Cystic proteins play an essential role in cell signaling, and the lack of their expression
was shown to impair different cellular processes. FC1 has been represented as a
membrane receptor that is capable to trasduce external signals in intracellular stimuli. In
particular, PC1, PC2 and FC1 appeared to regulate calcium-signaling pathways and
consequently cell activity such as proliferation and apoptosis.
An Increase in intracellular calcium could modulate the activity of different transcription
factors such NFAT and NFkB. Our group described the over-activity of NFAT in PC1(-)
cells (Aguiari et al, 2008 in press), and of NFkB in cells expressing the C-terminal tail of
PC1 (Banzi et al, 2006). In the same way we also found that in FC1(-) cells the NFAT
activity was increased, as well as the NFkB activity that we will discuss later.
Moreover, consistently with the reduction in cell proliferation and loss of survival signals,
a down-regulation of 42/44 kDa ERK pathway was observed in FC1(-) HEK293 cells.
However, even if an increased apoptosis was observed, expression of p53 was not
changed in FC1(-) cells This could probably due to the high level of p53 basal
expression in HEK293 investigated cells and differences in sublocalization and
phosphorylation levels should be further investigated. The fact that also the expression
of cycline dependent kinase inhibitor p21/WAF was not changed in FC1(-) cells
indicates that FC1 deficiency impairs only specific pathways possibly in specific cell
An important pathway that regulates cell proliferation and apoptosis is that controlled by
the transcription factor NFkB, which appeared particularly, activated in FC1(-) cells. An
increased activity of NFkB was also supported by a nuclear localization of P65-GFP,
which was prevalent, although low, in FC1(-) HEK293 compared to control cells.
Moreover, the highly fluorescent p65-GFP aggregates mainly observed in FC1(-) cells
could be caused not only by the increased activation of this protein in FC1(-) cells, but
also by stress conditions after serum deprivation as observed also in control cells.
Furthermore, in FC1(-) clones the aggregated localization of p65-GFP could be
interpreted as an increase in protein turnover by proteasome degradation, or retention
of the protein in endoplasmatic reticulum. The increase in protein turnover may be
consistent with results from NFkB-p65 immunoblot showing in fact immuno-positive
bands at higher and lower molecular weight prevalent in FC1(-) clones.
Interestingly, the regulation of NFkB activation appeared different between FC1(-) and
control cells. In particular, TNF-α that was able to increase NFkB activation in pS
control cells did not increase that in FC1(-) cells. It is likely that the activating TNF-α
stimulus in FC1(-) cells did not induce a further NFkB activation yet elevated in basal
condition. Otherwise, a negative regulatory feedback could be activated in these cells.
In the light of these results, our attention was focused on the possible pivotal role of
NFkB in FC1(-) cell features and consequently we studied the role of this transcription
factor by inhibiting its pathway with parthenolide, an inhibitor of the IkB by inhibiting
We found that in FC1(-) cells NFkB pathway was indeed inhibited by parthenolide
alone, while in control cells the inhibitor was effective only on TNF-α-induced NFkB
promoter activity. Therefore, the NFkB pathway appears to be regulated through the IkB
in FC1(-) cells.
Both the results of parthenolide on cell proliferation and cell death put in light the
possible role of NFkB as activator of pro-apoptotic genes near to the one of activator of
anti-apoptotic genes (Burstein E and Duckett CS, 2003) in FC1(-) cells which showed a
low responsiveness to the inhibitory effect of parthenolide on cell growth. Similarly,
FC1(-) cells showed a resistance to the stimulating effect of parthenolide on cell
apoptosis. Parthenolide treatment caused in FC1(-) cells, therefore, the loss of NFkB
pro-apoptotic effect rather than the pro-survival effect. This is further supported by the
observation that in FC1(-) cells pathenolide treatment caused an increase in the pro-
survival ERK pathway, which is basically inhibited in these cells.
TNF-α in combination with parthenolide induces death signals through activation of
death receptor and through inhibition of NFkB. In fact, their combination did produce a
positive synergic effect on ERK activation in control cells. However, this behavior did
not appear in FC1(-) clones, where, on the contrary, a strong inhibitory effect on ERK
activation was observed. This finding reveals that, under specific conditions, FC1(-)
cells are unable to respond to apoptotic stimuli through the ERK activation.
On the other hand, ERK activation was lower in FC1(-) cells in basal conditions,
consistent with their reduction in cell proliferation. This finding is apparently in contrast
with the increased cell proliferation typical of cystic cells. We could imagine that
because of the plasma membrane impairment, highlighted by the reduction in
adherence to the plastic matrix, FC1(-) cells could have other plasma membrane-
associated alterations. In particular, the observed reduction in cell proliferation "in vitro"
could be explained not only by the putative pro-apoptotic activity of NFkB, but also by a
downregulation of growth factor receptors at plasma membrane.
In conclusion, data presented in this thesis indicate that loss of FC1 by siRNA
interference in both HEK293 and 4/5 tubular epithelial cell models induces an
unbalance between cell proliferation and cell survival associated to deregulation of
NFkB and ERK signaling pathways (see cartoon in Fig 60). Since FC1 deficiency
modulates calcium homeostasis by increasing calcium release and activation of related
transcriptional factors such as NFAT, the altered calcium signal could be also
responsible for the activation of NFkB as previously observed in cells expressing the C-
terminal tail of PC1 (Banzi et al, 2006).
In the last years, activation of NFkB has become almost synonymous with enhanced
cell survival, although more recent data suggests that this transcription factor plays a
more complex role in the regulation of cell death, playing thus a pivotal role in the
destiny of living cells (Burstein E and Duckett CS, 2003). Protection in cell survival and
cell death after treatment with NFkB inhibitor parthenolide played in favors of a pro-
apoptotic role of NFkB in FC1(-) cells.
Further analysis had to be made in FC1(-) cells to unequivocally attribute to NFkB the
pro-apoptotic role and to understand how the loss of FC1 may cause NFkB over-
activity, possibly through alteration of calcium homeostasis. With respect to this, the
relation between FC1 and other PKD-associated proteins including PC2 will need
further analysis.
The increased activity of NFkB in FC1(-) cells may deserves further interest because
tubulointerstitial fibrosis is thought now to be a key factor in progression of renal failure
in chronic nephropathies like PKD. Activation of NFkB in tubular cells is indeed of
importance in the process of interstitial inflammation due to secretion of some
proinflammatory mediators with formation of infiltrate and accumulation of interstitial
myofibroblasts--the main source of extracellular matrix (ECM) components. Moreover,
congenital hepatic fibrosis is caused by the loss of FC1 (Menezes LF and Onuchic LF,
2006). FC1(-) cells could therefore overproduce cytokines which could make worse not
only their own survival, but also may increase the proliferation of neighboring cells,
including other cells important for the fibrotic response. Given the cell type- and
stimulus-dependent effects of NFkB on the regulation of apoptosis, it will be of great
importance to further evaluate these pathways as NFkB inhibitors are developed for
therapeutic use.
Normal kidney cell
Cytoplasm
Normal cellular condition
ARPKD kidney cell
Cytoplasm
Decreased cell proliferation and
Increased apoptosis
Figure 60. Representative cartoon illustrating the role of NFkB and ERK signaling pathways in FC1(-) tubular cell.
REFERENCES
1. Adeva M, El-Youssef M, Rossetti S, Kamath PS, Kubly V, Consugar MB, Milliner DM,
King BF, Torres VE, Harris PC. Clinical and molecular characterization defines a
broadened spectrum of autosomal recessive polycystic kidney disease (ARPKD). Medicine
(Baltimore). 85: 1-21, 2006.
2. Aguiari G, Campanella M, Manzati E, Pinton P, Banzi M, Moretti S, Piva R, Rizzuto R
and del Senno L. Expression of polycystin-1 C-terminal fragment enhances the ATP-
induced Ca2+ release in human kidney cells. Biochem Biophys Res Commun. 301(3):
3. Aguiari G, Trimi V, Bogo M, Szabadkai G, Mangolini A, Pinton P, Witzgall R, Harris P,
Borea PA, Rizzuto R and del Senno L. Novel role for polycystin-1 in modulating cell
proliferation through calcium oscillations in kidney cells. Cell Prol. 2008, In Press.
4. Avidor-Reiss T, Maer AM, Koundakjian E, Polyanovsky A, Keil T, Subramaniam S and
Zuker CS. Decoding cilia function: defining specialized genes required for
compartmentalized cilia biogenesis. Cell. 117: 527–539, 2004.
5. Avner ED, Studnicki FE, Young MC, Sweeney WE Jr, Piesco NP, Ellis D and
Fettermann GH. Congenital murine polycystic kidney disease. The ontogeny of tubular
cyst formation. Pediatr Nephrol. 1(4): 587-596, 1987.
6. Badano JL, Teslovich T and Katsanis N. The centrosome in human genetic disease.
Nat Rev Genet. 6: 194–205, 2005.
7. Badano JL, Mitsuma N, Beales P L and Katsanis N. The ciliopathies: an emerging
class of human genetic disorders. Annu Rev Genomics Hum Genet. 7: 125–148, 2006.
8. Balda MS and Matter K. Epithelial cell adhesion and the regulation of gene expression.
Trends Cell Biol. 13: 310–318, 2003.
9. Banzi M, Aguiari G, Trimi V, Mangolini A, Pinton P, Witzgall R, Rizzuto R and del
Senno L. Polycystin-1 promotes PKCalpha-mediated NF-kappaB activation in kidney cells.
Biochem Biophys Res Commun. 350(2): 257-262, 2006.
10. Belibi FA, Reif G, Wallace DP, Yamaguchi T, Olsen L, Li H, Helmkamp GM Jr and
Grantham JJ. Cyclic AMP promotes growth and secretion in human polycystic kidney
epithelial cells. Kidney Int. 66(3): 964-973, 2004.
11. Bergmann C, Senderek J, Sedlacek B, Pegiazoglou I, Puglia P, Eggermann T, Rudnik-
Schneborn S, Furu L, Onuchic LF, De Baca M, Germino GG, Guay-Woodford L, Somlo S,
Moser M, Buttner R, and Zerres K. Spectrum of mutations in the gene for autosomal
recessive polycystic kidney disease (ARPKD/PKHD1), J. Am. Soc. Nephrol. 14(1): 76–89,
12. Bergmann C, Senderek J, Schneider F, Dornia C, Ku¨pper F, Eggermann T, Rudnik-
Scho¨neborn S, Kirfel J, Moser M, Bu¨ttner R, Zerres K. PKHD1 mutations in families
requesting prenatal diagnosis for autosomal recessive polycystic kidney disease (ARPKD).
Hum Mutat. 23: 487–495, 2004.
13. Bernstein J and Slovis TL. Polycystic diseases of the kidney. In: Edelmann C (ed)
Pediatric Kidney Diseases. Little, Brown, Boston, 1139–1157, 1992.
13. Berridge MJ, Bootman MD and Lipp P. Calcium--a life and death signal. Nature. 395:
14. Bluteau O, Jeannot E, Bioulac-Sage P, Marqués JM, Blanc JF, Bui H, Beaudoin JC,
Franco D, Balabaud C, Laurent-Puig P and Zucman-Rossi J. Bi-allelic inactivation of TCF1
in hepatic adenomas. Nat Genet. 32(2): 312-315, 2002.
15. Boletta A, Qian F, Onuchic LF, Bhunia AK, Phakdeekitcharoen B, Hanaoka K,
Guggino W, Monaco L and Germino GG. Polycystin-1, the gene product of PKD1, induces
resistance to apoptosis and spontaneous tubulogenesis in MDCK cells. Mol Cell. 6(5):
1267-1273, 2000.
16. Boletta A and Germino GG. Role of policystins in renal tubologenesis. Trends Cell
Biol. 13: 484–492, 2003.
17. Bork P, Doerks T, Springer TA and Snel B. Domains in plexins: links to integrins and
transcription factors. Trends Biochem Sci. 24: 261–263, 1999.
18. Bram RJ and Crabtree GR. Calcium signaling in T cells stimulated by a cyclophilin B
binding protein. Nature. 371: 355–358, 1994.
19. Brown NE and Murcia NS. Delayed cystogenesis and increased ciliogenesis
associated with the re-expression of polaris in Tg737 mutant mice. Kidney Int. 63: 1220-
20. Brummelkamp TR, Bernards R and Agami R. A system for stable expression of short
interfering RNAs in mammalian cells. Science. 296(5567): 550-553, 2002.
21. Burstein E and Duckett CS. Dying for NF-kappaB? Control of cell death by
transcriptional regulation of the apoptotic machinery. Curr Opin Cell Biol. 15(6): 732-737,
22. Chiu MG. Johnson TM, Woolf AS, Dahm-Vicker EM, Long DA, Guay-Woodford L,
Hillman KA, Bawumia S, VennerK, R. Hughes C, Poirier F, and Winyard PJD. Galectin-3
associates with the primary cilium and modulates cyst growth in congenital polycystic
kidney disease. Am J Pathol. 169(6): 1925-1938, 2006.
23. Clarke LL, Grubb BR, Gabriel SE, Smithies O, Koller BH and Boucher RC. Defective
epithelial chloride transport in a gene-targeted mouse model of cystic fibrosis. Science.
257(5073): 1125-1128, 1992.
24. Cole DG, Diener DR, Himelblau AL, Beech PL, Fuster JC and Rosenbaum JL.
Chlamydomonas kinesin-II-dependent intraflagellar transport (IFT): IFT particles contain
proteins required for ciliary assembly in Caenorhabditis elegans sensory neurons. J Cell
Biol. 141(4): 993-1008, 1998.
25. Cole DG. Kinesin-II, the heteromeric kinesin. Cell Mol Life Sci. 56: 217–226, 1999.
26. Coles HSR, Burne JF and Raff MC. Large-scale normal cell death in the developing
rat kidney and its reduction by epidermal growth factor. Development. 118: 777-784, 1993
Cowen L, Bradley P, Menke M, King J and Berger B. Predicting the beta-helix fold
from protein sequence data. J Comput Biol. 9: 261-276, 2002.
28. Dabdoub A and Kelley MW. Planar cell polarity and a potential role for a Wnt
morphogen gradient in stereociliary bundle orientation in the mammalian inner ear. J
Neurobiol. 64: 446–457, 2005.
29. Davis ID, Ho M, Hupertz V and Avner ED. Survival of childhood polycystic kidney
disease following renal transplantation: the impact of advanced hepatobiliary disease.
Pediatr Transplant. 7(5): 364-369, 2003.
30. Dell K and Avner E. Autosomal recessive polycystic kidney disease gene reviews;
genetic disease online reviews at gene tests-gene clinics. University of Washington,
31. Dell K, McDonald R, Watkins SL, Avner ED. Polycystic kidney disease. In: Avner ED,
Harmon WE, Niaudet P (eds) Pediatric Nephrology. Lippincott Williams & Wilkins,
Philadelphia, 675–699, 2004.
32. El Zein L, Omran H and Bouvagnet P. Lateralization defects and ciliary dyskinesia:
lessons from algae. Trends Genet. 19: 162–167, 2003.
33. Esteban MA, Harten SK, Tran MG and Maxwell PH. Formation of primary cilia in the
renal epithelium is regulated by the von Hippel-Lindau tumor suppressor protein. J Am Soc
Nephrol.17: 1801-1806, 2006.
34. European Polycystic Kidney Disease Consortium. The polycystic kidney disease 1
gene encodes a 14 kb transcript and lies within a duplicated region on chromosome. Cell.
77: 881–894, 1994.
35. Feng P, Park J, Lee B, Lee SH, Bram RJ and Jung JU. Kaposi's sarcoma associated
herpes virus mitochondrial K7 protein targets a cellular calcium modulating cyclophilin
ligand to modulate intracellular calcium concentration and inhibit apoptosis, J Virol. 76:
11491–11504, 2002.
36. Fick GM, Johnson AM, Hammond WS and Gabow PA. Causes of death in autosomal
dominant polycystic kidney disease. J Am Soc Nephrol. 5: 2048–2056, 1995.
37. Fischer E, Legue E, Doyen A, Nato F, Nicolas JF, Torres V, Yaniv M and Pontoglio M.
Defective planar cell polarity in polycystic kidney disease. Nature Genetics. 38: 21–23,
38. Fowkes ME and Mitchell DR. The role of preassembled cytoplasmic complexes in
assembly of flagellar dynein subunits. Mol Biol Cell. 9: 2337– 2347, 1998.
39. Furu L, Onuchic LF, Gharavi A, Hou X, Esquivel EL, Nagasawa Y, Bergmann C,
Senderek J, Avner E, Zerres K, Germino GG, Guay-Woodford LM and Somlo S. Milder
presentation of recessive polycystic kidney disease requires presence of amino acid
substitution mutations. J Am Soc Nephrol. 14: 2004–2014, 2003.
40. Gabow PA. Autosomal dominant polycystic kidney disease. New Eng J Med. 329:
332–342, 1993.
41. Garcia-Gonzalez MA, Menezes LF, Piontek KB, Kaimori J, Huso DL, Watnick T,
Onuchic LF, Guay-Woodford LM and. Germino GG. Genetic interaction studies link
autosomal dominant and recessive polycystic kidney disease in a common pathway. Hum
Mol Genet. 16(16): 1940–1950, 2007.
42. Gattone VH 2nd, Ricker JL, Trambaugh CM, Klein RM. Multiorgan mRNA
misexpression in murine autosomal recessive polycystic kidney disease. Kidney Int. 62(5):
1560-1569, 2002.
43. Gattone VH 2nd, Wang X, Harris PC and Torres VE. Inhibition of renal cystic disease
development and progression by a vasopressin V2 receptor antagonist. Nat Med. 9: 1323–
44. Gattone VH 2nd, Tourkow BA, Trambaugh CM, Yu AC, Whelan S, Phillips CL, Harris
PC, Peterson RG. Development of multiorgan pathology in the wpk rat model of polycystic
kidney disease. Anat Rec A Discov Mol Cell Evol Biol. 277(2): 384-395, 2004.
45. Grantham JJ. The etiology, pathogenesis, and treatment of autosomal dominant
polycystic kidney disease: recent advances. Am J Kidney Dis. 28: 788–803, 1996.
46. Gresh L, Fischer E, Reimann A, Tanguy M, Garbay S, Shao X, Hiesberger T, Fiette L,
Igarashi P, Yaniv M and Pontoglio M. A transcriptional network in polycystic kidney
disease. EMBO J. 23: 1657-1668, 2004.
47. Guan KL, Figueroa C, Brtva TR, Zhu T, Taylor J, Barber TD and Vojtek AB. Negative
regulation of the serine/threonine kinase B-Raf by Akt. J Biol Chem. 275: 27354–27359,
48. Guay-Woodford LM, Muecher G, Hopkins SD, Avner ED, Germino GG, Guillot AP,
Herrin J, Holleman R, Irons DA, Primack W, et al. The severe perinatal form of autosomal
recessive polycystic kidney disease maps to chromosome 6p21.1-p12: implications for
genetic counseling. Am J Hum Genet. 56(5): 1101-1107, 1995.
49. Guay-Woodford LM and Desmond RA. Autosomal recessive polycystic kidney
disease: the clinical experience in North America. Pediatrics. 111: 1072–1080, 2003.
50. Guo S, Lopez-Ilasaca M and Dzau VJ. Identification of calcium modulating cyclophilin
ligand (CAML) as transducer of angiotension II-mediated nuclear factor of activated T cells
(NFAT) activation. J Biol Chem. 280: 12536–12541, 2005.
51. Haraguchi K, Hayashi T, Jimbo T, Yamamoto T and Akiyama T. Role of the kinesin-2
family protein, KIF3, during mitosis. J Biol Chem. 281: 4094–4099, 2005.
52. Harper JW, Adami GR, Wei N, Keyomarsi K and Elledge SJ. The p21 Cdk-interacting
protein Cip1 is a potent inhibitor of G1 cyclin-dependent kinases. Cell. 75: 805-816, 1993.
53. Harper JA, Yuan JS, Tan JB, Visan I and Guidos CJ. Notch signaling in development
and disease. Clin Genet. 64: 461–472, 2003.
54. Harris PC and Rossetti S. Molecular genetics of autosomal recessive polycystic kidney
disease. Mol Genet Metab. 81: 75-85, 2004.
55. Haycraft CJ, Swoboda P, Taulman PD, Thomas JH and Yoder BK. The C. elegans
homolog of the murine cystic kidney disease gene Tg737 functions in a ciliogenic pathway
and is disrupted in osm-5 mutant worms. Development. 128: 1493–1505, 2001.
56. Haycraft CJ, Banizs B, Aydin-Son Y, Zhang Q, Michaud EJ and Yoder K. Gli2 and Gli3
localize to cilia and require intraflagellar transport protein polaris for processing and
function. PLoS Genet. 1: e53, 2005.
57. He QY, Liu XH, Li Q, Studholme DJ, Li XW and Liang SP. G8: a novel domain
associated with polycystic kidney disease and non-syndromic hearing loss. Bioinformatics.
22(18): 2189-2191, 2006.
58. Hiesberger T, Bai Y, Shao X, McNally BT, Sinclair AM, Tian X, Somlo S and Igarashi
P. Mutation of hepatocyte nuclear factor-1beta inhibits Pkhd1 gene expression and
produces renal cysts in mice. J Clin Invest. 113: 814-825, 2004.
59. Hiesberger T, Shao X, Gourley E, Reimann A, Pontoglio M and Igarashi P. Role of the
hepatocyte nuclear factor-1beta (HNF-1beta) C-terminal domain in Pkhd1 (ARPKD) gene
transcription and renal cystogenesis. J Biol Chem. 280: 10578-10586, 2005.
60. Hiesberger T, Gourley E, Erickson A, Koulen P, Ward CJ, Masyuk TV, Larusso NF,
Harris PC and Igarashi P. Proteolytic cleavage and nuclear translocation of fibrocystin is
regulated by intracellular Ca2+ and activation of protein kinase C. J Biol Chem. 281(45):
34357-34364, 2006.
61. Higashiyama S, Iwamoto R, Goishi K, Raab G, Taniguchi N, Klagsbrun M, and
Mekada E. The membrane protein CD9/DRAP 27 potentiates the juxtacrine growth factor
activity of the membrane-anchored heparin binding epidermal growth factor-like growth
factor. J Cell Biol. 128: 929–938, 1995.
62. Hildebrandt F and Otto E. Cilia and centrosomes: a unifying pathogenic concept for
cystic kidney disease? Nat Rev Genet. 6: 928–940, 2005.
63. Hogan MC, Griffin MD, Rossetti S, Torres VE, Ward CJ and Harris PC. PKHDL1, a
homolog of the autosomal recessive polycystic kidney disease gene, encodes a receptor
with inducible T lymphocyte expression. Hum Mol Genet. 12: 685-698, 2003.
64. Holloway MP and Bram RJ. A hydrophobic domain of Ca2+-modulating cyclophilin
ligand modulates calcium influx signaling in T lymphocytes. J Biol Chem. 271(15): 8549–
65. Holloway MP and Bram RJ. Co-localization of calcium-modulating cyclophilin ligand
with intracellular calcium pools. J Biol Chem. 273(26): 16346–16350, 1998.
66. Hou X, Mrug M, Yoder BK, Lefkowitz EJ, Kremmidiotis G, D'Eustachio PD, Beier DR
and Guay-Woodford LM. Cystin, a novel cilia-associated protein, is disrupted in the cpk
mouse model of polycystic kidney disease, J Clin Invest. 109: 533–540, 2002.
67. Huangfu D, Liu A, Rakeman AS, Murcia NS, Niswander L and Anderson KV.
Hedgehog signalling in the mouse requires intraflagellar transport proteins. Nature. 426:
68. Ibanez-Tallon I, Heintz N and Omran H. To beat or not to beat: roles of cilia in
development and disease. Hum Mol Genet .12: R27–R35, 2003.
69. Ibanez-Tallon I, Pagenstecher A, Fliegauf M, Olbrich H, Kispert A, Ketelsen UP, North
A, Heintz N, Omran H. Dysfunction of axonemal dynein heavy n chain Mdnah5 inhibits
ependymal flow and reveals a novel mechanism for hydrocephalus formation. Hum Mol
Genet. 13: 2133–2141, 2004.
70. Jafar TH, Stark PC, Schmid CH, Strandgaard S, Kamper AL, Maschio G, Becker G,
Perrone RD, Levey AS. The effect of angiotensin converting-enzyme inhibitors on
progression of advanced polycystic kidney disease. Kidney Int. 67: 265–271, 2005.
71. Johnson KA and Rosenbaum JL. Polarity of flagellar assembly in Clamydomonas. J
Cell Biol. 119: 1605-1611, 1992.
72. Kahl CR and Means AR. Regulation of cell cycle progression by calcium/calmodulin-
dependent pathways. Endocr Rev. 24: 719–736, 2003.
73. Kaimori J, Nagasawa Y, Menezes LF, Garcia-Gonzalez M, Deng J, Imai E, Onuchic
LF, Guay-Woodford L and Germino GG. Polyductin undergoes notch-like processing and
regulated release from primary cilia. Hum Mol Genet. 16, 942–956, 2007.
74. Kaplan BS, Fay J, Shah V, Dillon MJ, Barratt TM. Autosomal recessive polycystic
kidney disease. Pediatr Nephrol. 3: 43–49, 1989.
75. Koulen P, Cai Y, Geng L, Maeda Y, Nishimura S, Witzgall R, Ehrlich BE and Somlo S.
Polycystin-2 is an intracellular calcium release channel. Nat Cell Biol. 4(3): 191-197, 2002.
76. Lager DJ, Qian Q, Bengal RJ, Ishibashi M and Torres VE. The pck rat: a new model
that resembles human autosomal dominant polycystic kidney and liver disease. Kidney Int.
59: 126–136, 2001.
77. Landman N and Kim TW. Got RIP? Presenilin-dependent intramembrane proteolysis
in growth factor receptor signaling. Cytokine Growth Factor Rev. 15: 337–351, 2004.
78. Lanoix J, D'Agati V, Szabolcs M and Trudel M. Dysregulation of cellular proliferation
and apoptosis mediates human autosomal dominant polycystic kidney disease (ADPKD).
Oncogene. 13: 1153-1160, 1996.
79. Li Y, Wright JM, Qian F, Germino GG and Guggino WB. Polycystin 2 interacts with
type I inositol 1,4,5-trisphosphate receptor to modulate intracellular Ca2+ signaling. J Biol
Chem. 280: 41298–41306, 2005.
80. Lin F, Hiesberger T, Cordes K, Sinclair AM, Goldstein LS, Somlo S and Igarashi P.
Kidney-specific inactivation of the KIF3A subunit of kinesin-II inhibits renal ciliogenesis and
produces polycystic kidney disease. Proc Natl Acad Sci USA. 100: 5286–5291, 2003.
81. Liu W, Murcia NS, Duan Y, Weinbaum S, Yoder BK, Schwiebert E and Satlin LM.
Mechanoregulation of intracellular Ca2+ concentration is attenuated in collecting duct of
monocilium-impaired orpk mice. Am J Physiol Renal Physiol. 289: F978–F988, 2005.
82. Loghman-Adham M, Nauli SM, Soto CE, Kariuki B and Zhou J. Immortalized epithelial
cells from human autosomal dominant polycystic kidney cysts. Am J Physiol Renal
Physiol. 285(3): F397-412, 2003.
83. Lubarsky B and Krasnow MA. Tube morphogenesis: making and shaping biological
tubes. Cell. 112: 19–28, 2003.
84. Lutz MS and Burk RD. Primary cilium formation requires von Hippel-Lindau gene
function in renal-derived cells. Cancer Res. 66: 6903-6907, 2006.
85. Mai W, Chen D, Ding T, Kim I, Park S, Cho S, Chu JS, Liang D, Wang N, Wu D, Li S,
Zhao P, Zent R and Wu G. Inhibition of Pkhd1 impairs tubulomorphogenesis of cultured
IMCD cells. Mol Biol Cell. 16: 4398–4409, 2005.
86. Manzati E, Aguiari G, Banzi M, Manzati M, Selvatici R, Falzarano S, Maestri I, Pinton
P, Rizzuto R and del Senno L. The cytoplasmic C-terminus of polycystin-1 increases cell
proliferation in kidney epithelial cells through serum-activated and Ca(2+)-dependent
pathway(s). Exp Cell Res. 304(2): 391-406, 2005.
87. Masyuk TV, Huang BQ, Ward CJ, Masyuk AI, Yuan D, Splinter PL, Punyashthiti R,
Ritman EL, Torres VE, Harris PC and LaRusso NF. Defects in cholangiocyte fibrocystin
expression and ciliary structure in the PCK rat. Gastroenterology. 125: 1303-1310, 2003.
88. Masyuk TV, Huang BQ, Masyuk AI, Ritman EL, Torres VE, Wang X, Harris PC and
Larusso NF. Biliary dysgenesis in the PCK rat, an orthologous model of autosomal
recessive polycystic kidney disease. Am J Pathol. 165: 1719-1730, 2004.
89. Matter K and Balda MS. Signalling to and from tight junctions. Nat Rev Mol Cell Biol. 4:
225–236, 2003.
90. Menezes LF, Cai Y, Nagasawa Y, Silva AM, Watkins ML, Da Silva AM, Somlo S,
Guay-Woodford LM, Germino GG and Onuchic LF. Polyductin, the PKHD1 gene product,
comprises isoforms expressed in plasma membrane, primary cilium, and cytoplasm.
Kidney Int. 66: 1345–1355, 2004.
91. Menezes LF and Onuchic LF. Molecular and cellular pathogenesis of autosomal
recessive polycystic kidney disease. Braz J Med Biol Res. 39: 1537-1548, 2006.
92. Miki H, Setou M, Kaneshiro K and Hirokawa N. All kinesin superfamily protein, KIF,
genes in mouse and human. Proc Natl Acad Sci USA. 98: 7004–7011, 2001.
93. Mochizuki T, Wu G, Hayashi T, Xenophontos SL, Veldhuisen B, Saris JJ, Reynolds
DM, Cai Y, Gabow PA, Pierides A, Kimberling WJ, Breuning MH, Deltas CC, Peters DJ
and Somlo S. PKD2, a gene for polycystic kidney disease that encodes an integral
membrane protein. Science. 272: 1339–1342, 1996.
94. Montell C. Physiology, phylogeny, and functions of the TRP superfamily of cation
channels. Sci. STKE. (90) RE1, 2001.
95. Moser M, Pscherer A, Roth C, Becker J, Mücher G, Zerres K, Dixkens C, Weis J,
Guay-Woodford L, Buettner R and Fässler R. Enhanced apoptotic cell death of renal
epithelial cells in mice lacking transcription factor AP-2beta. Genes Dev. 11(15): 1938-
96. Moser M, Matthiesen S, Kirfel J, Schorle H, Bergmann C, Senderek J, Rudnik-
Schöneborn S, Zerres K and Buettner R. A mouse model for cystic biliary dysgenesis in
autosomal recessive polycystic kidney disease (ARPKD). Hepatology. 41: 1113-1121,
97. Moyer JH, Lee-Tischler MJ, Kwon HY, Schrick JJ, Avner ED, Sweeney WE, Godfrey
VL, Cacheiro JE, Wilkinson JE and Woychik RP. Candidate gene associated with a
mutation causing recessive polycystic kidney disease in mice. Science. 264: 1329–1333,
98. Munaron L, Distasi C, Carabelli V, Baccino FM, Bonelli G and Lovisolo D. Sustained
calcium influx activated by basic fibroblast growthfactor in Balb-C 3T3 fibroblasts. J
Physiol. 484: 557–566, 1995.
99. Murcia NS, Sweeney WE Jr and Avner ED. New insights into the molecular
pathophysiology of polycystic kidney disease. Kidney Int. 55(4): 1187-1197, 1999.
100. Murcia NS, Richards WG, Yoder BK, Mucenski ML, Dunlap JR and Woychik RP.
The Oak Ridge Polycystic Kidney (orpk) disease gene is required for left-right axis
determination. Development. 127: 2347–2355, 2000.
101. Nagano J, Kitamura K, Hujer KM, Ward CJ, Bram RJ, Hopfer U, Tomita K, Huang C
and Miller RT. Fibrocystin interacts with CAML, a protein involved in Ca2+ signaling.
Biochem Biophys Res Commun. 338: 880-889, 2005.
102. Nagasawa Y, Matthiesen S, Onuchic LF, Hou X, Bergmann C, Esquivel E,
Senderek J, Ren Z, Zeltner R, Furu L Avner E, Moser M, Somlo S, Guay-Woodford LM,
Buttner R, Zerres K and Germino GG. Identification and characterization of Pkhd1, the
mouse orthologue of the human ARPKD gene. J Am Soc Nephrol. 13: 2246-2258, 2002.
103. Nakanishi K, Sweeney WE Jr, Macrae Dell K, Cotton CU and Avner ED. Role of
CFTR in autosomal recessive polycystic kidney disease. J Am Soc Nephrol. 12(4): 719-
104. Nauli SM, Algenhat FJ, Luo Y, Williams E, Vassilev P, Li X, Elia AEH, Lu W, Brown
EM, Quinn SJ, Ingber DE and Zhou J. Polycystins 1 and 2 mediate mechanosensation in
the primary cilium of kidney cells. Nat Genet. 33: 129–137, 2003.
105. Nauta J, Ozawa Y, Sweeney WE Jr, Rutledge JC and Avner ED. Renal and biliary
abnormalities in a new murine model of autosomal recessive polycystic kidney disease.
Pediatr Nephrol. 7: 163-172, 1993.
106. Nauta J, Sweeney WE, Rutledge JC and Avner ED. Biliary epithelial cells from mice
with congenital polycystic kidney disease are hyperresponsive to epidermal growth factor.
Pediatr Res. 37: 755-763, 1995.
107. Nauta J, Goedbloed MA, Herck HV, Hesselink DA, Visser P, Willemsen R, Dokkum
RP, Wright CJ and Guay-Woodford LM. New rat model that phenotypically resembles
autosomal recessive polycystic kidney disease. J Am Soc Nephrol. 11(12): 2272-2284,
108. Nonaka S. Tanaka Y, Okada Y, Takeda S, Harada A, Kanai Y, Kido M, Hirokawa N.
Randomization of left–right asymmetry due to loss of nodal cilia generating leftward flow of
extraembryonic fluid in mice lacking KIF3B motor protein. Cell. 95: 829–837, 1998.
109. O'Brien LE, Tang K, Kats ES, Schutz-Geschwender A, Lipschutz JH and Mostov
KE. ERK and MMPs sequentially regulate distinct stages of epithelial tubule development.
Dev Cell. 7: 21–32, 2004.
110. O'Callaghan C, Sikand K and Rutman A. Respiratory and brain ependymal ciliary
function. Pediatr Res. 46, 704–707, 1999.
111. Onuchic LF, Furu L, Nagasawa Y, Hou X, Eggermann T, Ren Z, Bergmann C,
Senderek J, Esquivel E, Zeltner R, Rudnik- Schöneborn S, Mrug M, Sweeney W, Avner
ED, Zerres K, Guay-Woodford LM, Somlo S and Germino GG. PKHD1, the polycystic
kidney and hepatic disease 1 gene, encodes a novel large protein containing multiple
immunoglobulin-like plexin transcription-factor domains and parallel beta-helix1 repeats.
Am J Hum Genet. 70: 1305–1317, 2002.
112. Osathanondh V and Potter EL. Pathogenesis of polycystic kidneys. Historical
survey. Arch Pathol. 77: 459–465, 1964a.
113. Osathanondh V and Potter EL. Pathogenesis of polycystic kidney. Type 1 due to
hyperplasia of interstitial portions of collecting tubules. Arch Phatol. 77: 466-473, 1964b.
114. Ostrowski LE, Blackburn K, Radde KM, Moyer MB, Schlatzer DM, Moseley A and
Boucher RC. A proteomic analysis of human cilia: identification of novel components. Mol
Cell Proteomics. 1: 451-465, 2002.
115. Pazour GJ, Dickert BL, Vucica Y, Seeley ES, Rosenbaum JL, Witman GB and Cole
DG. Chlamydomonas IFT88 and its mouse homologue, polycystic kidney disease gene Tg
737: Are required for assembly of cilia and flagella. J Cell Biol.151: 709–718, 2000.
116. Pazour GJ, San Agustin JT, Follit JA, Rosenbaum JL and Witman GB. Polycystin-2
localizes to kidney cilia and the ciliary level is elevated in orpk mice with polycystic kidney
disease. Curr Biol. 12: R378–R380, 2002.
117. Pei Y, Watnick T, He N, Wang K, Liang Y, Parfrey P, Germino GG and St George-
Hyslop, P. Somatic PKD2 mutations in individual kidney and liver cysts support a ‘two-hit'
model of cystogenesis in type 2 autosomal dominant polycystic kidney disease. J Am Soc
Nephrol. 10: 1524–1529, 1999.
118. Praetorius HA and Spring KR. Bending the MDCK cell primary cilium increases
intracellular calcium. J Membr Biol. 184: 71–79, 2001
119. Praetorius HA and Spring KR. Removal of the MDCK cell primary cilium abolishes
flow sensing. J Membr Biol. 191: 69-76, 2003.
120. Praetorius HA and Spring KR. A physiological view of the primary cilium. Annu Rev
Physiol. 67: 515–529, 2005.
121. Qian F, Watnick TJ, Onuchic LF and Germino GG. The molecular basis of focal cyst
formation in human autosomal dominant polycystic kidney disease type I. Cell. 87: 979–
122. Qin H, Rosenbaum JL and Barr MM. An autosomal recessive polycystic kidney
disease gene homolog is involved in intraflagellar transport in C. elegans ciliated sensory
neurons. Curr Biol. 11: 457–461, 2001.
123. Quarmby LM and Parker JD. Cilia and the cell cycle? J Cell Biol. 169: 707–710,
124. Richards WG, Sweeney WE, Yoder BK, Wilkinson JE, Woychik RP and Avner ED.
Epidermal growth factor receptor activity mediates renal cyst formation in polycystic kidney
disease. J Clin Invest. 101: 935-939, 1998.
125. Rohatgi R, Greenberg A, Burrow CR, Wilson PD and Satlin LM. Na transport in
autosomal recessive polycystic kidney disease (ARPKD) cyst lining epithelial cells. J Am
Soc Nephrol. 14: 827-836, 2003.
126. Rosenbaum JL and Witman GB. Intraflagellar transport. Nature Rev Mol Cell Biol. 3:
813–825, 2002.
127. Ross AJ, May-Simera H, Eichers ER, Kai M, Hill J, Jagger DJ, Leitch CC, Chapple
JP, Munro PM, Fisher S, Tan PL, Phillips HM, Leroux MR, Henderson DJ, Murdoch JN,
Copp AJ, Eliot MM, Lupski JR, Kemp DT, Dollfus H, Tada M, Katsanis N, Forge A and
Beales PL. Disruption of Bardet–Biedl syndrome ciliary proteins perturbs planar cell
polarity in vertebrates. Nature Genet. 37: 1135–1140, 2005.
128. Rossetti S, Torra R, Coto E, Consugar M, Kubly V, Malaga S, Navarro M, El-
Youssef M, Torres VE and Harris PC. A complete mutation screen of PKHD1 in autosomal
recessive polycystic kidney disease (ARPKD) pedigrees. Kidney Int. 64: 391–403, 2003.
129. Roy S, Dillon MJ, Trompeter RS and Barratt TM. Autosomal recessive polycystic
kidney disease: long-term outcome of neonatal survivors. Pediatr Nephrol. 11: 302–306,
130. Sandford R, Mulroy S and Foggensteiner L. The polycystins: a novel class of
membrane-associated proteins involved in renal cystic disease. Cell Mol Life Sci. 56: 567–
131. Sanzen T, Harada K, Yasoshima M, Kawamura Y, Ishibashi M and Nakanuma Y.
Polycystic kidney rat is a novel animal model of Caroli s disease associated with
congenital hepatic fibrosis. Am J Pathol. 158: 1605–1612, 2001.
132. Satir P and Christensen ST. Overview of structure and function of mammalian cilia.
Annu Rev Physiol. 69: 377–400, 2007.
133. Sato Y, Harada K, Kizawa K, Sanzen T, Furubo S, Yasoshima M, Ozaki S, Ishibashi
M and Nakanuma Y. Activation of the MEK5/ERK5 cascade is responsible for biliare
dysgenesis in a rat model of Caroli's disease. Am J Pathol. 166: 49-60, 2005.
134. Schaller MD. FAK and paxillin: regulators of N-cadherin adhesion and inhibitors of
cell migration? J Cell Biol. 166(2): 157-159, 2004.
135. Schneider L, Clement CA, Teilmann SC, Pazour GJ, Hoffmann EK, Satir P and
Christensen ST. PDGFRalphaalpha signaling is regulated through the primary cilium in
fibroblasts. Curr Biol. 15: 1861–1866, 2005.
136. Schweisguth F. Notch signaling activity. Curr. Biol. 14: R129–R138, 2004.
137. Schwiebert EM, Wallace DP, Braunstein GM, King SR, Peti-Peterdi J, Hanaoka K,
Guggino WB, Guay-Woodford LM, Bell PD, Sullivan LP, Grantham JJ and Taylor AL.
Autocrine extracellular purinergic signaling in epithelial cells derived from polycystic
kidneys. Am J Physiol Renal Physiol. 282(4): F763-775, 2002.
138. Scott DA, Drury S, Sundstrom RA, Bishop J, Swiderski RE, Carmi R, Ramesh A,
Elbedour K, Srikumari Srisailapathy CR, Keats BJ, Sheffield VC and Smith RJ. Refining
the DFNB7–DFNB11 deafness locus using intragenic polymorphisms in a novel gene,
TMEM2. Gene. 246: 265-274, 2000.
139. Simons M and Walz G. Polycystic kidney disease: cell division without a c(l)ue?
Kidney Int. 70: 854-864, 2006.
140. Siroky BJ and Guay-Woodford LM. Renal cystic disease: the role of the primary
cilium/centrosome complex in pathogenesis. Adv Chronic Kidney Dis. 13(2): 131-137,
141. Smith UM, Consugar M, Tee LJ, McKee BM, Maina EN, Whelan S, Morgan NV,
Goranson E, Gissen P, Lilliquist S, Aligianis IA, Ward CJ, Pasha S, Punyashthiti R, Malik
Sharif S, Batman PA, Bennett CP, Woods CG, McKeown C, Bucourt M, Miller CA, Cox P,
Algazali L, Trembath RC, Torres VE, Attie-Bitach T, Kelly DA, Maher ER, Gattone VH 2nd,
Harris PC and Johnson CA. The transmembrane protein meckelin (MKS3) is mutated in
Meckel-Gruber syndrome and the wpk rat. Nat Genet. 38(2): 191-196, 2006.
142. Straughn JM Jr, Shaw DR, Guerrero A, Bhoola SM, Racelis A, Wang Z, Chiriva-
Internati M, Grizzle WE, Alvarez RD, Lim SH and Strong TV. Expression of sperm protein
17 (Sp17) in ovarian cancer. Int J Cancer. 108: 805-811, 2004.
143. Sullivan LP and Grantham JJ. Mechanisms of fluid secretion by polycystic epithelia.
Kidney Int. 49(6): 1586-1591, 1996.
144. Sweeney WE and Avner ED. BPK cyst fluid contains EGF and TGF- α like peptides
which are motogenic and phosphorylate apical EGFR. J Am Soc Nephrol. 7: 1606-1613,
145. Sweeney WE and Avner ED. Functional activity of epidermal growth factor
receptors in autosomal recessive polycystic kidney disease. Am J Physiol. 275: F387-
146. Sweeney WE, Hamahira K, Sweeney J, Garcia-Gatrell M, Frost P and Avner ED.
Combination treatment of PKD utilizing dual inhibition of EGF-receptor activity and ligand
bioavailability. Kidney Int. 64: 1310-1319, 2003.
147. Sweeney WE and Avner ED. Molecular and cellular pathophysiology of autosomal
recessive polycystic kidney disease (ARPKD). Cell Tissue Res. 326(3): 671-685, 2006.
148. Taulman PD, Haycraft CJ, Balkovetz DF and Yoder BK. Polaris, a protein involved
in left-right axis patterning, localizes to basal bodies and cilia. Mol Biol Cell. 12: 589–599,
149. Torres VE. Apoptosis in cystogenesis: Hands on or hands off? Kidney Int. 55: 334–
150. Torres VE, Sweeney WE Jr, Wang X, Qian Q, Harris PC, Frost P and Avner ED.
Epidermal growth factor receptor tyrosine kinase inhibition is not protective in PCK rats.
Kidney Int. 66: 1766-1773, 2004.
151. Torres VE and Harris P. Mechanisms of Disease: autosomal dominant and
recessive polycystic kidney diseases. Nat Clin Pract Nephrol. 2(1): 40-55, 2006.
152. Torres VE and Harris P. Polycystic kidney disease: genes, proteins, animal models,
disease mechanisms and therapeutic opportunities. J Intern Med. 261(1): 17-31, 2007.
153. Tran DD, Russell HR, Sutor SL, van Duersen J and Bram RJ. CAML is required for
efficient EGF receptor recycling. Dev Cell. 5: 245–256, 2003.
154. Tran DD, Edgar CE, Heckman KL, Sutor SL, Huntoon CJ, Van Deursen J, Mckean
DL and Bram RJ. CAML is p56Lck-interacting protein that is required for thymocyte
development. Immunity. 23: 139–152, 2005.
155. Tsiokas L, Arnould T, Zhu C, Kim E, Walz G and Sukhatme VP. Specific association
of the gene product of PKD2 with the TRPC1 channel. Proc Natl Acad Sci USA. 96: 3934–
156. Veizis IE and Cotton CU. Abnormal EGF-dependent regulation of sodium
absorption in ARPKD collecting duct cells. Am J Physiol. 288: F474-F482, 2005.
157. von Bülow GU and Bram RJ. NF-AT activation induced by a CAML interacting
member of the tumor necrosis factor receptor superfamily. Science. 278: 138–141, 1997.
158. Wallace DP, Christensen M, Reif G, Belibi F, Thrasher B, Herrell D and Grantham
JJ. Electrolyte and fluid secretion by cultured human inner medullary collecting duct cells.
Am J Physiol Renal Physiol. 283: F1337–F1350, 2002.
159. Wang S, Luo Y, Wilson PD, Witman GB and Zhou J. The autosomal recessive
polycystic kidney disease protein is localized to primary cilia, with concentration in the
basal body area. J Am Soc Nephrol. 15: 592-602, 2004.
160. Wang S, Zhang J, Nauli SM, Li X, Starremans PG, Luo Y, Roberts KA and Zhou J.
Fibrocystin/polyductin, found in the same protein complex with polycystin-2, regulates
calcium responses in kidney epithelia. Mol Cell Biol. 27(8): 3241-3252, 2007.
161. Ward CJ, Hogan MC, Rossetti S, Walker D, Sneddon T, Wang X, Kubly V,
Cunningham JM, Bacallao R, Ishibashi M, Milliner DS, Torres VE and Harris PC. The gene
mutated in autosomal recessive polycystic kidney disease encodes a large, receptor-like
protein. Nat Genet. 30: 259–269, 2002.
162. Ward CJ, Yuan D, Masyuk TV, Wang X, Punyashthiti R, Whelan S, Bacallao R,
Torra R, LaRusso NF, Torres VE and Harris PC. Cellular and subcellular localization of the
ARPKD protein; fibrocystin is expressed on primary cilia. Hum Mol Genet. 12: 2703-2710,
163. Watanabe D, Saijoh Y, Nonaka S. Sasaki G, Ikawa Y, Yokoyama T and Hamada H.
The left–right determinant inversin is a component of node monocilia and other 9 +0 cilia.
Development. 130: 1725–1734, 2003.
164. Watnick T and Germino GG. From cilia to cyst. Nat Genet. 34: 355–356, 2003.
165. Wilson PD. Polycystic kidney disease. N Engl J Med. 350: 151–164, 2004a.
166. Wilson PD. Polycystic kidney disease: new understanding in the pathogenesis. Int J
Biochem Cell Biol. 36: 1868–1873, 2004b.
167. Woo D. Apoptosis and loss of renal tissue in polycystic kidney diseases. N Engl J
Med. 333: 18-25, 1995.
168. Woollard JR, Punyashtiti R, Richardson S, Masyuk TV, Whelan S, Huang BQ,
Lager DJ, vanDeursen J, Torres VE, Gattone VH, LaRusso NF, Harris PC and Ward CJ. A
mouse model of autosomal recessive polycystic kidney disease with biliary duct and
proximal tubule dilatation. Kidney Int. 72(3): 328-336, 2007.
169. Wu Y, Dai XQ, Li Q, Chen CX, Mai W, Hussain Z, Long W, Montalbetti N, Li G,
Glynne R, Wang S, Cantiello HF, Wu G and Chen XZ. Kinesin-2 mediates physical and
functional interactions between polycystin-2 and fibrocystin. Hum Mol Genet. 15(22): 3280-
170. Yamaguchi T, Pelling JC, Ramaswamy NT, Eppler JW, Wallace DP, Nagao S,
Rome LA, Sullivan LP and Grantham JJ. cAMP stimulates the in vitro proliferation of renal
cyst epithelial cells by activating the extracellular signal-regulated kinase pathway. Kidney
Int. 57: 1460–1471, 2000.
171. Yamaguchi T, Nagao S, Wallace DP, Belibi FA, Cowley BD, Pelling JC and
Grantham JJ. Cyclic AMP activates B-Raf and ERK in cyst epithelial cells from autosomal-
dominant polycystic kidneys. Kidney Int. 63: 1983–1994, 2003.
172. Yamaguchi T, Wallace DP, Magenheimer BS, Hempson SJ, Grantham JJ and
Calvet JP. Calcium restriction allows cAMP activation of the B-Raf/ERK pathway,
switching cells to a cAMPdependent growth-stimulated phenotype. J Biol Chem. 279:
40419–40430, 2004.
173. Yamaguchi T, Hempson SJ, Reif GA, Hedge AM and Wallace DP. Calcium restores
a normal proliferation phenotype in human polycystic kidney disease epithelial cells. J Am
Soc Nephrol. 17: 178–187, 2006.
174. Yang J, Zhang S, Zhou Q, Guo H, Zhang K, Zheng R and Xiao C. PKHD1 gene
silencing may cause cell abnormal proliferation through modulation of intracellular calcium
in autosomal recessive polycystic kidney disease. J Biochem Mol Biol. 40(4): 467-474,
175. Yoder BK, Tousson A, Millican L, Wu JH, Bugg CE, Jr, Schafer JA and Balkovetz
DF. Polaris, a protein disrupted in orpk mutant mice, is required for assembly of renal
cilium. Am J Physiol Renal Physiol. 282: F541–F552, 2002a.
176. Yoder BK, Hou X and Guay-Woodford LM. The polycystic kidney disease proteins,
polycystin-1, polycystin-2, polaris, and cystin, are co-localized in renal cilia. J Am Soc
Nephrol. 13: 2508–2516, 2002b.
177. Zegers MM, O'Brien LE, Yu W, Datta A and Mostov K E. Epithelial polarity and
tubulogenesis in vitro. Trends Cell Biol. 13: 169–176, 2003.
178. Zerres K, Mücher G, Bachner L, Deschennes G, Eggermann T, Kaariainen H,
Knapp M, Lennert T, Misselwitz J and von Mühlendahl KE. Mapping of the gene for
autosomal recessive polycystic kidney disease (ARPKD) to chromosome 6p21-cen. Nat
Genet. 7: 429–432, 1994.
179. Zerres K, Rudnik-Schoneborn S, Steinkamm C, Mucher G. Autosomal recessive
polycystic kidney disease. Nephrol Dial Transplant. 11 (Suppl6): 29–33, 1996.
180. Zerres K, Mücher G, Becker J, Steinkamm C, Rudnik-Schöneborn S, Heikkilä P,
Rapola J, Salonen R, Germino GG, Onuchic L, Somlo S, Avner ED, Harman LA, Stockwin
JM, Guay-Woodford LM. Prenatal diagnosis of autosomal recessive polycystic kidney
disease (ARPKD): molecular genetics, clinical experience, and fetal morphology. Am J
Med Genet. 76: 137–144, 1998.
181. Zerres K, Rudnik-Schöneborn S, Senderek J, Eggermann T, Bergmann C.
Autosomal recessive polycystic kidney disease (ARPKD). J Nephrol. 16: 453–458, 2003.
182. Zhang BH and Guan KL. Activation of B-Raf kinase requires phosphorylation of the
conserved residues Thr598 and Ser601. EMBO J. 19: 5429–5439, 2000.
183. Zhang MZ, Mai W, Li C, Cho SY, Hao C, Moeckel G, Zhao R, Kim I, Wang J, Xiong
H, Wang H, Sato Y, Wu Y, Nakanuma Y, Lilova M, Pei Y, Harris RC, Li S, Coffey RJ, Sun
L, Wu D, Chen XZ, Breyer MD, Zhao ZJ, McKanna JA and Wu G. PKHD1 protein encoded
by the gene for autosomal recessive polycystic kidney disease associates with basal
bodies and primary cilia in renal epithelial cells. Proc Natl Acad Sci U S A. 101: 2311-
184. Zhang Q, Taulman PD and Yoder BK. Cystic kidney diseases: all roads lead to the
cilium, Physiology. 19: 225–230, 2004.
Source: http://annali.unife.it/iuss/article/viewFile/340/293
Practice Parameter Contact Dermatitis: A Practice ParametereUpdate 2015 Luz Fonacier, MD, David I. Bernstein, MD, Karin Pacheco, MD, D. Linn Holness, MD, Joann Blessing-Moore, MD, David Khan, MD, David Lang, MD, Richard Nicklas, MD, John Oppenheimer, MD, Jay Portnoy, MD, Christopher Randolph, MD, Diane Schuller, MD, Sheldon Spector, MD, Stephen Tilles, MD, and Dana Wallace, MD
Antibiotics: Definition • Medications used to treat bacterial • Ideally, before beginning antibiotic NDEG 26 A – Pharmacology I therapy, the suspected areas of Eliza Rivera-Mitu, RN, MSN infection should be cultured to identify the causative organism and potential antibiotic susceptibilities Mosby items and derived items © 2005, 2002 by Mosby, Inc. 1


