Cover.doc
ELECTROSPINNING OF POLY(VINYL ALCOHOL)/CHITOSAN FIBERS
FOR WOUND DRESSING APPLICATIONS
MS.SUNISA PANBOON
A THESIS SUBMITTED IN PARTIAL FULFILLMENT OF THE REQUIREMENTS
FOR THE DEGREE OF MASTER OF SCIENCE (MATERIALS SCIENCE)
DEPARTMENT OF INDUSTRIAL CHEMISTRY
GRADUATE COLLEGE
KING MONGKUT'S INSTITUTE OF TECHNOLOGY NORTH BANGKOK
ACADEMIC YEAR 2005
ISBN 974-19-0476-2
COPYRIGHT OF KING MONGKUT'S INSTITUTE OF TECHNOLOGY NORTH BANGKOK
: Ms. Sunisa Panboon
Thesis Title : Electrospinning of Poly(vinyl alcohol)/Chitosan Fibers for
Wound Dressing Applications
Major field : Materials Science
King Mongkut's Institute of Technology North Bangkok
Thesis Advisors : Associate Professor Narumol Kreua-ongarjnukool
Dr. Ratthapol Rangkupan
Academic Year : 2005
Abstract
In this study, ultrafine fibers of poly(vinyl alcohol) blend with chitosan were
successfully prepared by electrospinning process. The effect of processing parameter and solution properties (i.e. applied electrical potential, collection distance, concentration of chitosan solution and weight ratio of PVA solution/chitosan solution) on processability and morphological appearance of the obtained fibers were investigated. Results from FTIR and DSC confirmed that the electrospun fiber consists of PVA and chitosan. Morphological study of the fibers was carried out with the scanning electron microscope. It was found that as the ratio of chitosan solution in blend solution increased, the average fiber diameter was decreased. While, increasing chitosan solution from 2wt% to 3wt%, resulting in smaller fiber diameter with higher number of beads at the same mixing ratio. The results also showed that both collection distance and applied electrical potential had slight tendency toward decreasing fiber diameter as both parameters increased. It can be said that both parameters in electrospinning had no significant effect to fiber diameters of 10wt%PVA/2wt%chitosan fibers at ratios of 60/40 and 50/50 w/w. Furthermore, blend solution of 10wt%PVA/2wt%chitosan in 60/40 and 50/50 mixing ratio were tested in antimicrobial assessment with Escherichia coli (E.coli) bacteria by agar medium assay and scanning electron micrographs of electrospun fiber samples tested with E.coli were observed. The result strongly indicated an inhibition of E.coli growth in these fibers, and elucidate potential use of such system in biomedical application such as wound dressing.
(Total 87 Pages)
: นางสาวสุณิสา ปานบุญ
: วัสดุศาสตร
ดร.รัฐพล รังกุพันธุ
I would like to express my sincere gratitude to Associate Professor Narumol
Kreua-ongarjnukool, Dr.Ratthapol Rangkupan, Associate Professor Dr.Pitt Supaphol and Dr.Rath Pichyangkura for their helpful guidance, suggestion and encouragement throughout this study. I am also indebted to Metallurgy and Materials Science Research Institute Chulalongkorn University and the Petroleum and Petrochemical College Chulalongkorn University for providing the valuable equipments. Moreover, I would like to thank the Scientific and Technological Research Equipment Center, Chulalongkorn University for recording scanning electron micrographs, Fourier-transform Infrared Spectra and Differential Scanning Calorimetry thermograms. In addition, cordial and sincere thank is extended to all staffs at both Metallurgy and Materials Science Research Institute, Chulalongkorn University and the Petroleum and Petrochemical College, Chulalongkorn University. Moreover, special thank is also extended to both graduated students and Ph.D.student at the Biochemistry Department, Faculty of Science, Chulalongkorn University for kindly help in instrument training for antimicrobial testing to carry on my thesis work Also, I would like to thank to my family, my friends and the staff of the Industrial Chemistry Department, Faculty of Applied Science, King Mongkut's Institute of Technology North Bangkok for their helpful suggestion and valuable assistance throughout the entire research. Finally, I would like to thank the Graduate College of King Mongkut's Institute of Technology North Bangkok and also Nanopolymer Scheme of Chulalongkorn University for providing financial support from the research fund.
TABLE OF CONTENTS
Abstract (in English)
Abstract (in Thai)
Chapter 1. Introduction
1.1 Objectives of this research
1.2 Scopes of this research
1.3 Benefits of this research
Chapter 2. Background and Theory
2.1 Electrospinning process
2.2 Biopolymers
2.2.1 Chitin/Chitosan
2.2.2 Poly(vinyl alcohol) (PVA)
2.2.3 Polyglycolide (PGA)
2.2.4 Polylactide (PLA)
2.2.5 Poly (lactide-co-glycolide)
2.2.6 Poly(ε-caprolactone)
2.3 Microbiology
2.3.1 Escherichia coli bacteria
2.3.2 The requirements for microbial growth
2.3.3 Culture Media for the Growth of Bacteria
2.3.4 The growth curve
2.4 Wound healing and wound dressing
2.4.3 Treatment
Chapter 3. Experimental
3.2 Chemical reagents
3.3 Experimental methods
3.3.1 Preparation of PVA/chitosan solutions
3.3.2 Electrospinning
3.3.3 Parameters of electrospinning process
3.3.4 Characterization
Chapter 4. Results and Discussion
4.1 Properties of PVA/chitosan solutions
4.1.1 Viscosity of solutions
4.1.2 Conductivity of solutions
TABLE OF CONTENTS (CONTINUED)
4.2 Electrospun PVA/chitosan fibers
4.3 Characterization of electrospun fibers
4.3.1 Fourier-transform infrared spectroscopy (FT-IR)
4.3.2 Differential scanning calorimetry (DSC)
4.4 Parameters of electrospinning process
4.4.1 Effect of concentration of chitosan in PVA/chitosan solution
4.4.2 Effect of collection distance
4.4.3 Effect of applied electrical potential
4.5 Antimicrobial assessment
Chapter 5. Conclusions and Suggestions
Appendix A FTIR spectra of PVA/chitosan electrospun fibers
Appendix B DSC thermograms of electrospun PVA fibers, chitosan, and
PVA/chitosan electrospun
Appendix C Range of fiber diameters of PVA electrospun, 10wt%PVA/2wt%chitosan with ratios ranging from 30/70 to 90/10, and 10wt%PVA/3wt%chitosan with ratios ranging from 50/50 to 90/10, respectively
Appendix D Range of fiber diameters of 10wt%PVA/2wt%chitosan with
ratios as 60/40 and 50/50 at various collection distances
Appendix E Range of fiber diameters of 10wt%PVA/2wt%chitosan with
ratios as 60/40 and 50/50 at various applied electrical potentials
Appendix F Antimicrobial assessment
a) Estimating bacterial numbers by indirect methods Turbidity
b) Preparation of microbial concentration with 105 CFU/ml
LIST OF TABLES
2-1 Polymer solvent systems for electrospinning
2-2 Antimicrobial chitosan
2-3 Minimum, maximum and optimum temperature for growth of certain bacteria and archaea
2-4 Terms used to describe organisms in relation to temperature requirement for growth
2-5 Major elements, their sources and functions in bacterial cells
2-6 Common vitamins required in the nutrition of certain bacteria
2-7 Terms used to describe O2 relations of microorganisms
4-1 Polymer weight (g) in blended solutions and weight fraction of PVA/CH in various PVA-to-CH weight ratios
4-2 Properties of blended solutions with concentrations of 10 wt%PVA and 2 wt% chitosan
4-3 Properties of blended solutions with concentrations of 10 wt% PVA and 3 wt% chitosan
4-4 The effect of ratio of PVA to chitosan in 10wt%PVA/2wt%chitosan solution on morphology of electrospun fibers
4-5 The effect of ratio of PVA to chitosan in 10wt%PVA/3wt%chitosan solution on morphology of electrospun fibers
4-6 Fiber diameters (nm) of PVA/chitosan fibers with various ratios
4-7 The effect of collection distance on morphology of 10 wt%PVA / 2 wt%chitosan with ratio as 60/40 electrospun fiber
4-8 The effect of collection distance on morphology of 10 wt%PVA / 2 wt%chitosan with ratio as 50/50 electrospun fiber
4-9 The effect of collection distance on fiber diameters with the ratio of PVA to chitosan as 60/40 and 50/50
4-10 The effect of applied electrical potential on morphology of 10 wt%PVA / 2 wt%chitosan with ratio as 60/40 electrospun fiber
4-11 The effect of applied electrical potential on morphology of 10 wt%PVA / 2 wt%chitosan with ratio as 50/50 electrospun fiber
4-12 The effect of applied electrical potential on fiber diameters with the ratio of PVA to chitosan as 60/40 and 50/50
LIST OF FIGURES
2-1 Schematic of the experimental set-up
2-2 Chemical structure of chitin
2-3 Chemical structure of chitosan
2-4 Hydrolysis of poly(vinyl acetate)
2-5 Chemical structure of poly(lactide-co-glycolide)
2-6 Chemical structure of poly(ε-caprolactone)
2-7 The morphology of Escherichia coli at x10,000 magnification
2-8 The effect of temperature on growth rate
2-9 Growth rate versus temperature for five environmental classes of procaryotes
2-10 Growth rate versus pH for three environmental classes of prokaryotes
2-11 Plasmolysis
2-12 Microbial growth curve
3-1 Electrospinning instrument
3-3 Inoculating loop and inoculating needle
3-4 Streak plate patterns
4-1 Viscosity of blend solution of 10wt% PVA and chitosan at concentration of 2wt% and 3wt% as a function of the
weight ratio of chitosan solution
4-2 Conductivity of blend solution of 10wt% PVA and chitosan at concentration of 2wt% and 3wt% as a function of the weight ratio of chitosan solution
4-3 FTIR spectra of electrospun PVA fibers
4-4 FTIR spectra of chitosan powder
4-5 Comparison of FTIR spectra of electrospun PVA/chitosan fibers
in various PVA-to-chitosan weight ratios
4-6 Comparison of DSC thermogram of PVA/chitosan electrospun with various ratios
4-7 Scanning electron micrographs (original magnification 10x103) of electrospun 10wt%PVA blended with 2 wt% chitosan fibers with various ratios of PVA to chitosan
4-8 Scanning electron micrographs (original magnification 10x103) of electrospun 10 wt% PVA blended with 3 wt% chitosan fibers with different weight ratios of PVA to chitosan 42 4-9 Scanning electron micrographs of electrospun 10wt% PVA fibers (original magnification 10x103) 43 4-10 The average of fiber diameter as function of ratios of chitosan in blend with concentration of chitosan as 2wt% and 3wt% 44
LIST OF FIGURES (CONTINUED)
4-11 Scanning electron micrographs of electrospun 10 wt% PVA
blended with 2 wt% chitosan fibers in the weight ratio of PVA to chitosan as 60/40 with different collection distances while the applied electrical potential is fixed as 15 kV
4-12 Scanning electron micrographs of electrospun 10 wt% PVA blended with 2 wt% chitosan fibers in the weight ratio of PVA to chitosan as 50/50 with different collection distances while the voltage is fixed as 15 kV
4-13 The effect of collection distance on fiber diameter with the ratio of PVA to chitosan as 60/40 and 50/50
4-14 Scanning electron micrographs of electrospun 10 wt% PVA
blended with 2 wt% chitosan fibers in the weight ratio of PVA to chitosan as 60/40 with different voltages while
the collection distance is fixed as 10 cm
4-15 Scanning electron micrographs of electrospun 10 wt% PVA
blended with 2 wt% chitosan fibers in the weight ratio of PVA
to chitosan as 50/50 with different voltages while the collection distance is fixed as 10 cm
4-16 The effect of applied applied electrical potentials on fiber diameter
with the ratio of PVA to chitosan as 60/40 and 50/50
4-17 Agar plate diffusion method
4-18 The structure of the E.coli bacterium
4-19 Scanning electron micrographs of the growth of Escherichia.coli (E.coli) for 4 hours incubation time on the following samples in antimicrobial test (original magnification 5x10³)
A-1 FTIR spectra of PVA/chitosan electrospun with ratio of
A-2 FTIR spectra of PVA/chitosan electrospun with ratio of blend as 80/20
A-3 FTIR spectra of PVA/chitosan electrospun with ratio of blend as 70/30
A-4 FTIR spectra of PVA/chitosan electrospun with ratio of
A-5 FTIR spectra of PVA/chitosan electrospun with ratio of blend as 50/50
B-1 DSC thermogram of electrospun PVA fibers
B-2 DSC thermogram of chitosan powder
LIST OF FIGURES (CONTINUED)
B-3 DSC thermogram of PVA/chitosan electrospun with ratio of blend as 90/10
B-4 DSC thermogram of PVA/chitosan electrospun with ratio of blend as 80/20
B-5 DSC thermogram of PVA/chitosan electrospun with ratio of blend as 70/30
B-6 DSC thermogram of PVA/chitosan electrospun with ratio of blend as 60/40
B-7 DSC thermogram of PVA/chitosan electrospun with ratio of blend as 50/50
C-1 Range of fiber diameters of PVA electrospun
C-2 Range of fiber diameters of PVA/2wt%chitosan with ratio as 30/70
C-3 Range of fiber diameters of PVA/2wt%chitosan with ratio as 40/60
C-4 Range of fiber diameters of PVA/2wt%chitosan with ratio as 50/50
C-5 Range of fiber diameters of PVA/2wt%chitosan with ratio as 60/40
C-6 Range of fiber diameters of PVA/2wt%chitosan with ratio as 70/30
C-7 Range of fiber diameters of PVA/2wt%chitosan with ratio as 80/20
C-8 Range of fiber diameters of PVA/2wt%chitosan with ratio as 90/10
C-9 Range of fiber diameters of PVA/3wt%chitosan with ratio as 50/50
C-10 Range of fiber diameters of PVA/3wt%chitosan with ratio as 60/40
C-11 Range of fiber diameters of PVA/3wt%chitosan with ratio as 70/30
C-12 Range of fiber diameters of PVA/3wt%chitosan with ratio as 80/20
C-13 Range of fiber diameters of PVA/3wt%chitosan with ratio as 90/10
D-1 Range of fiber diameters of PVA/chitosan with ratio as 60/40 at 6 cm collection distance
D-2 Range of fiber diameters of PVA/chitosan with ratio as 60/40 at 8 cm collection distance
D-3 Range of fiber diameters of PVA/chitosan with ratio as 60/40 at 10 cm collection distance
D-4 Range of fiber diameters of PVA/chitosan with ratio as 60/40 at 12 cm collection distance
D-5 Range of fiber diameters of PVA/chitosan with ratio as 50/50 at 6 cm collection distance
D-6 Range of fiber diameters of PVA/chitosan with ratio as 50/50 at 8 cm collection distance
D-7 Range of fiber diameters of PVA/chitosan with ratio as 50/50 at 10 cm collection distance
D-8 Range of fiber diameters of PVA/chitosan with ratio as 50/50 at 12 cm collection distance
LIST OF FIGURES (CONTINUED)
E-1 Range of fiber diameters of PVA/chitosan with ratio as 60/40 at 10 kV applied electrical potential
E-2 Range of fiber diameters of PVA/chitosan with ratio as 60/40 at 13 kV applied electrical potential
E-3 Range of fiber diameters of PVA/chitosan with ratio as 60/40 at 15 kV applied electrical potential
E-4 Range of fiber diameters of PVA/chitosan with ratio as 60/40 at 18 kV applied electrical potential
E-5 Range of fiber diameters of PVA/chitosan with ratio as 60/40 at 20 kV applied electrical potential
E-6 Range of fiber diameters of PVA/chitosan with ratio as 50/50 at 10 kV applied electrical potential
E-7 Range of fiber diameters of PVA/chitosan with ratio as 50/50 at 13 kV applied electrical potential
E-8 Range of fiber diameters of PVA/chitosan with ratio as 50/50 at 15 kV applied electrical potential
E-9 Range of fiber diameters of PVA/chitosan with ratio as 50/50
at 18 kV applied electrical potential
E-10 Range of fiber diameters of PVA/chitosan with ratio as 50/50 at 20 kV applied electrical potential
F-1 Turbidity estimation of bacterial numbers
Chapter 1
The electrospinning technique allows the preparation of ultrafine fibers with
diameters ranging from micron to nanoscale fibrous materials. The electrospinning is a novel and efficient fabrication process that produced electrospun fibers through the action of an external electric field to create an electrically charged jet of polymer solution or melt with simultaneous rapid evaporation of the solvent and leave a polymer fiber. The advantages of electrospinning process are simple equipment and cost effective process whereas requiring a long time to obtain enough fibers. The morphology of fibers depends on the process parameters, including the solution concentration, applied electric field strength, deposition distance, deposition time and flow rate. Moreover, system parameters of this technique are molecular weight, molecular weight distribution and architecture of the polymer e.g. branched or linear chain, including solution properties such as viscosity, conductivity and surface tension. Also, the ambient parameters are temperature, humidity, air velocity in chamber and motion of target screen. Typically, electrospinning is applicable to a wide range of polymers, i.e. polyolefin, polyamides, polyester, aramid, acrylic as well as biopolymers like proteins, DNA, polypeptides and polysaccharides.
Due to electrospun fibers have a large specific surface area, light weight and
high porosity, they are of interests in a wide variety of applications including semi-permeable membranes, nanocomposites, filters, protection clothing and biomedical applications such as tissue templates, medical prostheses, artificial organ, wound dressings and drug delivery systems. Especially, for wound dressing applications biopolymers
polycaprolactone, poly(ethylene oxide) and poly(vinyl alcohol):(PVA) were often selected because of excellent biocompatibility and bioresorbable materials.
Therefore, this work focused on preparation of PVA/chitosan fibers for wound
dressing applications. Chitosan has distinct characterisations such as biodegradability, biocompatibility, nontoxicity, acceleration in growth of fibroblast cell for wound healing, and antimicrobial activity. In order to obtain the wound dressing with antibacterial property, chitosan was selected to blend with PVA to produce electrospun fibers due to PVA can be conveniently electrospun while alone chitosan fiber was not formed.
1.1 Objectives of this thesis
1.1.1 To prepare fibers from blended solutions of PVA and chitosan by
electrospinning technique and study the influence of the processing parameters on
fiber morphology.
1.1.2 To assess the possibility to use the PVA/chitosan fiber mats in wound
dressing application by testing their antimicrobial activity.
1.2 Scopes of this thesis
1.2.1 To characterize the properties of blended PVA/chitosan solutions such as
viscosity and conductivity, to prepare electrospun PVA/chitosan fibers by
electrospinning, and to characterize PVA/chitosan fibers by FTIR and DSC techniques.
1.2.2 To study the effect of processing parameters such as chitosan
concentration, PVA-to-chitosan weight ratio, applied electrical potential, and
collection distance on fiber morphology.
1.2.3 To study antimicrobial activity of electrospun PVA/chitosan fibers.
1.3 Benefits of this thesis
1.3.1 Able to understand electrospinning technique for fiber preparation.
1.3.2 Able to prepare PVA/chitosan fibers by electrospinning.
1.3.3 Able to apply PVA/chitosan fibers to wound dressing materials with
antimicrobial property.
Chapter 2
Background and Theory
2.1 Electrospinning process
Electrospinning is a unique method to prepare electrospun fibers with diameters
in the range from micrometers to nanometers that depends on the kinds of polymer and processing conditions.
FIGURE 2-1 Schematic of the experimental set-up [1]
The electrospinning experimental is represented in FIGURE 2-1 above. There
are mainly three components to fulfill the process as follows: a high voltage power supplier, a capillary tube or syringe with a pipette or needle of small diameter, and a metal collecting screen. One electrode is placed into the spinning solution and the other attached to the collector in which the collector mostly is simply grounded. A high voltage is used to induce charges migration in solution to aggregate at the end of the capillary tube. When the intensity of the electric field is increased, the hemispherical surface of the fluid at the tip of the capillary tube elongates to form a conical shape known as the Taylor cone. Further increasing the electric field is used to reach a critical value in which the repulsive electrostatic force overcomes the surface tension of fluid, the charged jet of the fluid is ejected from the tip of the Taylor cone. The discharged polymer solution jet undergoes an stability and elongation process, which allows the jet to become very long and thin. Meanwhile, the solvent evaporates, leaving behind a charged electrospun fiber called nonwoven. It can be said that the electrospinning process has three stages as follows: Firstly, the jet initiation and the extension of the jet along a straight line. Secondly, the growth of a bending instability and the further elongation of the jet, which allows the jet to become very long and thin while it follows a looping and spiraling path. Finally, the solidification of the jet into electrospun fibers [2].
The polymer is usually dissolved in suitable solvent and spun from solution.
Electrospun fibers in the range of 10 to 2000 nm diameter can be achieved by choosing the appropriate polymer solvent system. TABLE 2-1 represents list of some of polymer solvent systems used in electrospinning.
TABLE 2-1 Polymer solvent systems for electrospinning
Solvents
Nylon 6 and nylon 66
Polyacrylonitrile
Dimethyl formaldehyde
Trifluoroacetic acid/Dimethyl chloride
Nylon-6-co-polyamide
Polybenzimidazole
Dimethyl acetamide
Electrospun fibers exhibit special properties mainly due to extremely high
surface to weight ratio compared to conventional nonwovens. Low density, large surface area to mass, high pore volume, tight pore size, flexibility in surface functionalities, and superior mechanical performance make the electrospun fiber nonwoven appropriate for a wide range of applications.
Electrospun fibers have significant applications in the area of filtration since
their surface area is substantially greater and have smaller micropores than melt blown (MB) webs. High porous structure with high surface area makes them ideally suited for many filtration applications. Electrospun fibers are ideally suited for filtering submicron particles from air or water. As a result of a light weight and breathable fabric, which is permeable to both air and water vapor, insoluble in all solvents and highly reactive with nerve gases and other deadly chemical agents, nonwoven products have potential uses in a wide range of filtration applications such as aerosol filters, facemasks, and protective clothing. Electrospun fibers are also used in biomedical applications, which include, drug and gene delivery, artificial blood vessels, artificial organs, and medical facemasks. Electrospun fibers and webs are capable of delivering medicines directly to internal tissues. Electrospun fibers can be also used as varieties of medical applications such as wound dressing or sutures that ultimately dissolve into body. Nonwoven nanofibrous membrane mats for wound dressing usually have pore sizes ranging from 500 nm to 1 µm, small enough to protect the wound from bacterial penetration via aerosol particle capturing mechanisms and also high surface area of 5-100 m2/g is extremely efficient for fluid absorption and dermal delivery.
There are many literature reviews related to the electrospinning process as
Ding et al. [3] prepared nanoscale PVA fiber (100-500 nm) aggregates with an
electrospinning technique. Electrospinning conditions, including the concentration (10 wt%), tip-to-collector distance (TCD) (8 cm) and voltage (19 kV), were used to obtain thinner and regular PVA fibers. With increasing the concentration of PVA solution, the larger fiber diameter was observed. Moreover, a chemical crosslinking method was used to crosslink the nanoscale PVA fiber aggregates. The average diameter of the fibers was about 280 nm when the small amount of glyoxal was added to the PVA solution. The water uptake decreased with the increasing weight percentage of glyoxal to PVA. And the tensile strength of the PVA fiber aggregates increased when more weight percentage of glyoxal was added, indicating the crosslinked PVA fiber aggregates had better antiwater solubility and mechanical properties than the noncrosslinked PVA fiber aggregates.
Kamonrat et al. [4] prepared ultrafine fibers of PVA and PVA-alginate blend
by electrospinning technique. Effect of process parameters, i.e. applied voltage, gap distance between electrodes, and solution parameter, i.e. polymer concentration, on size and shape of fiber and ability of fiber formation were investigated. For PVA system, fiber size decreased as applied voltage and distance were increased. PVA and PVA-alginate solution were loaded with 0.10, 0.15, 0.20 and 0.25 g of tetracycline hydrochloride were electrospun into fibers with applied voltage and gap distance of 8 kV and 10 cm. Releasing behavior of tetracylcine hydrochloride in drug loaded fibers was studied in acetate buffer at pH 5.5, 37oC for 24 hours. The different from PVA and alginate blended coated on PVA with tetracycline hydrochloride fiber was studied. it was found that PVA with tetracycline hydrochloride fiber gave 86.50% and PVA and alginate blended coated on PVA with tetracycline hydrochloride fiber gave 44% for 24 hours.
Siriorn et al. [5] prepared polycaprolactone fibers and polycaprolactone fibers
mixed diclofenac sodium by electrospinning process for wound dressing application. Effect of solvent, polymer concentration, applied voltage and gap distance between electrodes on morphology and size of fiber and fiber formation ability were studied. The most uniform fibers, in term of shape and size, were obtained from 15% (w/v) of PCL in methylene chloride solution with a gap distance of 15 cm at 7.5 kV. Using this condition, 10 ml of PCL solutions were loaded with. 0.01, 0.03, 0.05 and 0.07 g of diclofenac sodium (DS) were electrospun into fibers, Releasing behavior of DS from these fibers in acetate buffer at pH 5.5 and 37oC were follow by UV-visible spectrophotometry. After 48 hours, the amount of DS released from fibers with the DS loading of 0.01, 0.03, 0.05 and 0.07 g were 60%, 48%, 46% and 30%, respectively.
Duan et al. [6] discovered that ultrafine fibers could not be electrospun from
chitosan solution in aqueous acetic acid, but formed after addition of poly (ethylene oxide) (PEO) in an aqueous solution of 2 wt% acetic acid in 2:1 or 1:1 mass ratios of chitosan to PEO from 4-6 wt% chitosan/PEO solutions at 15 kV voltage, 20 cm capillary-collector distance and flow rate 0.1 ml/h. With the addition of PEO, the conductivities of chitosan/PEO solutions decreased in comparison with the same concentration of the chitosan solution. The surface tension of PEO solutions varied with the molecular mass of PEO reduced slightly with increasing the concentration of
PEO solutions. The surface tensions of chitosan/PEO solutions with different molecular masses of PEO were similar to those of PEO solutions at the same concentration. The viscosity clearly increased with enhancing the concentration of both chitosan solutions and PEO solutions. With increasing the molecular mass of PEO, the viscosities of blended chitosan/PEO solutions increased. During the electrospinning process of the chitosan/PEO solutions, the ultrafine fibers were obtained with diameters from 80 nm to 180 nm, while microfibers with thicker diameters were also generated. The morphology of the ultrafine fibers electrospun from chitosan/PEO solutions was influenced strongly by the solution concentration and the mass ratio of chitosan to PEO, whereas the molecular mass of PEO had little effect on it. Microfibers mainly contained PEO, while ultrafine fibers consisted of chitosan due to the phase separation of the chitosan/PEO solutions during the electrospinning process.
Ohkawa et al. [7] discovered that chitosan in formic acid (FA) could not be
electrospun, but formed when a small portion of the PVA was added. Homogenous fibers from chitosan and PVA solutions were obtained as the ratio of the chitosan to PVA at 50:50 with an average diameter of 120 nm. With increasing the volumes of PVA, the fibers were thicker. However, chitosan fibers were generated when trifluoroacetic acid (TFA) was used as the solvent. An homogenous network of the electrospun chitosan fibers was observed at the concentration of 8 wt% with an average diameter of 490 nm. In order that the preparation of a homogenous (not interconnected) fiber network of chitosan, dichloromethane (MC) was mixed with TFA as the solvent for chitosan. Homogenous chitosan fibers were obtained at a TFA: MC ratio of 70:30 as the solvent with an average diameter of 330 nm.
Zhang et al. [8] produced submicron poly (vinyl alcohol) (PVA) fiber mats by
electrospinning of aqueous PVA solutions. There was a slightly increase in an average fiber diameter with increasing applied electric voltage. Tip-target distance had no significant effects on fiber morphology; however the morphology was slightly changed by the flow rate. With increasing the concentration of PVA solution, the morphology was changed from beaded fiber to uniform fiber structure and the fiber diameter was also increased from 87±14 nm to 246±50 nm. PVA fiber diameters were gradually decreased from 214±19 nm to 159±21 nm with increasing amount of NaCl. The morphology of electrospun PVA changed from the ribbon-like fibers to uniform fibers and then to beaded fibers when the hydrolysis degree (DH) of PVA was increased from 80% to 99%.
Son et al. [9] found that 7 wt% PVA solutions were electrospun at 19 kV
positive voltage, 10 cm working distance, and 1 ml/h solution flow rate. In order to investigate the effect of pH on the morphology and diameter of electrospun PVA, PVA solutions were electrospun at various pH values from 2.0 to 12.9. The conductivity of PVA solutions was strongly depended on pH that PVA fibers with much smaller diameter can be obtained at low and high pH values, while their viscosity and surface tension were not significantly affected by pH. Moreover, with increasing the conductivity, the average diameter of PVA fiber was decreased. The average diameter of PVA fibers electrospun at pH 7.2 was 290 nm. Electrospun PVA fibers became straighter and finer with increasing pH under basic conditions, whereas the electrospinning of PVA solution was not continuous and PVA fibers with beads-
on-string structures were obtained due to the protonation of PVA under acidic conditions.
Geng et al. [10] prepared chitosan electrospun fibers from aqueous chitosan
solution using concentrated acetic acid solution as a solvent. A uniform nanofibrous
mat of average fiber diameter of 130 nm was obtained from the following optimum
condition: 7%chitosan solution in aqueous 90% acetic acid solution was successfully
electrospun in the electric field of 4kV/cm. The acetic acid concentration was the
most important parameter in the electrospinning, which decreased surface tension of
the chitosan solution and at the same time increased charge density of jet without
significant effect on viscosity. Only chitosan solution of a molecular weight of
106,000g/mol produced bead-free and more uniform electrospun fiber. The average
diameter decreased with narrow diameter distribution as applied electric field
increased.
2.2 Biopolymers
2.2.1 Chitin/Chitosan
Chitin is a polysaccharide in nature. Chitin is found in the exoskeleton of
crustacean, insects, annelids, mollusks, and some fungi.
Chitin is composed of 2-acetamido-2-deoxy-β-D-glucopyranose residues
(N-acetyl-D-glucosamine residues), linked by (1 4)-linkages.
The chemical structure of chitin is shown in FIGURE 2-2.
FIGURE 2-2 Chemical structure of chitin
(Garner and Blackwell, 1975) proposed that chitin is predominantly present as a
fibrillar crystalline material. Based on infrared spectroscopy and x-ray diffraction data, chitin can be found in one of the three crystalline forms: α-chitin, β-chitin and γ-chitin, respectively. The molecules in orthorhombic α-chitin are arranged very tightly in an anti-parallel fashion. α-chitin is mainly present in shells of crabs, lobsters and shrimps. β-chitin, obtained from squid pens, takes the monoclinic form in which the chains are arranged in a parallel fashion, while γ-chitin is the form in which the molecules are arranged in both parallel and anti-parallel manner. As a result of the molecular packing, intermolecular interactions in β-chitin are weaker than those in
α-chitin, making β-chitin being more susceptible to dissolution in a number of solvents. This results in β-chitin being more reactive and versatile. Chitin is insoluble in most common organic solvents, a direct result of the strong intra- and inter-molecular hydrogen bonding.
Chitosan is a partially deacetylated polymer of acetyl glucosamine obtained
after alkaline deacetylation of the chitin. The chitosan is composed of 2-amino-2-deoxy-β-D-glucopyranose (D-glucosamine) and N-acetyl-D-glucosamine residues. The chemical structure of chitosan is represented in FIGURE 2-3.
FIGURE 2-3 Chemical structure of chitosan
Chitosan is semi-crystalline and the degree of crystallinity is a function of the
degree of deacetylation. Chitosan is insoluble at neutral and alkaline pH, but formed water-soluble salts with inorganic and organic acids including glutamic, hydrochloric, lactic and acetic acids. In acidic medium, the amine groups of the polymer are protonated resulting in a soluble, positively charged polysaccharide that has a high charge density (one charge for each D-glucosamine unit).The chitosan is a natural, nontoxic, biodegradable polysaccharide available as solution, flake, fine powder, bead, and fiber. Due to the chitosan has a large molecular weight, exhibits a positive charge, and demonstrates film-forming ability and gelation characteristics. Thus, it has been extensively used in the industry as a flocculant in the clarification of wastewater and as a chelating agent for harmful metals for the detoxification of hazardous waste. In addition, the chitosan has been exploited in the cosmetic industry, in the dental industry, for hair care products, and for ophthalmic applications, such as contact lens coating or the contact lens material. Also, it has been used as a biomaterial in veterinary applications, such as wound healing agent, antimicrobial agent, bandage material, skin grafting template, hemostatic agent and drug delivery vehicle.
The antibacterial and antifungal activities of chitosan have been followed with
great interest. Chitosan inhibits the growth of a wide variety of bacteria, fungi and etc as shown in TABLE 2-2.
TABLE 2-2 Antimicrobial chitosan
Escherichia coli
Botrytis cinerea
Proteus vulgaris
aureus (S.aureus)
Shigella dysenteriae stolonifer
Rhodotorula rubra
parahaemolyticus
hydrophila CCRC 13881
Begin and Calsteren [11] found that antimicrobial films were prepared by
dissolving chitosan into hydrochloric, formic, acetic, lactic and citric acid solutions. Chloride and citrate produced solutions with much lower viscosities than formate, acetate and lactate. Films prepared from these solutions were evaluated in tension for Young's modulus, stress and elongation at yield and break points. Films made from hydrochloric, formic and acetic acids were hard and brittle, whereas those from lactic and citric acids were soft. These results indicate that soft films produced from lactic and citric acids should be used in multilayer films or for coating. While, chloride and formate form hard films which may be used as biodegradable packaging or as support to films containing antimicrobial agents.
The mechanism of the antimicrobial activity of chitosan can be summarized as
1. The cationic nature of chitosan causes it to bind with sialic acid in
phospholipids, consequently restraining the movement of microbiological substances.
2. Oligomeric chitosan penetrates into the cells of microorganisms and prevents
the growth of cells by preventing the transformation of DNA into RNA [12].
Zheng and Zhu [13] studied in the antimicrobial activity of chitosan of different
molecular weights (MW) to E.coli and Staphylococcus aureus. The effect of the concentration and MW of chitosan were investigated. With increasing of chitosan concentration, the antimicrobial effect strengthened. Also, the concentration of chitosan reached 1.0%, the inhibition rate reached 100% for both E.coli and S.aureus. For chitosan with MW below 300kDa, the antimicrobial effect on S.aureus (a gram-positive bacteria) was strengthened as the MW increased, while the effect on E.coli (a gram-negative bacteria) was weakened; as a result of the mechanisms of the antimicrobial activity of chitosan were different between gram-positive and negative bacteria. The two antimicrobial mechanisms can be discussed in the following. For S.aureus, the antimicrobial effect was enhanced when the MW of chitosan increased because of the chitosan of higher MW forms a film which inhibits nutrient adsorptions of a positive bacteria cell. In contrast, for E.coli, the antimicrobial effect was enhanced when the MW of chitosan decreased; as a result of the chitosan of lower MW enters the microbial cell more easily and also, chitosan can adsorb the electronegative substance in the cell and flocculate them and then disturbed the metabolism of the cell.
Srinivasa et al [14] prepared chitosan/PVA blend films by wet casting method.
Moreover, blend films were characterized for optical and mechanical properties. With decreasing the chitosan concentration, the degree of transparency of films had the higher values. The tensile strength of blend films decreased with increase in PVA concentration, while %elongation of blend films declined with increase in chitosan concentration. A blend ratio of 80/20 was found to be the best.
2.2.2 Poly(vinyl alcohol) (PVA)
Poly(vinyl alcohol) is a water-soluble polymer produced industrially by
hydrolysis of poly(vinyl acetate) in the following equation below:
FIGURE 2-4 Hydrolysis of poly(vinyl acetate)
A number of grades of PVA are commercially available, which can be divided
into two types: the fully hydrolyzed and the partially hydrolyzed PVA depending on the amount of acetate groups left in the backbone (Mark and Gayload, 1980). PVA is highly biocompatible and is non-toxic, also it has high water permeability. The chemical stability of PVA at normal temperature along with its excellent physical and mechanical properties have led to its broadly practical applications in medical, cosmetic, food, pharmaceutical and packaging industries. PVA has been mainly used in fiber and film products such as paper coating, adhesives and colloid stabilizer. Ultrafine PVA fibers produced by electrospinning may have potential applications in filtration and biomedical engineering. Moreover, PVA-containing solutions have been processed by numerous techniques including sol-gel processing, phase separation and freeze-thaw cyclic treatments to produce a variety of structures [15].
2.2.3 Polyglycolide (PGA) [15]
Polyglycolide is the simplest linear aliphatic polyester. PGA was used to
develop the first totally synthetic absorbable suture, marketed as Dexon in the 1960s by Davis and Geck, Inc. (Danbury, CT). Glycolide monomer is synthesized from the dimerization of glycolic acid. Ring-opening polymerization yields high-molecular-weight materials, with approximately 1-3% residual monomer present. PGA is highly crystalline (45-55%), with a high melting point (220-225°C) and a glass-transition temperature of 35-40°C. Because of its high degree of crystallization, it is not soluble in most organic solvents; the exceptions are highly fluorinated organics such as hexafluoroisopropanol. Fibers from PGA exhibit high strength and modulus and are too stiff to be used as sutures except in the form of braided material. Sutures of PGA lose about 50% of their strength after 2 weeks and 100% at 4 weeks, and are completely absorbed in 4-6 months. Glycolide has been copolymerized with other monomers to reduce the stiffness of the resulting fibers.
2.2.4 Polylactide (PLA) [15]
Lactide is the cyclic dimer of lactic acid that exists as two optical isomers, d and
l. l-lactide is the naturally occurring isomer, and dl-lactide is the synthetic blend of d-lactide and l-lactide. The homopolymer of l-lactide (LPLA) is a semicrystalline polymer. These types of materials exhibit high tensile strength and low elongation, and consequently have a high modulus that makes them more suitable for load-bearing applications such as in orthopedic fixation and sutures. Poly(dl-lactide) (DLPLA) is an amorphous polymer exhibiting a random distribution of both isomeric forms of lactic acid, and accordingly is unable to arrange into an organized crystalline structure. This material has lower tensile strength, higher elongation, and a much more rapid degradation time, making it more attractive as a drug delivery system. Poly(l-lactide) is about 37% crystalline, with a melting point of 175-178°C and a glass-transition temperature of 60-65°C. The degradation time of LPLA is much slower than that of DLPLA, requiring more than 2 years to be completely absorbed. Copolymers of l-lactide and dl-lactide have been prepared to disrupt the crystallinity of l-lactide and accelerate the degradation process.
2.2.5 Poly (lactide-co-glycolide) [15]
Using the polyglycolide and poly(l-lactide) properties as a starting point, it is
possible to copolymerize the two monomers to extend the range of homopolymer
properties (see FIGURE 2-5). Copolymers of glycolide with both l-lactide and dl-
lactide have been developed for both device and drug delivery applications. It is
important to note that there is not a linear relationship between the copolymer
composition and the mechanical and degradation properties of the materials. For
example, a copolymer of 50% glycolide and 50% dl-lactide degrades faster than either
homopolymer. Copolymers of l-lactide with 25-70% glycolide are amorphous due to
the disruption of the regularity of the polymer chain by the other monomer. A
copolymer of 90% glycolide and 10% l-lactide was developed by Ethicon as an
absorbable suture material under the trade name "Vicryl." It absorbs within 3-4
months but has a slightly longer strength-retention time.
HO ( C CH O)m (C CH2O )n H
FIGURE 2-5 Chemical structure of poly(lactide-co-glycolide)
2.2.6 Poly(ε-caprolactone) [15]
The ring-opening polymerization of ε-caprolactone yields a semicrystalline
polymer with a melting point of 59-64°C and a glass-transition temperature of -60°C (see FIGURE 2-6). The polymer has been regarded as tissue compatible and used as a biodegradable suture in Europe. Because the homopolymer has a degradation time on the order of 2 years, copolymers have been synthesized to accelerate the rate of bioabsorption. For example, copolymers of ε-caprolactone with dl-lactide have yielded materials with more-rapid degradation rates.
HO [ (CH2)5 C O ]n CH2CH2 [ O C (CH2)5 ]n OH
FIGURE 2-6 Chemical structure of poly(ε-caprolactone)
2.3 Microbiology
2.3.1 Escherichia coli bacteria [16]
Escherichia coli (usually abbreviated to E.coli), as shown in FIGURE 2-7, is one
of the main species of bacteria that live in the lower intestines of warm-blooded animals (including birds and mammals) and are necessary for the proper digestion of food. Its presence in groundwater is a common indicator of fecal contamination. The name comes from its discoverer, Theodor Escherich. It belongs among the Enterobacteriaceae, and is commonly used as a model organism for bacteria in general.
FIGURE 2-7 The morphology of Escherichia coli at x10,000 magnification [17]
The number of individual E.coli bacteria in the feces that one human passes in
one day averages 1011 to 1013 cells. All the different kinds of fecal coli bacteria and all the very similar bacteria that live in the ground ( in soil or decaying plants, of which the most common is Enterobacter aerogenes) are grouped together under the name "coliform" (meaning "like coli" bacteria. Technically, the "coliform group" is defined to be all the aerobic and facultative anaerobic, non-spore-forming, Gram-negative, rod-shaped bacteria that ferment lactose with the production of gases such as carbondioxide and hydrogen gas and also organic acids within 48 hours at 35°C.
In the fields of water purification and sewage treatment, E.coli was chosen very
early in the development of the technology as an "indicator"of the pollution level of water, meaning the amount of human fecal matter in it, measured using the Coliform index. The main reasons for using E.coli are that there are a lot more coliforms in human feces than there are pathogens (such as Salmonella typhi, which causes typhoid).
Although E.coli is generally nonpathogenic, there are three situations that it can
cause illness as follows:
1. When the bacteria get out of the intestinal tract and into the urinary tract, they
can cause an infection sometimes referred to as "honeymoon cystitis" because intercourse can lead to introduction of bacteria into the bladder. Although it is more common in females, urinary tract infection is seen in both males and females. It is found in roughly equal proportions in elderly men and women. Since bacteria invariably enter the urinary tract through the urethra, poor toilet hygiene can
predispose to infection but other factors are also important (pregnancy in women, prostate enlargement in men) and in many cases the initiating event is unclear.
2. When the bacteria get out of the intestinal tract through a perforation (a hole
or tear, which could be caused by an ulcer) and into the abdomen, they usually cause an infection called "peritonitis" that can be fatal. However, E.coli are extremely sensitive to antibiotics such as streptomycin, so treatment with antibiotics is usually effective.
3. Certain strains of E.coli are toxigenic (some produce a toxin very similar to
that seen in dysentery) and can cause food poisoning usually associated with eating contaminated meat and lead to diarrhea. A particularly virulent example of such a strain of E.coli is E.coli O157:H7.
2.3.2 The requirements for microbial growth [18,19]
The requirements for microbial growth can be divided into two main categories:
physical and chemical.
2.3.2.1 Physical requirements include temperature, pH and osmotic
2.3.2.1.1 Temperature
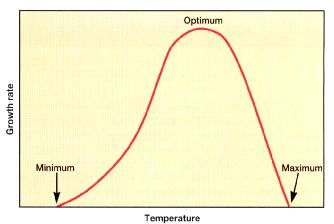
At low temperature a temperature rise increases the growth rate because the
velocity of an enzyme-catalysed reaction, like that of any chemical reaction, will roughly double for every 10°C rise in temperature. Because the rate of each reaction increases, metabolism as a whole is more active at higher temperatures, and the microorganism grows faster. Beyond a certain point further increases actually slow growth, and sufficiently high temperatures are lethal. High temperatures damage microorganisms by denaturing enzymes, transport carriers, and other proteins. Microbial membranes are also disrupted by temperature extremes; the lipid bilayer simply melts and disintegrates. Although functional enzymes operate more rapidly at higher temperatures, the microorganism may be damaged to such an extent that growth is inhibited because the damage can not be repaired. At very low temperatures, membranes solidify and enzymes do not work rapidly. The effect of temperature on growth rate as shown in FIGURE 2-8.
FIGURE 2-8 The effect of temperature on growth rate [18]
Most microorganisms grow well at the temperatures favored by humans. Most
bacteria grow only within a limited range of temperatures, and their maximum and minimum growth temperatures are only about 30°C apart. They grow poorly at the high and low temperature extremes within their range. TABLE 2-3 represents the temperature for growth of bacterium.
TABLE 2-3 Minimum, maximum and optimum temperature for growth of certain
bacteria and archaea. [20]
Temperature for growth (ºC)
monocytogenes Vibrio marinus
maltophilia Thiobacillus
novellus Staphylococcus
aureus Escherichia coli
kluyveri Streptococcus
pyogenes Streptococcus
pneumoniae Bacillus
hermuslavo Thermus aquaticus
jannaschii Suulfolobus
acidocaldarius Pyrobacterium
Microorganisms are classified into three primary groups on the basis of their
preferred range of temperature as follow: psychrophiles (cold-loving microbes), mesophiles (moderate-temperature-loving microbes), and thermophiles (heat-loving microbes).
FIGURE 2-9 and TABLE 2-4 represent organisms in relation to temperature
requirements for growth.
FIGURE 2-9 Growth rate versus temperature for five environmental classes of
procaryotes.
Most procaryotes will grow over a temperature range of about 30 degrees. The
curves exhibit three cardinal points: minimum, optimum and maximum temperatures
for growth. There is a steady increase in growth rate between the minimum and
optimum temperatures, but slightly past the optimum a critical thermolabile cellular
event occurs, and the growth rates plunge rapidly as the maximum T is approached.
As expected and as predicted by T.D. Brock, life on earth, with regard to temperature,
exists wherever water remains in a liquid state. Thus, psychrophiles grow in solution
wherever water is supercooled below 0 degrees; and extreme thermophilic archaea
(hyperthermophiles) have been identified growing near deep-sea thermal vents at
temperatures up to 120 degrees. Theoretically, the bar can be pushed to even higher
temperatures. [20]
TABLE 2-4 Terms used to describe organisms in relation to temperature
requirements for growth. [20]
Temperature for growth (°C)
Below 20 Grow best at relatively low T
Above 25 Able to grow at low T but
prefer moderate T
Below 45 Most bacteria esp. those living
in association with warm- blooded animals
Among all thermophiles is
wide variation in optimum and maximum T
Microorganisms which grow at an optimum pH well below neutrality (7.0) are
called acidophiles. Those which grow best at neutral pH are called neutrophiles and those that grow best under alkaline conditions are called alkaliphiles. Most bacteria grow best in a narrow pH range near neutrality, between pH 6.5 and 7.5. Very few bacteria grow at an acidic pH below about pH 4. Some bacteria, called acidophiles, are remarkably tolerant of acidity. For example, one type of chemoautotropic bacteria, which is found in the drainage water from coal mines and oxidizes sulfur to form sulfuric acid can survive at a pH value of 1.
The range of pH over which an organism grows is defined by three cardinal
points: the minimum pH, below which the organism cannot grow, the maximum pH, above which the organism cannot grow, and the optimum pH, at which the organism grows best. For most bacteria there is an orderly increase in growth rate between the minimum and the optimum and a corresponding orderly decrease in growth rate between the optimum and the maximum pH, reflecting the general effect of changing [H+] on the rates of enzymatic reaction as shown in FIGURE 2-10.
FIGURE 2-10 Growth rate versus pH for three environmental classes
of procaryotes.
When bacteria are cultured in the laboratory, they of ten produce acids that
eventually interfere with their own growth. To neutralize the acids and maintain the proper pH, chemical buffers are included in the growth medium. The peptones and amino acids in some media act as buffers, and many media also maintain phosphate salts. Phosphate salts have the advantage of exhibiting their buffering effect in the pH growth range of most bacteria. They are nontoxic and also provide phosphorus, essential nutrient.
2.3.2.1.3 Osmotic pressure
Microorganisms obtain almost all their nutrients in solution from the
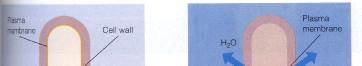
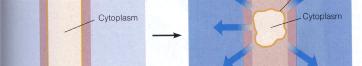
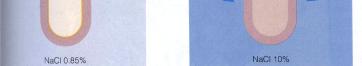
surrounding water. Thus, they require water for growth and are made up of 80-90% water. High osmotic pressures have the effect of removing necessary water from a cell. When a microbial cell is in a solution that a higher concentration of solutes than in the cell (hypertonic), the cellular water passes out through the plasma membrane to the high solute concentration. This osmotic loss of water causes plasmolysis, or shrinkage of the cell's cytoplasm. It is shown in FIGURE 2-11.
The increased osmotic pressure can inhibit the growth of some bacteria. If the
osmotic pressure is unusually low (hypotonic) such as in distilled water, water tends to enter the cell rather than leave it. Some microbes that have a relatively weak cell wall may be lysed by such treatment.
FIGURE 2-11 Plasmolysis [19]
(A) Normal cell in isotonic solution. Under these conditions, the osmotic pressure in
the cell is equivalent to a solute concentration of 0.85% sodium chloride (NaCl).
(B) Plasmolyzed cell in hypertonic solution. If the concentration of solutes such as
NaCl is higher in the surrounding medium than in the cell (hypertonic), Water tends to leave the cell. Growth of the cell is inhibited.
2.3.2.2 Chemical requirements include sources of carbon, nitrogen,
sulfur, phosphorus, trace elements, oxygen, and organic growth factors.
Every organism must find in its environment all of the substances required for
energy generation and cellular biosynthesis. The chemicals and elements of this environment that are utilized for bacterial growth are referred to as nutrients or nutritional requirements. In the laboratory, bacteria are grown in culture media which are designed to provide all the essential nutrients in solution for bacterial growth.
2.3.2.2.1 The major elements
At an elementary level, the nutritional requirements of a bacterium such as E.
coli are revealed by the cell's elemental composition, which consists of C, H, O, N, S. P, K, Mg, Fe, Ca, Mn, and traces of Zn, Co, Cu, and Mo. These elements are found in
the form of water, inorganic ions, small molecules, and macromolecules which serve
either a structural or functional role in the cells. The general physiological functions
of the elements are outlined in TABLE 2-5.
TABLE 2-5 Major elements, their sources and functions in bacterial cells [20]
Main constituent of cellular material
compounds or CO2
Constituent of cell material and cell
water; O2 is electron acceptor in
aerobic respiration
Constituent of amino acids, nucleic
acids nucleotides, and coenzymes
Main constituent of organic
compounds and cell water
Constituent of nucleic acids,
nucleotides, phospholipids, LPS,
Constituent of cysteine, methionine,
glutathione, several coenzymes
Main cellular inorganic cation and cofactor for certain enzymes
Inorganic cellular cation, cofactor for
certain enzymatic reactions
Inorganic cellular cation, cofactor for certain enzymes and a component of endospores
Component of cytochromes and certain nonheme iron-proteins and a cofactor for some enzymatic reactions
2.3.2.2.2 Trace elements
Trace elements are metal ions required by certain cells in such small amounts that it is difficult to detect (measure) them, and it is not necessary to add them to culture media as nutrients. Trace elements are required in such small amounts that they are present as "contaminants" of the water or other media components. As metal ions, the trace elements usually act as cofactors for essential enzymatic reactions in the cell. One organism's trace element may be another's required element and vice-versa, but the usual cations that qualify as trace elements in bacterial nutrition are Mn, Co, Zn, Cu, and Mo.
2.3.2.2.3 Vitamins
Some vitamins that are frequently required by certain bacteria as growth factors
are listed in TABLE 2-6.
TABLE 2-6 Common vitamins required in the nutrition of certain bacteria [20]
Precursor for the biosynthesis of
Tetrahydrofolate
Transfer of one-carbon units and required for synthesis of thymine, purine bases, serine, methionine and pantothenate
Biosynthetic reactions that require CO2 fixation
Transfer of acyl groups in oxidation of keto acids
CH4 production by methanogens
sulfonic acid Nicotinic acid
NAD (nicotinamide
Electron carrier in
adenine dinucleotide)
dehydrogenation reactions
Pantothenic acid
Coenzyme A and the
Oxidation of keto acids and acyl
Acyl Carrier Protein
group carriers in metabolism
Pyridoxal phosphate
Transamination, deamination, decarboxylation and racemation of amino acids
Oxidoreduction reactions
mononucleotide) and FAD (flavin adenine dinucleotide)
Thiamine pyrophosphate
Decarboxylation of keto acids and
transaminase reactions
Cobalamine coupled to
Transfer of methyl groups
adenine nucleoside
Electron transport processes
2.3.2.2.4 Oxygen
Oxygen is a universal component of cells and is always provided in large
amounts by H2O. However, procaryotes display a wide range of responses to
molecular O2 (TABLE 2-7)
TABLE 2-7 Terms used to describe O2 relations of microorganisms [20]
Required (utilized for aerobic respiration)
Required but at levels
Obligate Anaerobe
Not required for
growth but utilized
Aerobe) Aerotolerant
Not required and not
Obligate aerobes require O2 for growth; they use O2 as a final electron acceptor in aerobic respiration. Obligate anaerobes (occasionally called aerophobes) do not need or use O2 as a nutrient. In fact, O2 is a toxic substance, which either kills or inhibits their growth. Obligate anaerobic procaryotes may live by fermentation, anaerobic respiration, bacterial photosynthesis, or the novel process of metanogenesis. Facultative anaerobes (or facultative aerobes) are organisms that can switch between aerobic and anaerobic types of metabolism. Under anaerobic conditions (no O2) they grow by fermentation or anaerobic respiration, but in the presence of O2 they switch to aerobic respiration. Aerotolerant anaerobes are bacteria with an exclusively anaerobic (fermentative) type of metabolism but they are insensitive to the presence of O2. They live by fermentation alone whether or not O2 is present in their environment.
2.3.3 Culture Media for the Growth of Bacteria
For any bacterium to be propagated for any purpose it is necessary to provide
the appropriate biochemical and biophysical environment. The biochemical (nutritional) environment is made available as a culture medium, and depending upon the special needs of particular bacteria a large variety and types of culture media have been developed with different purposes and uses. Culture media are employed in the isolation and maintenance of pure cultures of bacteria and are also used for identification of bacteria according to their biochemical and physiological properties.
The manner in which bacteria are cultivated, and the purpose of culture media,
varies widely. Liquid media are used for growth of pure batch cultures, while
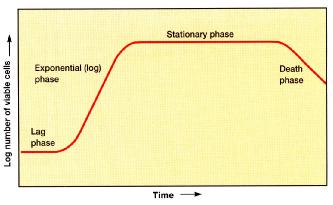
solidified media are used widely for the isolation of pure cultures, for estimating viable bacterial populations, and a variety of other purposes. The usual gelling agent for solid or semisolid medium is agar, a hydrocolloid derived from red algae. Agar is used because of its unique physical properties (it melts at 100 degrees and remains liquid until cooled to 40 degrees, the temperature at which it gels) and because it cannot be metabolized by most bacteria. Hence as a medium component it is relatively inert; it simply holds (gels) nutrients that are in aqueous solution. 2.3.4 The growth curve The growth of microorganism reproducing by binary fission can be plotted as the logarithm of the number of viable cells versus the incubation time the resulting curve has four distinct phases as FIGURE 2-12 shown.
FIGURE 2-12 Microbial growth curve
2.3.4.1 Lag phase
When microorganisms are introduced into fresh culture medium, usually no
immediate increase in cell number occurs, and therefore this period is called the lag phase. Although cell division does not take place right away and there is no net increase in mass, the cell is synthesizing new components. Inoculation of a culture into a chemically different medium also results in a longer lag phases. On the other hand, when a young, vigorously growing exponential phase culture is transferred to fresh medium of the same composition, the lag phase will be short or absent. 2.3.4.2 Log phase
Microorganisms are growing and dividing at constant rate of growth during the
exponential phase. The population will double in number during a specific length of time called the generation time or doubling time. Due to the population is doubling every generation, the increase in population is always 2n where n is the number of generations. The resulting population increase is exponential or logarithmic. Cellular reproduction is most action during this period, and generation time reaches a constant minimum. Because the generation time is constant, a logarithmic plot of growth during the log phase is a straight line. 2.3.4.3 Stationary phase
During stationary phase, population growth ceases and the growth curve
becomes horizontal. The total number of viable microorganisms remains constant
This may result from a balance between cell division and cell death. Moreover, if an essential nutrient is severely depleted, population growth will slow. Also, population growth may cease due to the accumulation of toxic waste products. 2.3.4.4 Death phase
The number of deaths eventually exceeds the number of new cells forms, and
the population enters the death phase or logarithmic decline phase. This phase
continues until the population is diminished to a tiny fraction of the number of cells in
the previous phase, or the population dies out entires.
2.4 Wound healing and wound dressing
The skin is subject to various insults and injuries. Cells on the surface of the
skin are constantly being replaced by regeneration from below with the top layers sloughing off. The repair of an epithelial wound is merely a scaling up of this normal process. An abrasion occurs when a physical force removes epidermal cells to different degrees over the area of the injury. The margins are usually superficial while the interior of the abrasion may extend into the dermis. Initially the wound is filled by blood colt and decaying tissue that later dries out to become a scab.
In a burn, the dead epidermis may remain on the wound and may even be
elevated by the collection of serum between layers of the epidermis thus forming a blister. Burns can be caused by heat, cold, chemicals or ultraviolet light. Blisters are also formed by friction.
A puncture wound is made by a sharp pointed instrument and is usually
collapsed. This type of wound is an ideal site for an infection to begin. 2.4.2 Healing
Inflammation is the normal acute reaction of the tissues after any injury. The
immediate response of the blood supply to the area is a nervous constriction of the vessels. This is followed immediately by vasodilation that allows fluid to exit the capillaries and flood the area. The fluid, plasma, contains fibrinogen which is cleaved to form fibrin strands that form substantial portions of the blood clot. Chemicals in the plasma and on injured tissues attract white blood cells (macrophages and neutrophils) that enter the area and start to clean up foreign material, bacteria and dead cells. Accumulation of a large number of white blood cells leads to pus in the wound. Eventually the clot is replaced by granulation tissue, a connective tissue with a rich blood supply. Collagen and ground substance (proteoglycans) are produced by the fibroblasts within the granulation tissue. The scar is red because of the ample blood supply. The color fades to white as the vascularization decreases and the collagen matrix matures. Myofibroblasts in the wound area are responsible for wound contraction; the normal process where the edges of the wound migrate toward the wound center. Epithelial cells divide and migrate over the basal layers to regenerate the epithelium. Basal cells continue to divide until the epithelial stratification is restored. When the coverage of the wound surface beneath the scab is complete the scab sloughs off and the epidermis begins to keratinize. Remodeling of the collagen matrix may continue for years with the extent varying among individuals and with age. The scar is rarely as strong as the tissue it replaced. Deeper or larger skin wounds
may result in the loss of epidermal structures in that area. Hair follicles, sweat glands and melanocytes may not be replaced. 2.4.3 Treatment
Bleeding from surface wounds can usually be controlled by applying pressure
directly to the wound. The wound should be cleaned with mild soap and water and irrigated well to remove foreign debris and bacterial contaminants. If the edges of a deep laceration are ragged, the doctor may choose to trim them to facilitate healing.
Deeper cuts or incisions require some sort of manual closure such as sutures,
staples or tapes. In relatively simple wounds, the edges may be brought in close approximation by the use of deep sutures and superficial means to minimize scar formation. Before closing a wound with an invasive method the doctor will usually anesthetize the local area with a short acting anesthetic such as lidocaine.
Suture is foreign material and can initiate an inflammatory response. Suture
material may be made of ‘cat gut', newer synthetic polyglycolic acid derivatives, nylon, silk, or stainless steel. The first two examples are absorbable and the others must be removed. Fine suture material and minimal tightening limit any additional tissue damage, inflammation and scarring. Wounds in areas that heal slower (less vascularized) or are in high stress areas require larger suture material and that the stitches be left in longer. Sometimes sutures may be removed after only a few days to minimize scarring due to the proliferation of epithelial cells along the suture tracts. A tetanus toxiod booster injection may be indicated for certain wounds dependent on the patent's immunization record.
Sterile dressings should be applied to keep a fresh wound clean. Sterile
dressings come in various sizes from simple gauze pads to adhesive bandages. If a wound is discharging fluid (serum), the dressing should be changed often to minimize bacterial growth. After drainage has stopped, there is no need for a dressing. Antibacterial ointments may be applied to limit surface bacterial growth and prevent the dressing from sticking to the wound. Topical antibiotics containing multiple antibiotics such as bacitracin, neomycin, or polymyxin B in fixed dosages offer several advantages including broad coverage for infections due to undetermined pathogens and delayed microbial resistance to any one antibiotic. Wounds may be cleansed with hydrogen peroxide several times daily before the reapplication of ointment. Good wound care will minimize the inflammatory response, speed healing and minimize scarring.
Chapter 3
3.1 Equipments
3.1.1 High Voltage Power Supply (Model UCS-30P/cm/VM)
3.1.2 DC Power Supply
3.1.3 Voltage Regulators (Model DC 301) 3.1.4 Scanning Electron Microscope: JEOL JSM-5800LV 3.1.5 Ion sputtering: Balzer model SCB040
3.1.6 Brookfield Viscometer: LVDV-II+ 3.1.7 Conductivity meter: LC116
3.1.8 Differential Scanning Calorimeter: NETZSCH DSC 200
3.1.9 Fourier-transform Infrared Spectrometer: Perkin-Elmer 1760x
3.1.10 Laminar flow: ISSCO Lamina flow model BV124, HS124 3.1.11 Incubator shaker: INNOVA 4000, 4080 3.1.12 pH meter: METTLER TOLEDO S20-K 3.1.13 Autoclave: SANYO LABO 3.1.14 Spectrophotometer: BECKMAN COULTER DU640 3.1.15 Petri dish 3.1.16 Syringe and spinneret 3.1.17 Aluminum foil 3.1.18 Desicator 3.1.19 Oven 3.1.20 Magnetic Stirrer
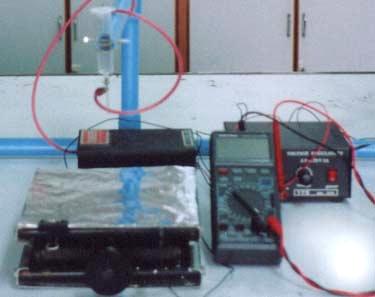
High-voltage power
DC Power Supply
Voltage Regulators
FIGURE 3-1 Electrospinning instrument
3.2 Chemical reagents
3.2.1 Poly(vinyl alcohol) (Analytical grade; BDH, England; MW 115,000)
3.2.2 Chitosan (Biolife (Thailand); MW 250,000)
3.2.3 2%v/v aqueous acetic acid
3.2.4 Distilled water
3.2.5 Escherichia coli DH5 (E.coli)
3.3 Experimental methods
3.3.1 Preparation of PVA/chitosan solutions
PVA/chitosan solutions with concentration of 10 wt% PVA blended with 2 wt%
and 3 wt% chitosan, respectively. PVA solution was prepared by dissolving PVA in warm water (80°C) under magnetic stirring continuously until the solution was cleared while chitosan solutions were prepared by dissolving chitosan in aqueous 2%v/v acetic acid under magnetic stirring overnight at room temperature to obtain homogeneous solutions. The weight ratios of PVA to chitosan were selected as ranging from 90/10 to 10/90, respectively. The blended PVA/chitosan solutions were stirred under magnetic stirring for a while.
3.3.2 Electrospinning
The electrospinning instrument is represented in Fig 3-1. The amount of the
polymer solution was contained in a 5-ml syringe with a metal capillary (No.18), that is, a needle with blunt filed tip. The capillary was connected with a high voltage power supply (Model UCS-30P/cm/VM), which could generated positive DC voltages. A piece of aluminum foil was placed below the capillary tip as the ground collector. The electrospun fibers were obtained at 15 kV Voltage, 10 cm collection distance.
3.3.3 Parameters of electrospinning process
3.3.3.1 Concentration of chitosan solutions
respectively were blended with 10 wt% PVA for electrospinning. The electrospun fibers were formed at 15 kV, 10 cm collection distance.
3.3.3.2 Collection distances
The weight ratios of 10 wt% PVA to 2 wt% chitosan as 50/50 and 60/40 were
selected for electrospinning and lead to studying in the effect of collection distance to the fiber diameter. The fibers were spun at 15 kV while the distances were varied ranging from 6, 8, 10 to12 cm, respectively.
3.3.3.3 Applied electrical potentials
The weight ratios of 10 wt% PVA to 2 wt% chitosan as 50/50 and 60/40 were
selected for studying in the effect of voltage to the fiber diameter. The electrospun fibers were obtained at 10 cm of collection distance but the voltages were applied as follows: 10, 13, 15, 18 and 20 kV, respectively.
3.3.4 Characterization
3.3.4.1 Viscometry
The viscosity of the blended PVA/chitosan solutions was measured in a
Brookfield Viscometer (model LVDV-II+).
3.3.4.2 Conductivity Meter
The electric conductivity of the solutions was tested in a conductivity meter
3.3.4.3 Scanning Electron Microscopy (SEM)
The morphology of the electrospun fibers of PVA/chitosan was observed under
a JEOL JSM-5800LV scanning electron microscope after gold coating by an Ion sputtering with 15 mA for 3.5 minutes each sample. The average fiber diameter and diameter distribution were obtained from the diameter of 100 fibers taken from a number of SEM micrographs which fiber diameter was measured by using SemAfore program. The diameters were presented as the average ± standard deviation. 3.3.4.4 Fourier-transform Infrared Spectroscopy (FTIR)
For the measurements of FT-IR, the samples of electrospun fibers were
prepared by electrospinning of blended PVA/chitosan solutions at 15 kV, 10 cm collection distance. FT-IR measurements were performed in a FT-IR Spectrometer 1760x (Perkin-Elmer) to verify the composition of fibers from functional groups. 3.3.4.5 Differential Scanning Calorimetry (DSC)
To investigate the melting points and the shift of endothermic peaks of
electrospun fibers, the fibers were performed in a NETZSCH DSC 200 at 10°C/min heating rate from room temperature to 250°C. The samples were stored in a desiccator prior to analysis.
3.4 Antibacterial assessment of the electrospun fibers
3.4.1 Nutrient Agar and Nutrient Broth preparation
The preparation of growth media for microorganisms requires ingredients which
supports basic growth of bacterial colonies, and must also be sterile so as not to grow environmental contaminants.
3.4.1.1 Nutrient Broth preparation
Ingredients of Nutrient Broth (NB) as follows:
Yeast extract 5 g/l
Nutrient Broth was prepared by adding all of NB ingredients to distilled water
and this mixture was agitated until the solution was clear and also adjusted pH value become 7 by pH meter. Then, this was sterilized in a steam autoclave under these conditions, steam at a pressure of about 15 pounds per square inch (121°C) in about 15 minutes. After that, this mixture was placed at room temperature for testing.
3.4.1.2 Nutrient Agar preparation
Ingredients of Nutrient Agar (NA) as follows:
Yeast extract 5 g/l
To mix all of them in distilled water become homogeneous solution and prepare
NA in the same way as NB in 3.4.1.1.
After that, sterilized NA was pour into the plate which agar media is liquid
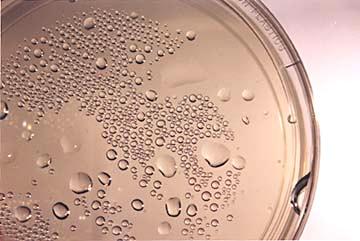
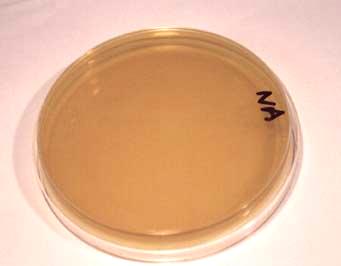
when hot while the solid when cooled (solidification occurs at approximately 45°C). If the melted media is poured too hot (above 50°C) then condensation will form inside of the plate as shown in FIGURE 3-2A. The condensation is not desirable, as it will interfere with growing isolated colonies of bacteria. A nutrient agar plate which has been poured properly at the proper temperature and with sterile technique as shown in FIGURE 3-2B. Notice there is no condensation and there is currently no growth of any kind on the agar surface.
(A) Improper plate
(B) Proper plate
FIGURE 3-2 Agar plate [21]
3.4.2 Streak plate method of isolation
The streak plate technique is essentially a method to dilute the number of
organisms, decreasing the density. This allows for individual colonies to be isolated from other colonies. Each colony is considered "pure," since theoretically, the colony began with an individual cell. Streak plate method is following below.
The inoculating loop as shown in FIGURE 3-3 was sterilized into the flame
until the metal must glow red to refer that sterilization was considered complete and then cool by touching an uninoculated portion of the surface.
FIGURE 3-3 Inoculating loop and inoculating needle [21]
To begin with inoculating the first quadrant of an agar plate. Use a light touch.
Don't penetrate or scrap the agar surface. The microbial mixture was transferred to the edge of the agar plate with an inoculating loop or swap and then streaked out over the surface in one of several patterns as shown in FIGURE 3-4.
FIGURE 3-4 Streak plate patterns [22]
At some point in the process, single cells dropped from the loop as it was
rubbed along the agar surface and developed into separate colonies and then flamed the loop again and kept the streak plate in the incubator about 37°C for one night.
3.4.3 Starter preparation and inoculation
To inoculate a single colony in Nutrient Broth (NB) as follows:
Flame the loop until the metal must glow red and then cool it. After that, pick
out the single colony in the streak plate and put it into the NB tube, then cover the lid loosely and place into the incubator shaker with 37°C, 250 rpm for one night.
After one night, NB tube that microbial grew inside, called starter, was prepared
as a microbial stock. Microbial concentration with 1% was prepared from stock and
then inoculated into the flask which was placed in the incubator shaker with 37°C, 250 rpm for one night again.
3.4.4 Antimicrobial testing
The samples which were the electrospun fibers, that is, PVA fiber,
PVA/chitosan fibers with weight ratio as 60/40 and 50/50, respectively were tested and also nylon membrane was used as to be a control reference.
All samples were sterilized under UV laminar flow before testing with
microbial on the plate.
To prepare microbial concentration with 105 Colony-Forming Unit (CFU/ml)
from inoculated flask, microbial solution was measured the optical density with the spectrophotometer at 600 nm and then calculated the volume of microbial solution to be used in order to dilute with Nutrient Broth (NB) as shown in APPENDIX F.
In the method of antimicrobial testing, begin with 3 ml of NB was filled in the
agar plate and then placed the large piece of nylon membrane on the agar as to be base for electrospun fibers to put on it. All samples, i.e. nylon membrane(control), PVA/chitosan electrospun fiber with ratio as 60/40 and 50/50, which were cut to be a size of 5x5 mm were dip into microbial solution with 105 CFU/ml and then placed them over the nylon membrane which was on the agar plate before. Whereas, PVA electrospun fibers can dissolve rapidly in liquid thus a little drop of microbial solution about 2-3 µl was dropped onto PVA fibers that place on the agar plate instead of dipping fibers into the microbial solution as described above. Lastly, this agar plate was taken into the incubator with 37°C for 4 hours.
After that, these samples were fixed with glutaraldehyde and entered the Critical
Point Drying (CPD) process in order to stop the growth of microbial and used for Electron Microscopy to observe the scanning electron micrographs in term of the morphology of E.coli cells.
Chapter 4
Results and Discussion
Results can be classified into three parts as follows: Firstly, characterization of
PVA/chitosan(CH) solutions and PVA/chitosan electrospun fibers. Next, the effect of processing parameters (i.e. chitosan concentration in blended solution, collection distance and applied electrical potential) from electrospinning process on morphology of PVA/chitosan electrospun fibers. Lastly, antimicrobial assessment of the electrospun fibers. The first part consists of the properties of PVA/chitosan solution and PVA/chitosan electrospun fibers.
4.1 Properties of PVA/chitosan(CH) solutions
Blended ratios of PVA/chitosan solutions are divided into eleven ratios from
both 10wt% PVA/2wt% chitosan and 10wt% PVA/3wt% chitosan, respectively. The weight ratios of PVA/chitosan solutions are varied ranging from 100/0 to 0/100, respectively. TABLE 4-1 represents polymer weight(g) in blended solution of 10wt%PVA blended with chitosan at concentration of 2wt% and 3wt%, respectively which are calculated from actual weight of PVA-to-chitosan solutions per 100 g, and also weight fractions of PVA/CH are shown in TABLE 4-1.
TABLE 4-1 Polymer weight (g) in blended solutions and weight fraction of
PVA/CH in various PVA-to-CH weight ratios.
Polymer weight (g)
Polymer weight (g)
per 100 g of blended
per 100 g of blended
The properties including viscosity and conductivity of PVA, chitosan and
PVA/chitosan solutions were measured and listed from TABLE 4-2 to 4-3 and
FIGURE 4-1 to 4-2.
TABLE 4-2 Properties of blended solutions with concentrations of
10 wt%PVA and 2 wt% chitosan.
Weight ratio
Weight ratio
of chitosan
solution
solution
TABLE 4-3 Properties of blended solutions with concentrations of
10 wt% PVA and 3 wt% chitosan.
Weight ratio
Weight ratio
of chitosan
solution
solution
4.1.1 Viscosity of solutions FIGURE 4-1 shows that the weight ratio of chitosan solution as 10% showed
the highest viscosity in both blended solution of 10wt%PVA and chitosan with concentration of 2wt% and 3wt%, respectively. It was presumed that there were attractive interactions such as hydrogen bonds between hydroxyl group in PVA and amino group in chitosan. This reason was referred by Duan et al. [6] that there were attractive interactions such as hydrogen bonds between chitosan and PEO which resulted in the increase of the viscosity of chitosan/PEO solutions compared with individual solutions. The viscosity of blended solutions between PVA and 2wt%chitosan declined sharply with enhancing the weight ratio of chitosan solution. That would be the result of the interference of chitosan to the chain entanglement of PVA. Moreover, it would be the dilution effect of 2wt%chitosan solution with low viscosity. Also, less polymer weights in blended solutions contribute to lower viscosity of blended solutions.
Similarly, the viscosity of blended solutions between PVA and 3wt% chitosan
increased when chitosan was added 10% in the blend solution and after that, the viscosity dropped slowly as well. Whereas the weight ratio of chitosan solution from 80 to 100 wt% the graph rose slightly, this was due to the strong influence of viscosity of 3wt% chitosan that was higher than PVA. Furthermore, the viscosity of PVA blended with 3wt%chitosan had a higher value than PVA blended with 2wt%chitosan because high concentration leads to high viscosity.
10wt%PVA:2wt%chitosan 10wt%PVA:3wt%chitosan
sity 1500
Weight ratio of chitosan solution (%)
FIGURE 4-1 Viscosity of blend solution of 10wt% PVA and chitosan
at concentration of 2wt% and 3wt% as a function of the
weight ratio of chitosan solution.
4.1.2 Conductivity of solutions
FIGURE 4-2 shows that the conductivity of chitosan solution was higher than
PVA solution, as a result of the protonation of –NH2 groups of chitosan in acetic acid aqueous solution as used to be solvent for chitosan. With the addition of PVA, the conductivities of PVA/chitosan solutions decreased continuously. It may be that there are intermolecular interactions among chitosan and PVA, and these interactions could be caused by hydrogen bonds between the hydroxyl group of PVA and –NH2 groups of chitosan, so that the degree of protonation of –NH2 groups decreased in acetic acid aqueous solution. Moreover, higher concentration of chitosan, higher value of conductivity in blended solutions due to an increase in the amount of –NH2 groups of chitosan contributes to a rise in the degree of protonation which it is proportional to the amount of –NH2, i.e. the amount of chitosan and its degree of deacetylation [6].
Weight ratio of chitosan solution (%)
FIGURE 4-2 Conductivity of blend solution of 10wt% PVA and
chitosan at concentration of 2wt% and 3wt% as a
function of the weight ratio of chitosan solution.
4.2 Electrospun PVA/chitosan fibers
In case of 10 wt% PVA blended with 2 wt% chitosan in aqueous 2 %v/v acetic
acid, electrospun PVA/chitosan fibers could be obtained with ratio of PVA-to-chitosan ranging from 90/10 to 30/70. Whereas, more contents of chitosan were added in blended solution, the solution drop could be only seen. Moreover, the blended solutions with concentrations of 10 wt% PVA / 3 wt% chitosan in aqueous 2 %v/v acetic acid, electrospun could be only found with ratio of PVA/chitosan ranging from 90/10 to 50/50. This might be the result of too high of viscosity of blended solution.
The suitable condition for producing PVA/chitosan fibers from the
electrospinning process as follows: applied electrical potential is 15 kV and collection distance is 10 cm.
4.3 Characterization of electrospun fibers
10wt% PVA/2wt%chitosan electrospun fibers were only prepared and be
measured by using Fourier-transform infrared spectroscopy (FT-IR) and Differential Scanning Calorimetry (DSC) to confirm the appearance of PVA and chitosan in electospun fibers.
4.3.1 Fourier-transform Infrared Spectroscopy (FT-IR)
FIGURE 4-3 represents the peaks at 1432 cm-1 (CH2 bending), 1736 cm-1
(residual acetyl groups), and 3354 cm-1(-OH stretching) were obvious in the spectra of pure PVA.
Residual acetyl groups
FIGURE 4-3 FTIR spectra of electrospun PVA fibers.
FIGURE 4-4 illustrates FTIR spectra of chitosan at 3431 cm-1 in the region of
3000 cm-1 to 3700 cm-1 of the spectrum, indicating a band corresponding to the
stretching of OH and NH groups. This band is broad because of the hydrogen bonds.
The -OH band overlaps the stretching band of -NH. Also, the peak at 1656 cm-1
(C=O-NHR) and the amine –NH2 transmittance band at 1598 cm-1 were observed.
-OH, -NH stretching
FIGURE 4-4 FTIR spectra of chitosan powder.
The FTIR spectra of electospun PVA/chitosan fibers with blend ratios ranging
from 90/10 to 50/50 were all the same as shown in FIGURE A-1 to A-5 (Appendix A). It can be found the peaks over the wave number range of 3,345-3,356 cm-1 that represent to OH stretching and -NH stretching and also the peak at 1735 cm-1 (C=O-NHR) was observed. The FTIR spectra all are compared in FIGURE 4-5. Thus, it can be said that electospun PVA/chitosan fiber was produced from both PVA and chitosan exactly.
FIGURE 4-5 Comparison of FTIR spectra of electrospun PVA/chitosan fibers
in various PVA-to-chitosan weight ratios
4.3.2 Differential Scanning Calorimetry (DSC)
Most polysaccharides do not melt but degrade upon heating above a certain
temperature because of associations through hydrogen bonding. Below the temperatures of polymer degradation, their thermograms show a very broad endothermic peak that is associated with the water evaporation [6].
FIGURE B-1 and B-2 (Appendix B) represent that in the DSC curve of PVA
and chitosan, a broad peak at approximately 100°C was corresponding to the water evaporation process. Also, electrospun PVA fibers exhibited an endothermic melting transition at 193.5°C. This same peak also appeared in the DSC curve of PVA/chitosan electrospun fibers with various blend ratios from 90/10 to 50/50 as shown in FIGURE B-3 to B-7 (appendix B). There are a little shift of the endothermic melting transition ranging from 192.2°C of PVA/chitosan electrospun as 90/10 to 188.4°C of PVA/chitosan electrospun as 50/50 as shown in FIGURE 4-6 below.
FIGURE 4-6 Comparison of DSC thermogram of PVA/chitosan electrospun fibers
with various ratios as follows: (A) chitosan, (B) PVA fiber PVA/chitosan: (C) 90/10, (D) 80/20, (E) 70/30, (F) 60/40, (G) 50/50.
4.4 Parameters of electrospinning process
The following parameters and processing variables affect the electrospinning
process: (a) System parameters such as molecular weight, molecular-weight distribution and architecture (branched, linear etc.) of the polymer and solution properties (viscosity, conductivity and surface tension), and (b) process parameters such as electric potential, flow rate and concentration, distance between the capillary and collection screen, ambient parameters (temperature, humidity and air velocity in the chamber) and final motion of target screen [22].
4.4.1 Effect of concentration of chitosan in PVA/chitosan solution
PVA/chitosan electrospun fibers were obtained by electrospinning process from
10wt%PVA/2wt%chitosan and 10wt%PVA/3wt%chitosan solution, respectively in the following condition: 10 cm collection distance and 15 kV applied electrical potential.
4.4.1.1 10 wt%PVA blended with 2 wt%chitosan
TABLE 4-4 illustrates the effect of concentration of chitosan with 2wt% to be
blended with 10wt%PVA in PVA/chitosan solution at various ratios of PVA-to-chitosan on morphology of electrospun fibers.
TABLE 4-4 The effect of ratio of PVA-to-chitosan in 10wt%PVA/2wt%chitosan
solution on morphology of electrospun fibers.
Fiber diameters (nm)
weight ratio (%)
electrospun fibers
Scanning electron micrographs of the electrospun PVA/chitosan fibers prepared
from 10 wt% PVA blended with 2 wt% chitosan in aqueous 2 %v/v acetic acid at
various ratios of PVA-to-chitosan are shown in FIGURE 4-7. The fibers diameters
were decreased continuously at ratios ranging from 90/10 to 30/70 (FIGURE 4-7A to
4-7G). The continuous fibers can be seen from FIGURE 4-7A to 4-7D. And also the
fibers were found bonded at their contact sites. This could be caused by incomplete
evaporation of solvents (both distilled water and dilute aqueous acetic acid). At 50/50
weight ratio, there was found small amount of bead-fibers (FIGURE 4-7E). The large
amounts of beads were generated without continuous electrospun fibers (FIGURE
4-7F to 4-7G). When the weight ratio of chitosan solution was more than 70%, the
formation of such droplets occurred that due to the capillary breakup of the polymer
jet by surface tension and also improper viscosity of this ratio solution to be spun.
Unless completely breakup of the polymer jet in order to happen the capillary
instability, the beaded fibers could be occurred. As a result of, the polymer jets
between the droplets formed electrospun fibers and together with the contraction of
the radius of the jets that was driven by surface tension, this lead to the remaining solution to form beads. [1]
FIGURE 4-7 Scanning electron micrographs (original magnification 10x103) of
electrospun 10wt%PVA blended with 2 wt% chitosan fibers in
various PVA-to-chitosan weight ratios:
(A) 90/10 (B) 80/20 (C) 70/30 (D) 60/40
(E) 50/50 (F) 40/60 (G) 30/70.
4.4.1.2 10wt%PVA blended with 3wt%chitosan
TABLE 4-5 illustrates the effect of concentration of chitosan with 3wt% to be
blended with 10wt%PVA in PVA/chitosan solution at various ratios of PVA-to-
chitosan on morphology of electrospun fibers.
TABLE 4-5 The effect of ratio of PVA-to-chitosan in 10wt%PVA/3wt%chitosan
solution on morphology of electrospun fibers.
Fiber diameters (nm)
weight ratio (%)
electrospun fibers
Non-uniform fiber
Non-uniform fiber
Non-uniform fiber
Non-uniform fiber
Non-uniform fiber
with a few beads
FIGURE 4-8 shows scanning electron micrographs of the electrospun
PVA/chitosan fibers prepared from 10 wt% PVA blended with 3 wt% chitosan in aqueous 2 %v/v acetic acid at various ratios of PVA-to-chitosan. The fiber diameters decreased at ratios ranging from 90/10 to 50/50 (FIGURE 4-8A to 4-8E). The fibers were found bonded at their contact sites and also the fibers were not uniform (FIGURE 4-8A to 4-8D). This might be the result of high viscous of 3 wt%chitosan and thick fibers were found. At 50/50 weight ratio, there was found the large amount of bead-fibers (FIGURE 4-8E). When the weight ratio of chitosan solution reached above 50%, the electrospinning process could not perform due to the high viscosity of PVA/chitosan solution [6].
FIGURE 4-8 Scanning electron micrographs (original magnification 10x103) of
electrospun 10 wt% PVAblended with 3 wt% chitosan fibers in
various PVA-to-chitosan weight ratios:
(A) 90/10 (B) 80/20 (C) 70/30
(D) 60/40 (E) 50/50
The scanning electron micrographs of pure PVA are shown as FIGURE 4-9 The
fiber diameters of electrospun PVA fibers are 248 ± 28 nm that is bigger than all of
PVA/chitosan fibers (Range of fiber diameters, 200-300 nm).
Fiber diameters = 248 ± 28 nm
FIGURE 4-9 Scanning electron micrographs of electrospun PVA fibers
(original magnification 10x103)
From TABLE 4-6 and FIGURE 4-10 show the fiber diameter decreased when
the weight ratio of chitosan was added more in the blend solution of the concentration of chitosan with 2wt% and 3wt%, respectively blended with 10wt% PVA. This might be the result of less viscosity and more conductivity of blended solution that leads to obtain thinner fibers. However, chitosan was added too much (above 50%), it causes the non-uniform and beaded fibers. It can be said that more amounts of PVA to be added, more uniform eletrospun fibers to be obtained.
TABLE 4-6 Average fiber diameter (nm) of PVA/chitosan fibers with various ratios
Fiber diameters (nm) of PVA/chitosan fibers
in various ratios
213±48 192±69 166±47 132±45 117±51 69±24
212±82 181±60 155±48
Note: * refers to PVA/chitosan fibers can not be spun in electrospinning
PVA/chit
FIGURE 4-10 The fiber diameters as function of the weight ratios of chitosan
solution with concentration of chitosan as 2wt% and 3wt%.
4.4.2 Effect of collection distance
To investigate the effect of collection distance on morphology of PVA/chitosan
fibers, 10wt%PVA/2wt%chitosan solution was selected for preparation of PVA/chitosan fibers with ratio of PVA-to-chitosan as 60/40 and 50/50 w/w, respectively. The applied electrical potential was held constant at 15 kV, whereas collection distances were varied as 6, 8, 10, 12 cm, respectively.
4.4.2.1 10 wt% PVA / 2 wt%chitosan with ratio as 60/40
TABLE 4-7 illustrates the effect of collection distance on morphology of 10
wt%PVA / 2 wt%chitosan with ratio as 60/40 electrospun fiber.
TABLE 4-7 The effect of collection distance on morphology of
10 wt%PVA / 2 wt%chitosan with ratio as 60/40 electrospun fiber.
Collection distance
electrospun fibers
FIGURE 4-11 represents the scanning electron micrographs of the electrospun
PVA/2wt% chitosan in the ratio of blend as 60/40 with different collection distances while the applied electrical potential was held constant at 15 kV. There was no different shape of fiber when the collection distances were varied (FIGURE 4-11A to 4-11D). Very few beads can be found when the distance was 6 cm (FIGURE 4-11A) while it was found that the continuous fiber without bead was formed as shown in FIGURE 4-11B to 4-11D. The diameter ranges of electrospun blended fibers of 10wt%PVA to 2wt%chitosan as 60/40 ratio with different collection distances ranging from 6, 8, 10 and 12 cm were compared as follows: 120-380 nm, 100-360 nm, 120-480 nm, 105-325 nm, respectively.
FIGURE 4-11 Scanning electron micrographs of electrospun 10 wt%PVA
blended with 2wt%chitosan fibers at the PVA-to-chitosan weight ratio of 60/40 under different collection distances over a fixed applied electrical potential of 15 kV:
4.4.2.2 10wt%PVA/2wt%chitosan with ratio as 50/50
TABLE 4-8 illustrates the effect of collection distance on morphology of 10
wt%PVA / 2 wt%chitosan with ratio as 50/50 electrospun fiber.
TABLE 4-8 The effect of collection distance on morphology of
10 wt%PVA / 2 wt%chitosan with ratio as 50/50 electrospun fiber.
Fiber diameter (nm)
electrospun fibers
FIGURE 4-12 shows the scanning electron micrographs of the electrospun
PVA/2wt% chitosan in the ratio of blend as 50/50 with different collection distances
while the applied electrical potential was held constant at 15 kV. Similarly, there was
no remarkable different shape of fiber when the collection distances were varied
(FIGURE 4-12A to 4-12C). Whereas, the bead was deposited on the collector as 12
cm collection distance as shown in FIGURE 4-12D. The diameter ranges of
electrospun blended fibers of 10wt%PVA to 2wt%chitosan as 50/50 ratio with
different collection distances ranging from 6, 8, 10 and 12 cm were compared as
follows: 100-340 nm, 110-300 nm, 120-260 nm and 120-290 nm, respectively.
FIGURE 4-12 Scanning electron micrographs of electrospun 10 wt%PVA
blended with 2wt%chitosan fibers at the PVA-to-chitosan weight ratio of 50/50 under different collection distances
over a fixed applied electrical potential of 15 kV:
From TABLE 4-9 and FIGURE 4-13 represent that in case of the ratio of PVA-
to-chitosan as 60/40, the fiber diameter was decreased very slightly with increase of distances. This might be the result of more elongation of the jet onto collector screen during electrospinning process. It can be said that the collection distance had no significant effect to fiber diameter of PVA/chitosan electrospun with ratio as 60/40. On the other hand, for ratio of PVA-to-chitosan as 50/50, the fiber diameter remained the stable with increase of distances from 6 to 12 cm. It can be said that the collection distance had no significant effect to the fiber diameter of electrospun PVA/chitosan with blended ratio as 50/50.
TABLE 4-9 The effect of collection distance on fiber diameters
with the ratio of PVA-to-chitosan as 60/40 and 50/50.
Collection distance
Fiber diameters of PVA-to-chitosan
weight ratios (nm)
PVA:Chitos an= 60:40
Collection distance (cm)
FIGURE 4-13 The effect of collection distance on fiber diameter
with the ratio of PVA-to-chitosan as 60/40 and 50/50.
4.4.3 Effect of applied electrical potential
To study the effect of collection distance on morphology of PVA/chitosan
fibers, 10wt%PVA/2wt%chitosan solution was selected for preparation of PVA/chitosan fibers with ratio of PVA-to-chitosan as 60/40 and 50/50, respectively. The collection distance was held constant at 10 cm, whereas the applied electrical potentials were varied as 10, 13, 15, 18, 20 kV, respectively.
4.4.3.1 10wt%PVA/2wt%chitosan with ratio as 60/40
TABLE 4-10 illustrates the effect of applied electrical potential on morphology
of 10 wt%PVA / 2 wt%chitosan with ratio as 60/40 electrospun fiber.
TABLE 4-10 The effect of applied electrical potential on morphology of
10 wt%PVA/2 wt%chitosan with ratio as 60/40 electrospun fiber.
Applied electrical
electrospun fibers
FIGURE 4-14 represents the scanning electron micrographs of the electrospun
PVA/2wt% chitosan in the ratio of blend as 60/40 with different applied electrical potentials while collection distance was held constant at 10 cm. There are no obvious different shape of fibers when the applied electrical potentials increased (FIGURE 4-14A to 4-14E). The continuous fiber was formed but it can be found the thicker fiber. The diameter ranges of electrospun blended fibers of 10wt%PVA to 2wt%chitosan as 60/40 ratio with different applied electrical potentials ranging from 10, 13, 15, 18 and 20 cm were compared as follows: 110-300 nm, 160-420 nm, 120-480 nm, 120-400 nm and 120-360 nm, respectively.
FIGURE 4-14 Scanning electron micrographs of electrospun 10wt%PVA
blended with 2wt%chitosan fibers at the PVA-to-chitosan weight ratio of 60/40 under different applied electrical potentials over a fixed collection distance of 10 cm:
4.4.3.2 10wt%PVA/2wt%chitosan with ratio as 50/50
TABLE 4-11 illustrates the effect of applied electrical potential on morphology
of 10 wt%PVA / 2 wt%chitosan with ratio as 50/50 electrospun fiber.
TABLE 4-11 The effect of applied electrical potential on morphology of
10 wt%PVA/2 wt%chitosan with ratio as 50/50 electrospun fiber.
Applied electrical
electrospun fibers
Thick fiber and a
Thick fiber and a
FIGURE 4-15 shows the scanning electron micrographs of the electrospun
PVA/2wt% chitosan in the ratio of blend as 50/50 with different applied electrical potentials while collection distance was held constant at 10 cm. The continuous fiber was obtained (FIGURE 4-15A to 4-15C). A few beaded-fibers occurred when the applied electrical potentials increased to 18 and 20 kV (FIGURE 4-15D to 4-15E). The diameter ranges of electrospun blended fibers of 10wt%PVA to 2wt%chitosan as 50/50 ratio with different applied electrical potentials ranging from 10, 13, 15, 18 and 20 cm were compared as follows: 130-330 nm, 130-260 nm, 120-260 nm, 110-330 nm and 110-300 nm, respectively.
FIGURE 4-15 Scanning electron micrographs of electrospun 10wt%PVA
blended with 2wt%chitosan fibers at the PVA-to-chitosan weight ratio of 50/50 under different applied electrical potentials over a fixed collection distance of 10 cm:
From TABLE 4-12 and FIGURE 4-16 represent that the fiber diameters of
PVA/2wt%chitosan electrospun fibers with the weight ratio of PVA-to-chitosan as 60/40 and 50/50 were slightly decreased with increasing of voltages. This might be the result of the effect of elongation of polymer jet during process. However, it can be said that the applied electrical potential had no significant effect to fiber diameters of PVA/2wt%chitosan electrospun fibers.
TABLE 4-12 The effect of applied electrical potential on fiber diameter
with the ratio of PVA-to-chitosan as 60/40 and 50/50.
Applied electrical
Fiber diameters of PVA-to-chitosan
weight ratios (nm)
PVA:Chitosan = 60:40
PVA:Chitosan = 50:50
Applied electrical potential (kV)
FIGURE 4-16 The effect of applied electrical potentials on fiber diameter
with the ratio of PVA-to-chitosan as 60/40 and 50/50.
4.5 Antimicrobial assessment
In antimicrobial assessment, 10wt%PVA/2wt%chitosan electrospun fibers with
ratio as 60/40 and 50/50, respectively prepared from electrospinning process in the following condition: 10 cm collection distance and 15 kV applied electrical potential. These electrospun fibers were determined of antimicrobial activities with Escherichia coli (E.coli) bacteria. Prior to entering the antimicrobial process, all samples need to be sterilized. But in case of PVA/chitosan electrospun fibers can be deformed by sterilization with 70%alcohol and autoclave method. Thus, radiation with Ultraviolet (UV) was used to sterilize the samples in order to kill all kinds of microorganisms due to its short wavelength and high energy before testing with E.coli in antimicrobial assessment. There are many methods to determine the antimicrobial activity such as agar plate diffusion, agar tube diffusion assay for agar medium, and turbidimetric, pH change and broth dilution assay for broth medium. In this research, the antimicrobial activitiy against E.coli of chitosan in PVA/chitosan fibers was tested by agar plate diffusion method in order to observe the clear zone or inhibition zone around the samples to refer to the inhibition to E.coli of electrospun fiber. It was found as shown in FIGURE 4-17 that there was no clear zone around electrospun PVA fiber, electrospun 10wt%PVA blended with 2wt%chitosan fiber mat at the PVA-to-chitosan weight ratio of 60/40 and 50/50 and also filter paper which was used as a reference material for this study. Since in an agar plate diffusion, an active chemical need to be able to diffuse out of the matrix into the plate in order to prohibit microorganisms growth, it was possible that chitosan molecule in the fiber mat has a very low or no diffusion at all resulting in negative antimicrobial effect. This experiment clearly indicates that the agar plate diffusion method was not suitable for testing antimicrobial assessment for PVA/chitosan fiber system.
PVA fiber
PVA/chitosan = 60/40
PVA/chitosan = 50/50
Filter paper (control)
FIGURE 4-17 Agar plate diffusion method
Lastly, Agar medium was used to assess the antimicrobial activity again but the inhibition zone was not studied. Scanning electron micrographs of electrospun fibers which were tested with E.coli solution with concentration as 105CFU/ml for four hours were observed in terms of the cell morphology of E.coli in qualitative method instead. Nylon membrane was used to be control sample while PVA electrospun fiber and PVA/chitosan electrospun fibers with ratios as 60/40 and 50/50, respectively were used to be test samples. This result was represented in FIGURE 4-19. From FIGURE 4-19A to 4-19D, when incubation time increased to four hours, the E.coli cells divided into multiple cells. The binary fission (cell division) of E.coli cells can be seen obviously in FIGURE 4-19A4 and 4-19B4. The cells had the long rod shape and aggregated condensely. It can be said that the E.coli cells grew well on nylon membrane and PVA electrospun fiber due to there was no growth inhibition agent to microorganism in PVA and nylon membrane. On the other hand, the E.coli cells on PVA/chitosan electrospun fibers with ratios as 60/40 (FIGURE 4-19C4) can grow a little bit but abnormal cells were found. Similarly, the cells stopped growing, no binary fission and also abnormal cells (e.g. rough cell membrane and incomplete cell shape) were appeared on PVA/chitosan electrospun fibers with ratios as 50/50 as shown in FIGURE 4-19D4. This may be the result of two mechanisms of the antimicrobial activity of chitosan either the cationic nature of chitosan causes it to bind with sialic acid in phospholipids of E.coli cell membrane as shown in FIGURE 4-18, consequently restraining the movement of microbiological substances or oligomeric chitosan penetrates into the cells of microorganisms and prevents the growth of cells by preventing the transformation of DNA into RNA [12].
FIGURE 4-18 The structure of the E.coli bacterium.
Incubation time (hour)
FIGURE 4-19 Scanning electron micrographs of the growth of E.coli for 4 hours
incubation time on the following samples in antimicrobial test
(original magnification 5x10³): (A0 to D0) and (A4 to D4) as to be
0 and 4 hour incubation time for Nylon membrane, PVA fiber,
PVA/chitosan fibers with ratio as 60/40 and 50/50.
Chapter 5
Conclusions and Suggestions
5.1 Conclusions
5.1.1 Electrospun fibers from solution of 10wt%PVA blended with
2wt%chitosan and 3wt%chitosan, respectively can be prepared in the electrostatic
process.
5.1.2 Both beaded-fibers and non-uniform fibers can be obtained from
10wt%PVA/3wt%chitosan solution. Therefore, it can be said that 3wt%chitosan is not
proper concentration to blend with 10wt%PVA in order to become electrospun fibers.
5.1.3 The fiber diameters of PVA/chitosan electrospun fibers were decreased
with increasing of the weight ratio of chitosan solution.
5.1.4 Both the collection distance and the applied electrical potential which are
parameters in electrospinning had no significant effect to fiber diameters of
10wt%PVA/2wt%chitosan fibers with ratios as 60/40 and 50/50 because of a slight
change of fiber diameters.
5.1.5 The suitable condition for producing PVA/chitosan fibers from the
electrospinning process as follows: applied electrical potential is 15 kV and collection
distance is 10 cm.
5.1.6 PVA/chitosan electrospun fibers at ratios of 60/40 and 50/50 w/w had
antimicrobial activity that is Escherichia coli (E.coli), which is gram-negative
bacteria, can be inhibited strongly by these fibers. This might be the result of
antibacterial activity of chitosan in electrospun fiber. This is the preliminary
experiment in antimicrobial test and it leads to be feasible to apply PVA/chitosan
electrospun fibers at ratios of 60/40 and 50/50 in biomedical application such as
wound dressing.
5.2 Suggestions
5.2.1 As a result of PVA/chitosan electrospun fibers in ratios of 60/40 and 50/50
w/w had good antimicrobial activity to E.coli bacteria, antimicrobial assessment of
PVA/chitosan electrospun fiber with different bacteria strains such as Staphylococcus
aureus (gram-positive bacteria) and Pseudomonas aeruginosa (gram-negative
bacteria) which were found around the wound area should be investigated in order to
develop wound dressing material. 5.2.2 Because PVA can dissolve readily in water, PVA electrospun fiber is very
difficult to test in antimicrobial method efficiently. Thus, cross-linked PVA or
alternative polymer might be a better material for such application.
REFERENCES
1. Koski A., Yim K.and Shivkumar S. "Effect of molecular weight on fibrous PVA
produced by electrospinning." Materials Letters 58, (2004) : 493-497.
2. David R. Salen (editor). Structure formation in polymeric fibers. First
Edition. Munich : Hanser Gardner Publications, Inc., 2001 : 225-246.
3. Ding, Kim, et al. "Preparation and characterization of a nanoscale poly
(vinyl alcohol) fiber aggregate produced by an electrospinning method."
Journal of polymer science: Part B: Polymer Physics. 40, (2002) : 1261-
4. Kamonrat K. and Kanokwan P. "Biomedical in electrospinning of nanofibers:
preparation and characterization of poly (vinyl alcohol) blend alginate
fibers for wound dressing." Bachelor project, Faculty of applied science,
King Mongkut's Institute of Technology North Bangkok, 2003.
5. Siriorn P. and Witchuporn U. "Biomedical in electrospinning of nanofibers:
preparation and characterization of polycaprolactone fibers for wound
dressing." Bachelor project, Faculty of applied science, King Mongkut's
Institute of Technology North Bangkok, 2003.
6. Duan, Dong, et al. "Electrospinning of chitosan solutions in acetic acid with poly
(ethylene oxide)." J. Biomater. Sci. Polymer Edn. 15(6), (2004) : 797-811.
7. Ohkawa, Cha, et al. "Electrospinning of chitosan." Macromol. Rapid Commun.
25, (2004) : 1600-1605.
8. Zhang, Yuan, et al. "Study on morphology of electrospun poly (vinyl alcohol)
mats." European Polymer Journal. 41, (2005) : 423-432.
9. Son, Youk, et al. "Effect of pH on electrospinning of poly (vinyl alcohol)."
Materials Letters (2005).
10. Geng, Kwon and Jang. "Electrospinning of chitosan dissolved in concentrated
acetic acid solution." Biomaterials (accepted 19 Jan 2005).
11. Begin and Calsteren. "Antimicrobial films produced from chitosan."
International Journal of Biological Macromolecules. 26, (1999) : 63-67
12. Sashiwa and Aiba. "Chemically modified chitin and chitosan as biomaterials."
Prog. Polym. Sci. 29, (2004) : 887-908.
13. Zheng and Zhu. "Study on antimicrobial activity of chitosan with different
molecular weights." Carbohydrate Polymers. 54, (2003) : 527-530.
14. Srinivasa, Ramesh, et al. "Properties and sorption studies of chitosan-poly(vinyl
alcohol) blend films." Carbohydrate Polymers. 53, (2003) : 431-438.
15. Medical Plastics and Biomaterials Magazine. Synthetic Biodegradable
Polymers as medical devices. Available online at
16. Kenneth Todar University of Wisconsin-Madison Department of Bacteriology.
Todar's Online Textbook of Bacteoriology. Available online at
17. Escherichia coli. Available online at
18. Prescott, Harley and Klein. Microbiology. Fifth edition. Singapore : The
McGraw-Hill Companies, Inc., 2003.
19. Tortora, Funke and Case. Microbiology an introduction. Eighth edition. San
Francisco, U.S.A : Pearson Education, Inc., 2004.
20. Kenneth Todar University of Wisconsin-Madison Department of Bacteriology.
Todar's Online Textbook of Bacteoriology. Available online at
nutritionandgrowthof bacteria.html
21. Available online at 22. Frenot A. and Chronakis I. "Polymer nanofibers assembled by electrospinning."
Current Opinion in colloid and Interface Science. Article in press, 2003.
23. Barry L. Batzing. Microbiology and Introduction. U.S.A : Thomson Learning,
Inc., 2002.
24. Sevda Snel and Susan J. McClure. "Potential applications of chitosan in veterinary
medicine." Advanced Drug Delivery Reviews. 56, (2004) : 1467-1480.
25. Jacquelyn G. Black. Microbiology (Principles and Explorations). Fifth edition.
U.S.A : John Wiley& Sons, 2002.
26. Severian Dumitriu. Polymeric Biomaterials. Second Edition. New York, U.S.A :
Marcel Dekker, 2002.
27. Margaret A. Bartelt. Diagnostic Bacteriology (A study guide). Philadephia,
U.S.A : F.A. Davis company, 2000.
28. Jutawan Sutasinpromprae. "Preparation and characterization of very fine
electrospun polyacrylonitrile fibers as a precursor for carbon fibers."
Masters thesis, faculty of science, The Petroleum and Petrochemical
College, Chulalongkorn University, 2003.
29. Min, Lee, et al. "Chitin and chitosan nanofibers: electrospinning of chitin and
deacetylation of chitin nanofibers." Polymer. 45, (2004) : 7137-7142.
30. Yang and Lin. "Properties of chitosan containing PP-g-AA-g-NIPAAm bigraft
nonwoven fabric for wound dressing." Journal of Membrane Science.
243, (2004) : 1-7.
31. Manisara P., Ratana R. and Pitt S. "Characterization of beta-chitin/poly(vinyl
alcohol) blend films." Polymer Testing. 22, (2003) : 381-387.
32. Mucha and Pawlak. "Thermal analysis of chitosan and its blends."
Thermochimica Acta. 427, (2005) : 69-76.
33. Zhai, Zhao, et al. "Study on antibacterial starch/chitosan blend film formed under
the action of irradiation." Carbohydrate Polymers. 57, (2004) : 83-88.
34. Qi, Jiang et al. "Preparation and antibacterial activity of chitosan nanoparticles."
Carbohydrate Research. 339, (2004) : 2693-2700.
35. Huang, Du et al. "A new approach to chemically modified chitosan sulfates and
study of their influences on the inhibition of Escherichia coli and
Staphylococcus aureus growth." Reactive & Functional Polymers. 59,
36. Kenawy and Abdel-Fattah. "Antimicrobial properties of modified and
electrospun poly(vinyl phenol)." Macromol. Biosci. 2, (2002) : 261-266.
37. Guan, Y., Fu, Q., & Zhu, L. Application and Explore, 2, 35 (1997).
38. Hong Kyoon, N., Na, Y.P., Shin, H.L., et al. International Journal of Food
Microbiology, 74, 65 (2002).
39. Shin, Y.-S., Min, K., &Kim, H.-K. Advance in chitin Science, 2 (1997) : 771.
40. Xia, W. Journal of Wuxi University of Light Industry, 15, 4 (1996) : 297.
41. Brandrup J. and Immergut E.H., Third edition, Polymer Handbook. U.S.A :
A Wiley-Interscience publication, John Wiley & Sons, 1989.
42. Hunt B.J. and James M.I. Polymer Characterization. London, U.K : Blackie
Academic & Professional, an imprint of Chapman & Hall, 1993.
43. Huang Z. et al. "A review on polymer nanofibers by electrospinning and their
applications in nanocomposites." Composites Science and Technology, 63
(2003) : 2223-2253.
44. Available online at 45. Available online at
APPENDIX A
FTIR spectra of PVA/chitosan electrospun fibers
Figure A-1 FTIR spectra of PVA/chitosan electrospun with ratio of
blend as 90/10.
Figure A-2 FTIR spectra of PVA/chitosan electrospun with ratio of
blend as 80/20.
Figure A-3 FTIR spectra of PVA/chitosan electrospun with ratio of
blend as 70/30.
Figure A-4 FTIR spectra of PVA/chitosan electrospun with ratio of
blend as 60/40.
Figure A-5 FTIR spectra of PVA/chitosan electrospun with ratio of
blend as 50/50.
APPENDIX B
DSC thermograms of PVA electrospun, chitosan, PVA/chitosan electrospun
Figure B-1 DSC thermogram of electrospun PVA fibers
Figure B-2 DSC thermogram of chitosan powder.
Figure B-3 DSC thermogram of PVA/chitosan electrospun
with ratio of blend as 90/10.
Figure B-4 DSC thermogram of PVA/chitosan electrospun
with ratio of blend as 80/20.
Figure B-5 DSC thermogram of PVA/chitosan electrospun
with ratio of blend as 70/30.
Figure B-6 DSC thermogram of PVA/chitosan electrospun
with ratio of blend as 60/40.
Figure B-7 DSC thermogram of PVA/chitosan electrospun
with ratio of blend as 50/50.
APPENDIX C
Range of fiber diameters of PVA electrospun, 10wt%PVA/2wt%chitosan with
ratios ranging from 30/70 to 90/10, and 10wt%PVA/3wt%chitosan with ratios
ranging from 50/50 to 90/10, respectively.
Std. Dev = 27.50 Mean = 247.7
Figure C-1 Range of fiber diameters of electrospun PVA fibers.
PVA blended with 2wt%chitosan
Std. Dev = 11.62
50.0 55.0 60.0 65.0 70.0 75.0 80.0 85.0 90.0 95.0 100.0
Figure C-2 Range of fiber diameters of PVA/2wt%chitosan
with ratio as 30/70.
PVA blended with 2wt%chitosan
Std. Dev = 24.47 Mean = 69.2
Figure C-3 Range of fiber diameters of PVA/2wt%chitosan
with ratio as 40/60.
PVA blended with 2wt%chitosan
Std . Dev = 50.56 Mean = 117.4
Figure C-4 Range of fiber diameters of PVA/2wt%chitosan
with ratio as 50/50.
PVA blended with 2wt%chitosan
Std. Dev = 44.97 Mean = 132.5
Figure C-5 Range of fiber diameters of PVA/2wt%chitosan
with ratio as 60/40.
PVA blended with 2wt%chitosan
Std. Dev = 46.67 Mean = 165.5
Figure C-6 Range of fiber diameters of PVA/2wt%chitosan
with ratio as 70/30
PVA blended with 2wt%chitosan
Std . Dev = 69.39 Mean = 191.7
Figure C-7 Range of fiber diameters of PVA/2wt%chitosan
with ratio as 80/20.
PVA blended with 2wt%chitosan
Std. Dev = 47.78 Mean = 213.1
Figure C-8 Range of fiber diameters of PVA/2wt%chitosan
with ratio as 90/10.
PVA blended with 3wt%chitosan
Std . Dev = 45.80 Mean = 100.2
Figure C-9 Range of fiber diameters of PVA/3wt%chitosan
with ratio as 50/50.
PVA blended with 3wt%chitosan
Std . Dev = 35.59 Mean = 95.5
Figure C-10 Range of fiber diameters of PVA/3wt%chitosan
with ratio as 60/40.
PVA blended with 3wt%chitosan
Std. Dev = 48.05 Mean = 155.2
Figure C-11 Range of fiber diameters of PVA/3wt%chitosan
with ratio as 70/30.
PVA blended with 3wt%chitosan
Std. Dev = 60.10 Mean = 181.2
Figure C-12 Range of fiber diameters of PVA/3wt%chitosan
with ratio as 80/20.
PVA blended with 3wt%chitosan
Std. Dev = 81.59 Mean = 212.1
100.0 140.0 180.0 220.0 260.0 300.0 340.0 380.0 420.0 460.0
120.0 160.0 200.0 240.0 280.0 320.0 360.0 400.0 440.0
Figure C-13 Range of fiber diameters of PVA/3wt%chitosan
with ratio as 90/10.
APPENDIX D
Range of fiber diameters of 10wt%PVA/2wt%chitosan with ratios
as 60/40 and 50/50 at various collection distances.
Std . Dev = 47.07 Mean = 227.4
Figure D-1 Range of fiber diameters of PVA/chitosan with ratio
as 60/40 at 6 cm collection distance.
Std. Dev = 47.17 Mean = 192.0
Figure D-2 Range of fiber diameters of PVA/chitosan with ratio
as 60/40 at 8 cm collection distance.
Std. Dev = 50.63 Mean = 205.5
120.0 160.0 200.0 240.0 280.0 320.0 360.0 400.0 440.0 480.0
140.0 180.0 220.0 260.0 300.0 340.0 380.0 420.0 460.0
Figure D-3 Range of fiber diameters of PVA/chitosan with ratio
as 60/40 at 10 cm collection distance.
Std . Dev = 33.00 Mean = 199.4
Figure D-4 Range of fiber diameters of PVA/chitosan with ratio
as 60/40 at 12 cm collection distance.
Std. Dev = 41.95 Mean = 178.9
Figure D-5 Range of fiber diameters of PVA/chitosan with ratio
as 50/50 at 6 cm collection distance.
Std. Dev = 31.89 Mean = 175.0
115.0 135.0 155.0 175.0 195.0 215.0 235.0 255.0 275.0 295.0
Figure D-6 Range of fiber diameters of PVA/chitosan with ratio
as 50/50 at 8 cm collection distance.
Std . Dev = 23.62
Figure D-7 Range of fiber diameters of PVA/chitosan with ratio
as 50/50 at 10 cm collection distance.
Std. Dev = 29.43 Mean = 183.6
125.0 145.0 165.0
185.0 205.0 225.0
245.0 265.0 285.0
Figure D-8 Range of fiber diameters of PVA/chitosan with ratio
as 50/50 at 12 cm collection distance.
APPENDIX E
Range of fiber diameters of 10wt%PVA/2wt%chitosan with ratios
as 60/40 and 50/50 at various applied electrical potentials.
Std . Dev = 34.77 Mean = 195.5
115.0 135.0 155.0 175.0 195.0 215.0 235.0 255.0 275.0 295.0
Figure E-1 Range of fiber diameters of PVA/chitosan with ratio
as 60/40 at 10 kV applied electrical potential.
Std. Dev = 37.32 Mean = 226.4
Figure E-2 Range of fiber diameters of PVA/chitosan with ratio
as 60/40 at 13 kV applied electrical potential.
Std. Dev = 50.63 Mean = 205.5
120.0 160.0 200.0 240.0 280.0 320.0 360.0 400.0 440.0 480.0
140.0 180.0 220.0 260.0 300.0 340.0 380.0 420.0 460.0
Figure E-3 Range of fiber diameters of PVA/chitosan with ratio
as 60/40 at 15 kV applied electrical potential.
Std . Dev = 44.03 Mean = 192.2
Figure E-4 Range of fiber diameters of PVA/chitosan with ratio
as 60/40 at 18 kV applied electrical potential.
Std. Dev = 46.34 Mean = 205.0
Figure E-5 Range of fiber diameters of PVA/chitosan with ratio
as 60/40 at 20 kV applied electrical potential.
Std. Dev = 32.24
Figure E-6 Range of fiber diameters of PVA/chitosan with ratio
as 50/50 at 10 kV applied electrical potential.
Std . Dev = 25.07 Mean = 177.6
Figure E-7 Range of fiber diameters of PVA/chitosan with ratio
as 50/50 at 13 kV applied electrical potential.
Std. Dev = 23.62
Figure E-8 Range of fiber diameters of PVA/chitosan with ratio
as 50/50 at 15 kV applied electrical potential.
Std . Dev = 42.91 Mean = 164.3
Figure E-9 Range of fiber diameters of PVA/chitosan with ratio
as 50/50 at 18 kV applied electrical potential.
Std. Dev = 39.71 Mean = 177.3
115.0 135.0 155.0 175.0 195.0 215.0 235.0 255.0 275.0 295.0
Figure E-10 Range of fiber diameters of PVA/chitosan with ratio
as 50/50 at 20 kV applied electrical potential.
APPENDIX F
Antimicrobial assessment
a) Estimating bacterial numbers by indirect methods Turbidity
Turbidity is a practical way of monitoring bacterial growth. As bacteria multiply
in a liquid medium, the medium becomes turbid, or cloudy with cells. The instrument used to measure turbidity is a spectrophotometer (or colorimeter). In the spectrophotometer, a beam of light is transmitted through a bacterial suspension to a light-sensitive detector as shown in Figure F-1 below.
Figure F-1 Turbidity estimation of bacterial numbers.
As bacterial numbers increase, less light will reach the detector. This change of
light will register on the instrument's scale as the percentage of transmission. Also printed on the instrument's scale is a logarithmic expression called the absorbance (sometimes called optical density, or OD). The absorbance is used to plot bacterial growth. About 10 million to 100 million cells per milliliter are needed to make a suspension turbid enough to be read on a spectrophotometer. Therefore, turbidity is not a useful measure of contamination of liquids by relatively small numbers of bacteria.
b) Preparation of microbial concentration with 105 CFU/ml
For example, OD = 2.163
= 2.163 x10⁶ CFU/ml
To prepare total volume to be 10 ml
Need to used NB for dilution = 10-0.46 = 9.54 ml
In conclusion, to prepare 105 CFU/ml of microbial solution, the microbial
solution in inoculated flask is used as 0.46 ml and mix with NB as 9.54 ml.
BIOGRAPHY
Name : Ms. Sunisa Panboon Thesis Title : Electrospinning of Poly(vinyl alcohol)/Chitosan Fibers for Wound
Dressing Applications
Major Field : Materials Science Biography University Education :
Bachelor Degree of science in Materials Science (2nd Class Honours), Faculty of science, Chulalongkorn University, Bangkok, Thailand.
23/07/01-14/12/01
A 20-week intensive Academic English language
program in advanced level, Centre for English Teaching, The University of Sydney, Australia.
Master Degree of science in Materials Science,
Industrial Chemistry department, Faculty of Applied Science, King Mongkut's Institute of Technology North Bangkok, Thailand. Address :
115/15 Moo.8 Soi Tiwanon31 Tiwanon road Bangkrasor district Muang Nonthaburi 11000
E-mail address :
Source: http://www.gits.kmutnb.ac.th/ethesis/data/isbn9741904762.pdf
id4396875 pdfMachine by Broadgun Software - a great PDF writer! - a great PDF creator! - http://www.pdfmachine.com http://www.broadgun.com AVIAN AND PANDEMIC INFLUENZA AVIAN AND PANDEMIC INFLUENZA BASICS WHAT IS INFLUENZA? WHAT IS AVIAN INFLUENZA? HOW AVIAN FLU SPREADS? WHAT ARE THE SYMPOMS OF A1 IN BIRDS? WHAT ARE THE SYMPOMS OF A1 IN HUMANS?
Two major studies conclude that saturated fat does NOT cause heart disease Dr Briffa's . Page 1 of 32 Two major studies conclude that saturated fat does NOT cause heart diseaseby Dr John Briffa on 15 January 2010 in Cholesterol and Statins, Food and Medical Politics, Healthy Eating,Unhealthy Eating!


