Microsoft word - volume ii main report 091215.doc


VOLUME II
MAIN REPORT
Assessment of the Value of the
Protected Area System of Ethiopia,
"Making the Economic Case"
Ethiopian Wildlife Conservation Authority
Sustainable Development of the Protected Areas System
of Ethiopia (SDPASE) Project
Your contact at ÖBf:
Alois Schuschnigg and Alexander Horst
Pummergasse 10-12
3002 Purkersdorf
Tel: +43-2231-600 55 20
Fax: +43-2231-600 55 09
Email: [email protected]
and/or [email protected]
TABLE OF CONTENT
TABLE OF CONTENT. iii
LIST OF TABLES. v
LIST OF MAPS. vi LIST OF FIGURES .vii
EXCHANGE RATE.vii ABBREVIATIONS .viii
SECTION 1: EXECUTIVE SUMMARY. 1 SECTION 2: INTRODUCTION. 3
2.1 Study Objective .3 2.2 Methodology and Tools Employed.3
2.2.1 UNDP Financial Sustainability Scorecards.3
2.2.2 WWF Protected Areas Benefits Assessment Tool .5
2.2.3 Study Limitations.5
SECTION 3: BACKGROUND. 6
3.1 Policy and Legal Framework .6
3.2 The SDPASE Project .8
3.3 Ethiopia's Protected Areas System.8
SECTION 4: UNDP FINANCIAL SUSTAINABILITY SCORECARDS . 14
4.1 Overview of Sustainable Financing of Protected Areas.14 4.2 National Scorecard for EWCA .15
4.2.1 Financial Analysis .15 4.2.2 Management Framework .16
4.3 Scorecard for Bale Mountains National Park .17
4.4.1 Financial Analysis .17
4.3.2 Management Framework .18 4.3.3 Financial and Management Aspects .19
4.4 Scorecard for Gambella National Park .21
4.4.1 Financial Analysis .21
4.4.2 Management Framework .21
4.4.3 Financial and Management Aspects .22
SECTION 5: EWCA FINANCIAL ANALYSIS . 24
5.1 EWCA Budget .24 5.2 EWCA Income.26
SECTION 6: EWCA FINANCIAL NEEDS. 32
6.1 Scenario 1: Resource Protection.32
6.2 Scenario 2: Basic Management and Investment .34
6.3 Scenario 3: Effective Management .35 6.4 Summary.35
SECTION 7: THE ECONOMIC VALUE OF PROTECTED AREAS. 36
7.1 The Value of the Ethiopian Protected Areas System .38
7.1.1 Watershed Protection for Sustainable Development.38 7.1.2 Carbon Stock .41
7.1.3 Biodiversity.42 7.1.4 Medicinal Plants.43
7.1.5 Genetic Resources .44 7.1.6 Sedimentation and Soil Erosion .45
7.1.7 Cost of Deforestation .46
7.2 The Economic Value of Bale Mountains National Park .48
7.2.1 Direct Use Values .50
7.2.2 Indirect Use Values .59 7.2.3 Option Values.61
7.2.4 Existence Values.62 7.2.5 Summary of Economic Values .63
7.3 The Economic Value of Gambella National Park .65
7.3.1 Direct Use Values .68
7.3.2 Indirect Use Values .74 7.3.4 Summary of Economic Values .76
SECTION 8: MOVING TOWARDS EFFECTIVE MANAGEMENT . 78
8.1 Strengths, Weaknesses, Opportunities and Threats Analysis .78
8.2 IUCN Suggested Management Framework for PAs .80
8.3 The Way Ahead - Recommended Actions.81
8.3.1 Securing Government Funding .81
8.3.2 Revenue Retention Scheme .82
8.3.3 Donor Programmes .83
8.3.4 Trust Fund .83
8.3.5 Reducing the EWCA Barriers to Implementation .84
8.3.6 Local Communities, Employment and Funding .84
8.3.7 Cost Sharing Opportunities .85 8.3.8 "Green" Marketing .87
8.3.9 Payment for Ecosystem Services .87 8.3.10 Carbon Sequestration Payments .88
SECTION 9: BIBLIOGRAPHY. 90
LIST OF TABLES
Table 1: Protected Areas managed and regulated by EWCA .10 Table 2: Protected Area managed by Regional Authorities .11
Table 3: Ethiopian Wildlife Sector Revenue 2008/09 .16 Table 4: BMNP Budget 2009/10 .19
Table 5: Financial Summary BMNP .20 Table 6: GNP Budget 2009/10.22
Table 7: Financial Summary GNP.24
Table 8: Budget Allocations for 2009/10.25 Table 9: EWCA and Regional Allocation PA Budgets .26
Table 10: Revenue for EWCA .27 Table 11: Income by Region 2008/09 .27
Table 12: Total Income of the Wildlife Sector by Type 2008/09 .28 Table 13: Total Past Income of the Wildlife Sector .28
Table 14: Donor Funding to the Ethiopian PA System.30 Table 15: Estimated Capital Requirement for Scenario 2 .34
Table 16: Estimated Cost Summary of the three scenarios .35
Table 17: The Hydrological Value of Selected Protected Areas.40
Table 18: Carbon Value of the National PA system.42
Table 19: The National Value of Biodiversity .43
Table 20: Value of Medicinal Plants.44
Table 21: Genetic Resource Value of Ethiopia.44
Table 22: Soil Loss Rates per Land Cover in Ethiopia .45
Table 23: Lost Timber Revenues due to Deforestation.46
Table 24: Economic Loss due to Deforestation in Ethiopia.48 Table 25: BMNP Entry Fees 2008/09.50
Table 26: BMNP Tourist Arrivals in 2008/09 .50 Table 27: BMNP Tourist Fees .51
Table 28: BMNP Employment Benefit .51 Table 29: BMNP Staff Salaries.52
Table 30: Crop Production Value of BMNP.52 Table 31: Livestock Production Value of BMNP .53
Table 32: BMNP Fishing Licence Fees .54
Table 33: Value of Various Wood Products in BMNP .55
Table 34: Timber and NTFP Value of BMNP .55
Table 35: Medicinal Plant Value of BMNP .56 Table 36: Water Provision Value of BMNP .56
Table 37: Electric Power Production Value of BMNP.57
Table 38: Current and Potential Irrigation Land .57 Table 39: Current and Potential Value of Irrigated Crop Production.58
Table 40: Biodiversity Value of BMNP.59 Table 41: Value of Carbon Stock .59
Table 42: Cost of Deforestation in BMNP .60 Table 43: Carbon Stock Estimate based on WBISPP, 2005.60
Table 44: Watershed Regulating Services of BMNP .61 Table 45: Genetic Resource Value of BMNP and Harenna Forest .62
Table 46: Summary of Economic Values for BMNP .64 Table 47: Land Cover of the Gambella Region .66
Table 48: Total Population in Woredas in GNP .67
Table 49: Employment Value of GNP.68 Table 50: Unlicensed Hunting Value of GNP .68
Table 51: Fish Resource Value of GNP.69 Table 52: Land earmarked for Development in GNP .71
Table 53: Potential and Current Commercial Agricultural Production in GNP .71 Table 54: Estimated Livestock Numbers in Gambella Region .72
Table 55: Water Provision Value of GNP .73 Table 56: Medicinal Plant Value of GNP .73
Table 57: Carbon Stock and Value in GNP .74 Table 58: Watershed Regulating Services of GNP .75
Table 59: Biodiversity Value of GNP .75
Table 60: Summary of Economic Values for GNP .77
Table 61: IUCN Suggested Management Framework .80
LIST OF MAPS
Map 1: Wildlife Protected Areas.13
Map 2: Bale Mountains National Park and Bale Eco-Region .49
Map 3: Food Insecurity Status .58
Map 4: Land Cover of the Baro-Akobo River Basin .66
LIST OF FIGURES
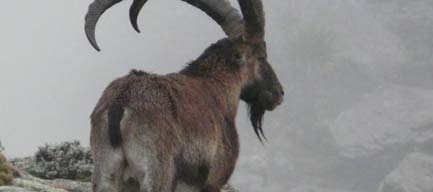
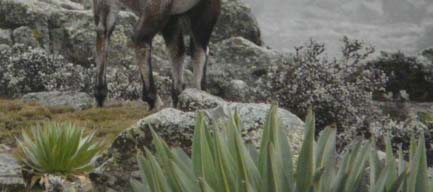
Figure 1: Capra Walie .9 Figure 2: Giant Lobelia.12
Figure 3: Wenchi Lodge .19 Figure 4: National Tourism Statistics.29
Figure 5: Gelada Baboon .39 Figure 6: Fuelwood Collection in Bale Mountains National Park .47
Figure 7: Fisherman in Gambella National Park .67
Figure 8: Bushfires in Gambella National Park .77
EXCHANGE RATE
Throughout this report, all financial figures are reported in Ethiopian Birr or United States Dollars. The current conversion rate to US$ is Ethiopian Birr 12.5 (ETB) to US$1 (exchange rate as of 1st
September 2009).
ABBREVIATIONS
BMNP
Bale Mountains National Park
Benishangul-Gumuz Regional State
Ethiopian Electric Power Corporation
Ethiopian Wildlife Conservation Authority
Ethiopian Wolf Conservation Programme
Global Environment Facility
Gambella National Park
German Technical Cooperation
World Conservation Union
kg Kilogramme MDG Millennium
National Forest Priority Area
NGO Non-governmental
Non-timber Forest Product
Plan for Accelerated and Sustained Development to End Poverty
Payment for Ecosystem Services
popn Population SDPASE
Sustainable Development of the Protected Areas System of Ethiopia Project
Sustainable Development and Poverty Reduction Programme
Mountains National Park
Southern Nations, Nationalities' and Peoples' Regional State
Opportunities and Threats Analysis
Terms of Reference
United Nations Development Programme
Voluntary Emissions Reduction
World Wide Fund for Nature
SECTION 1: EXECUTIVE SUMMARY
The Government of Ethiopia, through its commitment to the Global Environment Facility and
the Convention on Biological Diversity seeks to examine the financial status of the national
protected areas (PA) system and to explore the economic benefits of PAs in qualitative and
quantitative terms.
The purpose of this report is to: Examine through the application of the UNDP Sustainable Finance Scorecard the financial
position of the national protected area system and the underlying factors which
contribute to the result
Provide scenarios which give an estimation of protected area funding needs and the
likely funding gaps
Identify likely sources of funding to meet future requirements as well as to suggest the
institutional changes needed to improve financial management
Provide estimates on the economic benefits that protected areas bring to Ethiopia
The funding needs for the implementation of the national system of protected areas in
Ethiopia are estimated to be between ETB64 and 82 million per annum over the next 5
years. This contrasts with the present budget of ETB16 million per annum, which is
estimated to meet only 20 to 25% of actual needs. The amount of revenue earned in
2008/2009 amounted to ETB13 million, although the contribution to the federal government consisted of only ETB4 million with the remainder going to regional governments. With
transfer of responsibility for the protected areas system to the federal government in 2009/10, all revenue from protected areas managed by EWCA will go to the federal
government. The financial figures derived in this report have been developed with reference to a general
continuation of the present protected areas network. Of particular note is that objectives and strategies have not yet been determined for the role or management of the protected area
system. This is still ongoing. Thus it is not possible to determine the accurate cost for future management or to formulate action plans. This should be a high priority for EWCA now.
Donor funding has played a role in the development and management of the protected areas
and amounts to an average of US$750,000 to 900,000 per annum. This amounts to US$0.2
to 0.24 per hectare. This figure is considered low in comparison with the investment needs of the Ethiopian PA system. Past donor funding has often been allocated to specific projects
and donor-driven priorities and has not necessarily been directed to the development of the protected areas system as a whole in Ethiopia. With the most important protected areas now
under federal control, there is the opportunity to develop a clearly agreed national strategy for conservation areas, which should form the basis for better targeting of donor funds to
national priorities.
The estimated cost of maintaining a basic level of management in EWCA managed protected
areas amounts to ETB 64.4 million. This mainly includes resource protection and showing a general presence in protected areas. With additional investments in basic tourism
infrastructure, the annual costs of managing the protected areas estate amounts to a minimum of ETB 81.5 million. Therefore, the immediate funding gap is estimated between
ETB 48 million to ETB 65 million per annum. Most protected areas are increasingly being
encroached and settled, which accelerates land use change and unsustainable resource use (e.g.: overgrazing and deforestation). The cost of reducing human induced pressure on
protected areas is estimated to be in average about ETB 125,000 per household, residing in national parks. These costs are not included in the funding gap as they need to be calculated
on a case-by-case basis
To address the funding gap it is proposed to explore opportunities to increase revenue by
introducing market based fees and charges. In addition, funding sources have been
identified through the establishment of a trust fund and enhanced donor commitment to
conservation activities. A further key mechanism will be the reduction of costs to Government by engaging in partnerships with NGOs and the private sector for the
management of part of the protected area system. This appears to be well advanced with
several NGO partners having expressed an interest.
The study analyses the economic value of EWCA managed protected areas, based on two
case studies as well as on a national PA system's level. Protected areas provide direct
benefits from tourism and job creation. In 2008/09 EWCA realised about US$ 19,000 from
entrance fees to national parks. Apart from direct benefits from tourism, employment and
entrance fees, the main value of protected areas is found in the environmental services they
provide. They are an integral part of the sustainable development of the Ethiopian economy
and form the basis for the various benefits and their respective values. A number of
environmental services have been valued, such as hydrological services (valued at US$432
million), electric power generation (valued at US$28 million), medicinal plants (valued at
US$13 million), carbon sequestration (valued at US$938 million or US$19 million per
annum) and the value of biodiversity (estimated to be US$ 3.75 to 112 million per annum).
The results clearly show that the economic value of protected areas is of immense benefit to the sustainable development of the Ethiopian economy and plays a significant role in the
fight against poverty. Indirect benefits, such as water provision for domestic consumption
and irrigated agriculture, electricity production, carbon sequestration and the conservation of
biodiversity far exceed the direct benefits derived by local communities in protected areas
and direct user fees (e.g. from tourism). However, the costs of management have to be
shouldered by EWCA, which is not in a position to manage its mandate effectively under
current funding levels. Hence, it is argued that any additional investment into the Ethiopian wildlife protected areas system is an economically sound investment, ensuring the continuous flow of ecosystem
services for sustainable development and poverty reduction. Considering the nature of
protected areas, often as centrepieces of wetland areas and water catchments, effective
management and adequate funding of protected areas is a direct investment into sustained
growth of downstream economies and the national economy at large. In order to achieve a fully functional PA system, the following actions are recommended to be explored: 9 Secure government funding 9 Develop a revenue retention scheme 9 Develop a donor programme strategy 9 Investigate the suitability of a trust fund 9 Reduce barriers to effective PA management 9 Support local communities and foster local employment 9 Explore cost sharing opportunities 9 Develop "green marketing" strategy 9 Explore possibilities for payments for environmental services
SECTION 2: INTRODUCTION
2.1 Study Objective
In July 2009, ÖBf Consulting has been commissioned by the Sustainable Development of the
Protected Areas System of Ethiopia (SDPASE) project to carry out an "Assessment of the
Value of the Protected Area System of Ethiopia".
The purpose of the assignment is to (i) identify costs and benefits (direct and indirect,
visible and hidden) of the PA system, and (ii) compare them and establish a business agenda for EWCA to achieve its mandate.
The study compiles the "business" arguments for the PA system of Ethiopia and the
Ethiopian Wildlife Conservation Authority (EWCA) in particular, which is to be utilized to
solicit for increased Government and partner support and funding. Moreover, the study is to
provide arguments to mainstream the PA system into the pro-poor development agenda of
Ethiopia.
This Report covers the initial work of revealing the current financial situation in relation to
the nationally significant protected areas managed by EWCA and the economic values of the
PAs and the landscape in which they are located. The report does this by examining the cost and revenue position for EWCA and the national protected areas system. The report also
identifies the economic values of the system in qualitative terms and, where possible,
assigns financial values.
2.2 Methodology and Tools Employed
On 20th July 2009, the ÖBf team has started the assignment and conducted a field trip to
Ethiopia, including the Bale Mountains and Gambella National Parks within the months of
August and September 2009. The team consisted of:
1. a protected areas financing specialist (Mr. Lee Thomas),
2. a protected areas management specialist (Mr. Alois Schuschnigg), and 3. a participatory natural resource management specialist (Mr. Zelalem Temesgen
Apart from stakeholder consultation at federal, regional and local level, the team made use
of a number of internationally recognised tools to analyse the financial situation of EWCA as
well as to identify relevant benefits provided by protected areas to various stakeholder
2.2.1 UNDP Financial Sustainability Scorecards
In order to systematically assess the financial situation of protected areas in Ethiopia, the
UNDP Financial Sustainability Scorecard was used. The Scorecard has been developed to
assess not only the financial position but also the underpinning management arrangements such as the accounting system, delegation of financial management and training in the
development of Business Plans to name but just a few of the mechanisms assessed. The UNDP Scorecard is used globally as a financial management information tool. In the case of
this report, it has been applied at the national level and for Bale Mountains National Park
and Gambella National Park to provide an assessment benchmark.
The purpose of this scorecard is to assist governments, donors and NGOs to investigate and
record significant aspects of a PA financing – its accounts and its underlying structural
foundations – to show both its current health and status and to indicate if the system is moving towards an improved financial situation. The Scorecard is designed for national
systems of PAs but can also be used to look at individual sites as has been done here for
Bale Mountain National Park and Gambella National Park. Scorecard assessments were not
made for the regions since the most important PAs are no longer part of the regional
The Scorecard records overall financial status and changes to the cash inflows and outflows
of the PAs. In addition, it is designed to check the progress of the entire PA financing system
and its organizational foundations, which will lead to the future financial viability. Assessing
the underpinning structural and management elements can help a country identify which
areas of its governance structure needs to be improved to enhance its PA financing system.
The questions regarding financial data also provide an opportunity for a country to assess its
capacity to generate and collect cost and revenue data fundamental for PA financial
The Scorecard envisages a system with the following general characteristics:
1. the national government is committed to long term sustainable funding of the PA
system at a level which ensures effective management
2. national legislation is in place which permits efficient management of the PA system
and provides measures for earning and retaining revenue from a range of sources
3. Government funding is determined according to needs identified in Management and
Business Plans for PAs and takes into account any special measures to meet obligations such as the CBD, national Tourism Strategy, etc.
4. institutional and individual capacity is developed to enable the PA system to operate
in a business like manner
5. special attention is paid to cost effectiveness and contracting out park management
functions to local communities and organizations
6. regular independent reviews are performed to determine management effectiveness
and action taken to correct shortcomings
Whilst the Scorecard recognizes the importance of cost-effective management in PA financing, it does not provide specific guidance on the use of funds.
The Scorecard Assessments are found at Annex 1, 2, 3 and the findings are discussed in
Sections 4.2 to 4.4.
The Scorecard can be downloaded at:
2.2.2 WWF Protected Areas Benefits Assessment Tool
The World Wide Fund for Nature (WWF) has developed a tool to assess values and benefits
provided by protected areas. The tool identifies a generic list of the range of possible
benefits, both tangible and intangible, which can serve as a guide when considering the
values provided by protected areas (Dudley and Stolton, 2008). The tool was applied at both
field sites, Bale Mountains and Gambella National Parks with rural communities, living within
the park as well as park staff, NGO staff, local administration and employees of other
relevant government institutions. The application has shown that the tool is very useful to
conduct with park staff, relevant authorities (e.g. local tourism office, forestry enterprise
staff, etc.) and NGO staff. For an application with rural communities, the tool can be used as
a checklist within a group interview or focus group discussion setting.
The tool is available at:
2.2.3 Study Limitations Recent information on Ethiopia's protected areas is scarce and very little is known about the
economic benefits created and provided by biodiversity conservation. A few studies covering
specific aspects have been conducted on various scales of analysis.
For example, there are several studies on the economic value of coffee in terms of
production systems compared to alternative crops as well as the value of the genetic
resource in terms of future breeding programmes, etc. These studies mainly look at the
Ethiopian highlands in the centre and the south west of the country. Other studies investigated the value of medicinal plants and associated industries on a national level or
looked into the cost of deforestation for entire river basins. In some areas such as the Bale
Mountains eco-region, there is a good research and literature base on various topics.
However, the scale of analysis differs from study to study, varying from cropping/farming
system, village/settlement, vegetation class, protected area, catchment/river basin to a
regional or national scale.
Theoretically, every valuation can be made at any scale, but practically it is not useful to
estimate, for example, the cost of deforestation for a particular forest or benefit of an ecosystem service and then aggregate this to national level. This is due to several problems
in terms of possible price effects and variations between areas, frequently using different
assumptions, discount rates and time scales.
SECTION 3: BACKGROUND
Protected areas are defined by the World Conservation Union (IUCN) as:
‘An area of land and/or sea especially dedicated to the protection and maintenance of biological diversity, and of natural and associated cultural resources, and managed through
legal or other effective means.' In recent years, there have been a number of positive developments in Ethiopia indicative of
a generally supportive attitude of the Government to the wildlife sector and natural heritage areas. This becomes evident by the approval of national policies and preparation and
passing of the legislation establishing the Ethiopian Wildlife and Conservation Authority (EWCA). New public-private sector partnerships are being founded to manage protected
areas and stronger institutional linkages are being built between the PA system, donors and production sectors (e.g. watershed conservation and tourism), which have the potential to
allow for a greater level of devolution of PA management. Finally and most importantly,
protected areas are acknowledged in the Plan for Accelerated and Sustained Development to
End Poverty (PASDEP), placing protected areas on the national development agenda.
However, the PASDEP does not focus on sustainable natural resource management as a means to reduce poverty.
The PASDEP outlines Ethiopia's pro-poor development agenda and provides the basis for
mainstreaming Ethiopia's PA system into the broader development context. However, it has
a strong focus on direct income from tourism, not fully acknowledging the value of the PA
system in terms of providing environmental services to the national economy and hence
contributing to the fight against poverty. Therefore, it is necessary to add the linkages
between an effective PA system and poverty reduction by estimating the value of other
environmental services, provided by a representative PA system, as the basis for effective biodiversity conservation. The current plan focuses on natural resource conservation and
management and in particular on:
1. Watershed development and natural resource management
2. Soil and water conservation
3. Forest Resource Management
4. Water management for irrigation
5. Sustainable land use management
6. Wildlife protection, development and utilization
7. Biodiversity conservation and sustainable utilization
3.1 Policy and Legal Framework
The Ethiopian constitution and government recognises the importance of the environment in
the overall development and well-being of the Ethiopian people. Efforts are being
undertaken to make-up the framework for the sustainable development and protection of
the environment. Cognizant to this fact the issuance of the environmental policy and conservation strategy of Ethiopia is serving as umbrella policy and strategy for the
conservation and sustainable development of the environment. Guided by the national policies and strategies, the government has signed a number of articles and conventions
such as Convention to Combat Desertification, Convention on Climate Change or the Kyoto protocol, Convention on Biodiversity, Convention on Migratory Species, and the Convention
on International Trade in Endangered Species of Wild Fauna and Flora (CITES), which all
commit the country to put in place a comprehensive and integrated management of the
protected areas system. Although national policies and strategies are drawing the
frameworks for proper management of the environment, specific policies and strategies are
yet to be developed to address particular areas of sustainable development of protected
areas. There are a number of policies, strategies and proclamations, which provide for the
conservation, development and utilization of wildlife. The major relevant policy and
strategies include umbrella policies and proclamations such as:
A Proclamation to pronounce the coming into effect of the Constitution of the Federal
Democratic Republic of Ethiopia, Proclamation No. 1/1995
Conservation Strategy of Ethiopia, 1997 Environmental Policy of Ethiopia, 1997 National Biodiversity Conservation and Research Policy, 1998 Rural Development Policies and Strategies, 2002 National Biodiversity Strategy and Action Plan, 2005 Wild Life Protection, Development and Utilization Policy and Strategy 2005 A Plan for Accelerated and Sustained Development to End Poverty (PASDEP), 2006
Those specifically relevant to the wildlife development, conservation and utilization are:
Proclamation for Government Council Ratification of the International Treaty of
Endangered Wild Life and Plants Trade, Proclamation No.14/1989
A Proclamation to amend the Institute of Biodiversity Conservation and Research
Establishment Proclamation, No. 167/1999
A Proclamation to Provide Environmental Impact Assessment, Proclamation No 299/2002 A Proclamation to amend the Reorganization of the Executive Organs of the Federal
Democratic Republic of Ethiopia, Proclamation No. 380/2004
A Proclamation to amend the Institute of Biodiversity Conservation and Research
Establishment, Proclamation No 381/2004
Federal Democratic Republic of Ethiopia Rural Land Administration and Land Use
Proclamation, Proclamation No. 456/2005
Proclamation for Genetic Resource and Public Rights, Proclamation No.482/2005 A Proclamation to provide for the Development, Conservation and Utilization of Wildlife,
Proclamation No.541/2007.
A proclamation to provide for the Development, Conservation and Utilization of Forests,
proclamation No.542/2007
A Proclamation to Provide for the Establishment of the Ethiopian Wildlife Development
and Conservation Authority, Proclamation No. 575/2008.
A Regulation to provide Wildlife Development, Conservation and Utilization, Regulations
The Awash National Park Establishment Order No. 54/1969; The Simien National Park Establishment Order No. 59/1970
Although arrays of policy, strategy and proclamations exist, there are still some areas that
need explicit legal provisions regarding the modalities of public-private partnerships. Particularly co-management governance systems, national categorisation of protected areas,
financing mechanisms, resettlement issues for community members who settled within protected areas in the recent past, are issues to be addressed in order to effectively manage
protected areas of Ethiopia.
3.2 The SDPASE Project
The Sustainable Development of the Protected Areas System of Ethiopia (SDPASE) project
serves to build on the core strategic support of Government by strengthening the protected
area system of Ethiopia and enhancing its sustainability. The objective is to focus on sites
established to conserve biodiversity and move protected area management effectiveness
from the low to the effectively managed end of the spectrum. This will be achieved by:
Providing an enabling environment for effectively managed protected areas (through
mainstreaming protected areas in the development context in Ethiopia, policy
amendment and development that provide for management partnerships, and the
production of effective regulations)
Strengthening institutional capacity to plan, market, manage, regulate, monitor and
evaluate protected areas through cost-effective means
Securing sustainable financing for the protected area system.
The project has been designed to overcome barriers of effective PA management. A suite of
interventions will be spearheaded over a period of eight-years, divided into two stages. The
first stage will focus on the national system in terms of capacity building/ training and
integrating the protected area system into mainstream development. Associated investments in the tourism sector and critical watershed management offer entry points for
such integration. On-ground protected area management models will be piloted at two – three major
protected area landscapes with funding from co-financiers, and will feed into national
capacity building processes supported with GEF funds. The identified sites are within Bale
Mountain National Park and Guassa-Menz. The second stage of project interventions, beginning in year 5, will consolidate the capacity gains, implement the PA business plan, and spearhead the countrywide replication of sound
PA management practices and lessons.
3.3 Ethiopia's Protected Areas System
The biogeography of Ethiopia is characterized by two dominant geographical features,
namely the highlands and the lowlands. The Ogaden, in east Ethiopia is one of the three
centres of endemism of the ancient arid Horn of Africa. The highland plateaus present the second bio-geographical feature. Although relatively young in evolutionary terms and
besides the fact that they have experienced relative climatic instability over the past 1.5
million years (both in contrast to the arid Horn), highland isolation has resulted in high endemism. Whilst the arid Horn and young highlands are relatively impoverished in species
number (compared to other continents), the levels of endemism are high. Ethiopia has over 6,000 species of vascular plants (with 625 endemic species and 669 near-endemic species,
and one endemic plant genus), 860 avian species (16 endemic species and two endemic genera), and 279 mammal species (35 endemic species and six endemic genera).
Figure 1: Capra Walie The Walia Ibex, is found exclusively in the mountains of northern Ethiopia. Nearly all of the remaining population resides along 25 kilometres of the northern escarpment in
the Simien Mountains National Park
Ethiopia still harbours populations of elephants, lions and even black rhinoceros. In addition, there are a number of charismatic endemic flagship species, most notably the Gelada (an
endemic genus and the world's only grazing primate), the Mountain Nyala, the Ethiopian Wolf, the Walia Ibex and the Giant Lobelia. The majority of the country falls into one of the
two Biodiversity Hotspots. Within Ethiopia, 97.3% and 95% of the natural vegetation in the
Ethiopian Highlands and Horn of Africa, respectively, is estimated to have been lost or
transformed by human activities.
The principal mechanism used by Ethiopia to protect biodiversity, ecosystems and ecological
processes has been through a network of wildlife conservation areas and priority forest areas. The sum of the area of the wildlife conservation and forest areas – a total of 14% of
the area of the country – is above the global average for protected area coverage. These
areas contain sites set aside mainly for conservation (no take areas), and others for
sustainable use of wild resources (timber, hunting).
The Ethiopian PA System contains several categories, including National Parks, Wildlife Reserves and Sanctuaries, which were primarily designed for the protection of wildlife
resources, and Controlled Hunting Areas and Forest Priority Areas, for the utilization of wildlife and timber resources. The overall management effectiveness of most PAs is low, as
many areas are not legally gazetted, receiving inadequate funding, are understaffed and ill-
equipped, hence providing low levels of biodiversity conservation (GEF, 2008).
The recently created Ethiopian Wildlife Conservation Authority (EWCA) manages 13 National
Parks and Wildlife Sanctuaries (compare with Table 1 and Map 1) and regulates and
administers quota setting and licensing in Controlled Hunting Areas. Table 2 lists other protected areas, including a number of National Parks, Wildlife Reserves and Controlled
Hunting Areas managed by various regional authorities in the various regions of the
Table 1: Protected Areas managed and regulated by EWCA
NATIONAL PARK OR WILDLIFE
AREA [HA]
SANCTUARY
Abijatta-Shalla Lakes
Babile Elephant Sanctuary
Senkelle Hartebeest Sanctuary
Simien Mountains
Table 2: Protected Area managed by Regional Authorities
PROTECTED AREA
PROTECTED AREA
AREA [HA]
CATEGORY
Chebera Churchura
Wildlife Reserve
Wildlife Reserve
Wildlife Reserve
Wildlife Reserve
Wildlife Reserve
Wildlife Reserve
Wildlife Reserve
Wildlife Sanctuary
Controlled Hunting Area
Controlled Hunting Area
Controlled Hunting Area
Agarfa Adaba–(Dinsho)
Controlled Hunting Area
Controlled Hunting Area
Controlled Hunting Area
Besmena-Oddu Bulu
Controlled Hunting Area
Controlled Hunting Area
Controlled Hunting Area
Dabus Valley (Dati)
Controlled Hunting Area
Controlled Hunting Area
Eastern Hararghe
Controlled Hunting Area
Controlled Hunting Area
Controlled Hunting Area
Controlled Hunting Area
Controlled Hunting Area
Controlled Hunting Area
Controlled Hunting Area
Controlled Hunting Area
Controlled Hunting Area
Controlled Hunting Area
Controlled Hunting Area
Controlled Hunting Area
Controlled Hunting Area
The principal threats to biodiversity of Ethiopia stem from i) de facto open access of resources leading to degradation of habitats, ii) conversion of land to agriculture, iii)
overgrazing by large livestock population, weak institutional and financial capacity to
manage protected areas, and iv) invasive species. The protected area system plays an
important role in counteracting these threats by providing refuge for fauna and flora and by
protecting critical ecological processes. The nominal protected area system (including forest priority areas, national parks, wildlife reserves and sanctuaries and controlled hunting areas)
covers 14% of the country. However, this is not entirely representative of the ecosystems within the country and many areas are not correctly sited or too small to maintain ecological
processes. Further, some of the nominal areas no longer have any functional meaning, as the biodiversity they were established to protect is long gone.
Figure 2: Giant Lobelia The higher plants of the Ethiopian mountains are still being catalogued. There may be
between 100-150 high altitude endemics. The most conspicuous is the giant lobelia
(Lobelia rhyncopetalum) whose sentinel is characteristic in the Afroalpine landscape.
Map 1: Wildlife Protected Areas
SECTION 4: UNDP FINANCIAL SUSTAINABILITY
SCORECARDS
4.1 Overview of Sustainable Financing of Protected Areas
Protected area financing is critical for sound PA management. However, globally, protected
area financing is in need of being increased, at both site and system level, in order to
achieve conservation objectives. Hence, developing long-term financing systems and
achieving the requisite level of funding is a key element for protected areas sustainability.
Protected area "financial sustainability" refers to the ability of a country to meet all costs
associated with the management of a protected area system. This implies not only
generating sufficient revenue, but just as importantly, meeting the challenge of managing
PA expenditures. PA financial sustainability must be addressed from both sides of the
financial equation. As found in the assessment made, Ethiopia and the PA implementing
agency EWCA are at an early stage of addressing PA financial sustainability. The budgets are
generally meeting only 20 to 30% of estimated costs.
Sustainable financing for PAs is dynamic in nature and moves to address the flow of funds
with time. Thus, the timing of funds can be as critical as the actual amount received. For this
reason, funding levels and their timing must be subject to continuous review in order to
maintain working levels of cash. Again, Ethiopia and EWCA are at an early stage of
development with respect to developing a systematic process for matching the flow of funds
with management requirements and this is obvious in the Scorecard assessment. It is this systematic process of defining costs and identifying ways to meet those costs that
constitutes good financial planning. Financial planning enables PA managers to make
strategic financial decisions such as re-allocating spending to match management priorities,
and identifying appropriate cost reductions and potential cash flow problems.
In addition to cost and revenue concerns, sound institutional arrangements need to be in place to support the achievement of PA financial sustainability. Responsibility for PA
management and financing are often shared across various institutions and roles need to be clarified and harmonized for effective financial planning and budgeting. Furthermore, within
these managing institutions, efficient and transparent mechanisms for collecting and
managing PA-related fees need to be in place. While the mechanisms for recording
expenditure and revenue earned are in place within the EWCA, the roles of individuals within
the organisation responsible for management are not well defined nor matched with adequate financial delegations.
Broadly speaking, PA financing mechanisms can be considered to lie on a spectrum from
those which are based on inflows to PAs from external sources (for example from NGO, government and donor budgets) to those which are based on revenues generated from
within the PA itself (for example resource use fees or payments for environmental services).
In general, the provision of externally-generated funds is motivated by broader social or personal policies, goals or principles which place a value on the conservation of PAs — for
example for their publicly valuable attributes, intrinsic values, conservation significance, or as items of cultural or natural heritage. Historically the level of PA funding in Ethiopia has
been low and is indicative of the low priority afforded to PAs in the context of the entire government budget. In contrast, self-generated PA revenues tend to be based on charges or
markets which are linked to the use or provision of particular PA products and services (for example tourism, resource extraction, hunting, carbon offsets or environmental services) or
to engagement in conservation activities (such as alternative livelihoods or sustainable
enterprises or businesses). In Ethiopia, self-generated revenue is an important aspect of PA
and wildlife management. Fees and charges for a comprehensive list of activities form the
basis of revenue collection. International donors also play an important role in funding
project activity.
Between these extremes, there is a wide variety of PA financing mechanisms, which combine
aspects of private and public, external and self-generated funding. Cost-sharing and benefit-
sharing, investment and enterprise funds, fiscal instruments and arrangements for private or
community management of PA land, resources and facilities are primarily mechanisms for
generating funding to encourage conservation activities among the groups who use or
impact on PAs. For Ethiopia, the formation and implementation of a Trust Fund could be an
important element to attract donor funding and contributions from the private and NGO
sectors. Fiscal instruments such as entry visa fees and debt for nature swaps however seem
to be presently of lesser importance given the relatively low priority placed on PAs in
comparison to meeting other more pressing objectives.
4.2 National Scorecard for EWCA
EWCA assumed responsibility for the nationally significant PA system of Ethiopia in 2008 and
the budget for 2009/10 represents the first full year of management. The expenditure on PAs for previous years has been a regional government responsibility. The regional
governments have also collected the revenues earned from entry fees and other charges.
Since this is the first year of EWCA revenue collection and the fees and charges have been
amended by the government, it has not been possible to accurately estimate the level of
revenue likely to be earned in the first year under the new regime. The figures for the previous year are therefore to be used only as a guide.
At the national level, an overall score of 43% was recorded. The score is typical of that
achieved by PA Agencies, which are centrally managed and lack mechanisms for decentralised management responsibility and the application of economic valuation studies
and business planning techniques. The Scorecard is intended as a reporting mechanism
rather that a rating system. The national scorecard presented in Annex 1, identifies the following issues.
4.2.1 Financial Analysis
Funding provided to the national parks system as a whole is considered extremely low
considering the tasks at hand. With a national budget of ETB16.1 million per annum, it is
estimated within EWCA that an increase by a factor of 4 is required to ensure that basic
management functions can be properly fulfilled. This fact is based on senior management assessment and is examined more closely later in the report. The level of funding to bring
the current PA system to a fully sustainable level is yet to be determined, since in addition to
enhanced management functions, the task involves the reduction of grazing pressures. This figure depends on the conclusion of management plans for each PA, which is currently being
undertaken by EWCA. A number of revenue sources including hunting revenue, license revenue, royalties on
wildlife product exports and other fees and penalties bring an annual stream of income to
EWCA. In 2008/09, EWCA income was some ETB3.9m. In addition, regional income of some
ETB9.0 million per annum was earned, out of which Oromia and SNNPRS have earned 36%
and 21%, respectively. However, the income in accordance with government policy is
remitted to the government treasuries and is not retained by EWCA, whereas at regional levels income is retained, to be reinvested in PA management and community support
Table 3 presents a summary of the income earned based on wildlife and PA related charges
Table 3: Ethiopian Wildlife Sector Revenue 2008/09
Oromia 4,637,575
SNNPRS 2,671,339
Amhara 1,436,696
TOTAL 12,955,482
4.2.2 Management Framework
Component 1 Legal, Regulatory and Institutional Framework
The legal, regulatory and institutional framework is reasonably well defined with existing
laws, regulations and policies in place to exercise management consistent with centralized
control. However, the framework does little to enable local level delegation or addressing
social issues related to PAs and park management. Nor does it facilitate funding assistance
to local communities or economic valuation studies and the integration of these studies into
the development of budget priorities. The results also show that there are little or no
arrangements in place for PA management to reduce the cost burden to government through delegated management. However, the framework does provide for the management
of PAs to be managed and/or funded by the private sector or local communities where
appropriate. This could significantly reduce PA management costs for Government, whilst at
the same time increase general expenditure levels in the PA system and thereby raise
overall management effectiveness.
Component 2 Business Planning and Tools for Cost Effective Management
PA site level planning is performed at only a very basic level with both management
planning and business planning at a low stage of development. Accounting and audit
systems are in place however, which track expenditure and revenue flows and facilitate
reporting to the national financing strategy. Only very basic training is provided to PA staff
in order to facilitate budget development and the upkeep of accounting records. This is
noted as particular shortcoming in EWCA's management arrangements, which needs to be
Component 3 Tools for Revenue Generation
A number of mechanisms exist for revenue generation across the national level and these
will continue in accordance with the schedule of fees introduced by the Ethiopian
Government in February 2009. It should be noted that under the Wildlife legislation a
proportion of revenue earned is returned to local communities. For example, 85% of hunting
revenue from controlled hunting areas is returned to regions and local communities where
the trophy hunting took place.
It is noted however that EWCA policies for business concessions, retaining revenues for
reinvestment and payment for environmental services have yet to be developed. These
represent a significant potential loss of opportunity and are addressed later in this report.
4.3 Scorecard for Bale Mountains National Park
With an overall score of 12% for the Scorecard, which is provided at Annex 2 the following
issues are noted. The score particularly reflects the low level of institutional capacity at Bale
Mountain National Park as reflected in both its management and financial systems.
4.4.1 Financial Analysis
Funding provided to Bale is considered extremely low considering the task to be undertaken.
It was estimated by the park manager's representative that an increase from ETB856,516
per annum by a factor of 3.7 is required to ensure that basic management functions can be
properly fulfilled. This is examined more closely later in the report. The optimal level of
funding was assessed as being an increase by a factor of 5. However, this did not take into
account the cost of reducing human induced pressure, such as overgrazing in the PA.
BMNP generates revenue from various sources, including hunting, tourism and lodge
revenue, bringing a stream of income into Bale annually. In 2008/09 income amounted to
ETB250,000 or US$0.2 million. Again, the income, in accordance with the regional
government policy, was remitted to a regional pool of forest revenue and about the same
amount was re-invested in the park management in the form of salary and recurrent
budget. There was no budget, either from government capital expenditure or internal
revenue allocated for the development of park infrastructure.
4.3.2 Management Framework
Component 1 Legal, Regulatory and Institutional Framework
The legal, regulatory and institutional framework, while under regional administration, was
poorly defined with few workable laws, regulations and policies in place to exercise
consistent management. At site level, the same characteristics as noted for the national
level applied. Frankfurt Zoological Society (FZS) and the Ethiopian Wolf Conservation
Programme placed efforts in the National Park to play a role in specific components of park
and wildlife management. However, these efforts, to assist in species protection
programmes and certain management functions, although useful, were not focused on the
most critical aspects of park management relating to livestock grazing pressures and
resource exploitation. Simply put, the NGOs did not have the means to systematically address and correct the problems and as such, they were of less strategic use. Better
coordination between the federal and regional levels, as well as with donor programmes has
the potential to identify the most important management needs and use available resources
Component 2 Business Planning and Tools for Cost Effective Management
Protected area site level planning is performed at only a very basic level. Although a general
management plan for BMNP had been prepared and approved by regional government, it
had not been implemented due to a lack of resources and advent of institutional change.
Since the park will be taken over by EWCA, federal policies apply but are yet to be
incorporated into its provisions. Only very basic training is provided to PA staff to facilitate
budget development and the upkeep of accounting records. This fact must be considered as a particular shortcoming in EWCA's management arrangements. In Bale Mountains National
Park a business planning process has been initiated by the Frankfurt Zoological Society which is due to be finalised.
Component 3 Tools for Revenue Generation
Mechanisms exist for revenue generation across the national level and these will continue to
be applied in accordance with the schedule of fees introduced by the Ethiopian Government in February 2009.
It is noted however that policies for business concessions, community involvement, benefits
and responsibility sharing, and payment for environmental services have yet to be
developed. These represent a significant potential loss of opportunity and are addressed later in this report.
Figure 3: Wenchi Lodge In terms of tourism, Ethiopia is mainly known for its cultural heritage, imperial
palaces and monasteries. However, eco-tourism is also a major income source
to EWCA , which can be expanded.
4.3.3 Financial and Management Aspects
The 2009/10 budget for BMNP is presented in Table 4.
Table 4: BMNP Budget 2009/10
Salaries based on current establishment
Future Budget Needs
Based on the Scorecard results and estimates provided by park staff, the current budget
needs require an expansion by 3.7 to cover basic management requirements, resulting in a
budget of ETB3.2 million per annum.
In order to provide the necessary park management and initial tourism infrastructure an
additional investment load of ETB6.95 million per site is considered as necessary. The main provisions to be made include visitor centres and fit out, park entry buildings, vehicles,
workshops and laboratories, equipment necessary for removal of invasive weeds, landscaping and walking trails, signage, radio equipment, staff housing, electricity, and
construction of outstations. As mentioned previously the training needs of park staff will be assessed as part of the
SDPASE project and are not separately costed in this report.
For the purposes of this report, it is assumed that the scorecard result of the optimal level of
expenditure of 5 times the current provisions would be satisfied by this additional provision
for infrastructure. On an annualized basis over 5 years, this becomes ETB1.38m for budgeting purposes.
Management Provisions
While there are plans by EWCA to expand the number of scouts performing patrol duties, it
is suggested that the number of appointments be approached carefully.
Rather it seems that enhanced operational strategies to guard wildlife and natural resources
are in need of development to make better use of staff numbers. For example, construction
and staffing of outstations would deploy guards to those areas in need of protection. It
would also place staff in locations where community contact is important and could lead to
better liaison with park users. Other options include improved communications by radio or
To the extent that savings on guards represents an overall budget saving, this money could
be applied to the employment of expert staff or additional park services and infrastructure.
Table 5: Financial Summary BMNP
Expenditure Revenue
Estimated Gap
An independent assessment of PA financial needs in accordance with the management plan
for BMNP, being conducted by the FZS, indicated that US$500,000 per annum were needed
to meet the equivalent of Scenario 1 and 2 costs in addition to expenses associated with community outreach. This amounts to ETB6.25 million per annum and is consistent with the
figures derived in this Report if the extra costs of possible community programmes are included.
4.4 Scorecard for Gambella National Park
Gambella achieved an overall score of 6%. The almost total lack of institutional capacity and
absence of staff training contributed to the result. The scorecard is provided in Annex 3.
4.4.1 Financial Analysis
Since Gambella under regional administration had no actual expenditure information
available for previous years, it could not be shown in the scorecard. The 2009/10 budget
allocation for Gambella however is available and has been shown. An estimate is made of
salaries for the 17 staff on location. Since this is the first year of EWCA revenue collection
and the government has amended the fees and charges schedule, it has not been possible to
accurately estimate the level of revenue likely to be earned in the first year under the new
regime. No revenue was collected in 08/09.
Funding provided to Gambella is considered extremely low in terms of the area involved and
the complexity of the task to be undertaken. It was estimated by the park manager that a
budget of ETB3m per annum (from a base of ETB0.7 million per annum) is required to
ensure that basic management functions can be properly undertaken. This is based on his
assessment of funding required to conduct recurrent management functions on a best
practice basis and to implement a number of new programmes considered essential but not
currently performed. This is examined more closely later in the report. Based on the park
managers assessment and comparisons with BMNP the optimal level of funding was
estimated as being an increase by a factor of 5 which provided for infrastructure needs as
well as enhancements to the recurrent functions. Even so, this estimate did not take into
account the additional funding needed to achieve a reduction of grazing pressures in the
PAs, which in keeping with the other scorecard reports is beyond the scope of this
4.4.2 Management Framework
Component 1 Legal, Regulatory and Institutional Framework
The legal, regulatory and institutional framework was found to be poorly defined with very
few management functions actually taking place. Considering that the park office is in the
regional capital with lack of transport facility, this is not surprising. The lack of a workable
policy framework did little to enable local level delegation and involvement. The results also
show that there are little or no arrangements in place for PA management to reduce the cost
burden to government by more closely matching staffing levels to the actual functions
Component 2 Business Planning and Tools for Cost Effective Management
PA site level planning is performed at only a very basic level. There is no management plan
and federal policies are yet to be incorporated into on the ground actions. Similarly, business
planning was absent. Very basic training only is provided to PA staff to facilitate budget
development and the upkeep of accounting records. This is noted as a particular
shortcoming in EWCA's management arrangements of the site.
Component 3 Tools for Revenue Generation
Mechanisms exist for revenue generation across the national level and these will continue to
be applied in accordance with the schedule of fees introduced by the Ethiopian Government
in February 2009. At the moment, however they are not applied at Gambella due to
limitations on physical collection mechanisms, as well as the general absence of tourist
Policies for business concessions, the infrastructure needed to invest in park improvements
and facilities to collect revenue and payment for environmental services have yet to be
developed. These represent a significant potential loss of opportunity and are addressed
later in this report.
4.4.3 Financial and Management Aspects
The 2009/10 budget for Gambella is presented in Table 6.
Table 6: GNP Budget 2009/10
Salaries based on current establishment
Future Budget Needs
Based on the Scorecard results the current budget needs require an expansion to ETB3
million per annum. This equates to a factor of 4.3, based on the 2009/10 budget figure.
In addition, investment needs, averaging ETB6.95 million per site have been determined as
required to provide the necessary park management and initial tourism infrastructure. While GNP represents a completely different situation to BMNP, there will be some similarity with
respect to infrastructure needs, if only to provide for staff increases and adequate working
facilities. In practice, since much of the site is seasonally flooded, there will be a different
emphasis in what is provided when compared to the more frequently visited parks. Taking
into account the, currently, low tourist numbers visiting the site it could be argued that
investment needs for tourism over the next 5 years are minimal. However, even on this
basis there will be a need to provide for transport, park signage, patrol-, safety- and radio
equipment, staff housing, minor plant equipment, workshops and storage facilities.
For the purposes of this report it is assumed that the scorecard result for the optimal level of expenditure would be the basic level of ETB3 million together with the additional provision
for infrastructure. Infrastructural development costs amount to ETB1.4 million per annum over a period of five years.
As mentioned previously the training needs of park staff will be assessed as part of the
overall SDPASE project and are not separately costed in this report.
The cost of relocating local communities within the park is not as much of an issue compared
to BMNP. The park, being a wetland is not a suitable place in many areas for communities to live. Nonetheless, there are areas of existing development, as with BMNP, however the costs
of household relocation are indeterminate.
Management Provisions
While there are plans by EWCA to expand the number of scouts performing patrol duties, it
is suggested that the number of appointments be closely considered. For example in GNP,
there are no scouts located in the core areas of the park, which are some 80km from the
Park office in the Gambella town. A sound case exists for developing an outstation in the
park manned by scouts to facilitate their conservation role. To help fulfil this role, there will
be a need for housing and staff facilities to be provided and this is assumed to be within the
expanded optimal level of funding.
Revenue at Gambella NP was zero in 2008/09. While progress towards the collection of
revenue at Gambella is expected to be made over the next five years, progress is only likely
to be limited and revenue has not been taken into account in the calculations below
(compare to Table 7).
Table 7: Financial Summary GNP
Expenditure Revenue Estimate
Estimated
SECTION 5: EWCA FINANCIAL ANALYSIS
EWCA is in the first full year of implementing its mandate to the national PA system. As such
the 2009/10 budget and expenditure figures in Table 8 are the first to be compiled. Previously, the PA system was largely funded and managed on a Regional Government
basis. Table 8 provides the costs for the current year based on the budget appropriations
and subsequent EWCA allocations. No further budget allocation figures were available for
5.1 EWCA Budget
The Budget determined by Government and allocated to EWCA in 2009/10 is presented in
Table 8: Budget Allocations for 2009/10
RECURRENT
ELECTRICITY
25,593 5,924,639
salaries in the Central Office and
Protected Areas
435,081 1,445,338
Simien Mountains
Bale Mountains NP
793,383 1,178,706
1,151,685 2,073,508
153,558 1,037,479
2,559,300 16,081,800
Salaries 3,214,612
Operations 12,867,188 80% Total 16,081,800
The allocation of the Budget for 2009/10 in comparison to the previous years expenditures is
presented in Table9.
Table 9: EWCA and Regional Allocation PA Budgets
2008/09 EXPENDITURE
2009/10 BUDGET
[ETB million]
[ETB million]
EWCA Salary and running
EWCA Managed Parks
Regional Expenditure
Regional Total
EWCA and Regional Parks
excluding salary
The financial figures in Table 8 have been researched and provided by the Financial Director
of EWCA and the figures in Table 9 were gathered from regional authorities. In this transition period between regional and federal responsibility, accounting treatments are
known to vary and as a result a comparison between 2008/09 expenditures and the 2009/10 budget should be considered as indicative only.
In relation to the 09/10 Budget it is noticed that the overall budget allocation is some
ETB2.8 million above the recorded expenditure for the previous year. The overall budget
allocation for regional Park administration increased by some ETB0.6 million although the allocated budget for Amhara and SNNPRS is below the recorded expenditure for the previous
year. Advice provided to the consultants indicates that since this was the first year of full budgeting for EWCA and the PA system as a whole, a cautious approach was adopted by the
Ministry of Finance and Economic Development. However, an understanding existed at the time of finalizing the budget that, should the amount allocated be found to fall short of
actual expenditures, the option of seeking additional funding was available to EWCA. At the
time of this report, supplementary funding had not been sought. The adequacy of the budget is not considered at this point of the report but is referred to in Section 6.
5.2 EWCA Income
The following tables (Table 10 to Table 13) present revenue figures of the past four years.
The revenue or income streams indicated above come from a variety of sources including tourism, hunting, concession fees and royalties. The main revenue generated by EWCA
derives form civet musk export licenses (66%) and trophy hunting (18%).
Table 10: Revenue for EWCA
EWCA [ETB]
Research 146,942
Musk export Income
Total 3,882,214
*Hunting revenue retained by EWCA after distributions to local communities
As an indication of the income earned in the whole wildlife and PA related sector, revenue
figures are provided in Table 11. It is noted that Oromia derives the highest income of all
regions at that three regions do not generate any income from wildlife and/or protected
Table 11: Income by Region 2008/09
REGIONAL INCOME [ETB]
Oromia 4,637,575
SNNPRS 2,671,339
Amhara 1,436,696
Total 12,955,482
In Table 12 it can be seen that the Ethiopian wildlife sector income is mainly derived from
trophy hunting (36.1%), followed by tourism (30%). Licenses for civet musk exports
(19.8%) and other concession fees (10.3%) also provide a considerable income.
Table 12: Total Income of the Wildlife Sector by Type 2008/09
Source of Income
2001 (2008/09) [ETB]
Hunting 4,685,683
Tourism 3,987,430
Concessions 1,338,019
Research Permits
Licensing 101,220
Total 12,955,480
The trends in revenue show a gradual increase over the past years, however EWCA's income has declined over the past three years. However, as these figures represent income earned
collectively by EWCA and the regional administrations it is not clear what the future trends will be. For the purposes of this report is has been assumed that 2008/09 levels of revenue
will be maintained.
Table 13: Total Past Income of the Wildlife Sector
(2005/06)
(2006/07)
(2007/08)
(2008/09)
4,569,168 3,882,214
Oromia 2,836,753
3,277,792 4,637,575
SNNPRS 1,630,506
1,488,683 2,671,339
956,071 1,436,696
Total 8,838,826
10,880,548
10,629,590 12,955,482
Each of the revenue sources is considered further below.
The level of revenue from tourism charges in PAs represents a significant proportion of over-
all revenue from the system, amounting to 30%.
However, it is noted that fees are set on a national basis and do not vary in accordance with
the level of attraction and experience gained by the visitor. This results in certain visitors
paying less than they would be prepared to at Bale and perhaps more than they would
expect to have to pay at less developed sites such as at Gambella.
For example at BMNP the tourist composition consists of 1,680 international, 313 residents
and 110 national visitors. The revenue from entry fees in 2008/09 on this basis was ETB176,980. Based on a willingness to pay survey conducted by park staff of US$17 per
international visitor for entry to Bale, compared to the current charge of ETB90 or US$7. The potential to increase tourism income by applying market rates is approximately 2.5 fold.
With the application of market rates and potential tourism expansion arising from access
improvements, increased revenues at Bale could be expected. A similar case can be made
for other parks with an existing base of tourism.
A summary of international arrivals and the number of "vacationers" visiting Ethiopia
between 1991 and 2008 is provided in Figure 4. It is estimated that vacationers, those who
are potential PA visitors, represent only 25% of the total arrivals.
International Tourists
Figure 4: National Tourism Statistics
(Source Ministry of Culture and Tourism, 2008)
Hunting
Hunting has been the most important revenue earner in the wildlife sector (see Table
12Table 10). For EWCA, hunting is also a main income source although the majority of hunting revenue accrues to the regions (85%). The revenue generated from hunting will
continue to be the same for EWCA under the new legislation as parity of revenue sharing arrangements will continue unchanged in 2009/10. Trophy hunters are willing to pay high
fees (up to US$14,000) for hunting the Mountain Nyala and this source of revenue will
continue to accrue. EWCA and Regional authorities should combine their efforts to design
how this revenue is best reinvested in PA management, as hunting quotas can be expected
to increase once more effective management is put in place. Although trophy hunting is
important, the overall revenue level is still very low and strategies need to be designed on
how to use this revenue for the sector. This strategy will be part of the overall strategy of using revenue efficiently for the sector development.
Royalties
Income from musk export royalties from civets represents a significant source of income of
about 66%. The export of musk is facing some challenges from animal rights activists and
the production system is very traditional, not meeting the requirements of acceptable animal
welfare standards. There is a risk that unless EWCA develops a programme to address the
concerns related to musk production, it may in the long term be difficult to sustain this
Donor Income and Projects
Not listed in the above revenue tables but nonetheless representing a significant amount of
support is the financial support from donors, which is presented in Table 14. The total
funding amounts to about US$13.7 million over a four to five year period, amounting to an
average of US$750,000 to US$900,000 per annum. However, as is ever the case with donor
funding it is not generally sustainable funding per se, as projects eventually come to an end.
It is nonetheless extremely useful to bridge an immediate gap.
Table 14: Donor Funding to the Ethiopian PA System
AREA PROJECT
AMOUNT OF
DURATION
Development of Senkelle
US$169,400 WildCODE
US$54,250 WildCODE
Oromia and Afar October 2009
the Endangered Gravy's Zebra
In Ethiopia Development of Babile Elephant
US$119,294 Wild Life for
(€85,210) Sustainable
Ecosystem development for
Babile Elephant Sanctuary and
locations Conservation
AREA PROJECT
AMOUNT OF
DURATION
US$158,200 Forum for
(€113,000) Environment
governance of Gambella NP
US$288,000 Wild-CRU
(ETB3,600,000) Department of
US$2,110,074 Frankfurt
(ETB26,384,262 Zoological
(ETB 3,847,005) Development
Simien National US$406,240
(ETB 5,078,000) Zoological
Simien National US$50,800
Alatish National
US$3,748,818
SECTION 6: EWCA FINANCIAL NEEDS
Ethiopia at this stage does not have an overarching strategy for the management of the
protected area system. For the purposes of this study, it is assumed that in broad terms the
status quo of the current PA system will be maintained and that this will continue for the
next 5 years. Based on this assumption three scenarios are developed in order to assess the
costs of an effectively managed PA system.
Scenario 1 Additional funding needed to meet the costs of essential management
Scenario 2 Costs of Scenario 1 together with essential capital works and development.
Scenario 3 The costs of Scenarios 1 and 2 plus the socio economic costs of community
development and measures necessary for the reduction of population and
grazing pressures within the PA system.
In developing these scenarios, it is further assumed that the PAs will be managed generally for biodiversity conservation at the current number of tourist arrivals.
6.1 Scenario 1: Resource Protection
As indicated in the Introduction to this report, the funding of PAs has been of low priority for
the different tiers of government in Ethiopia and accordingly the budgets fall short of
meeting basic requirements. Based on the UNDP Financial Scorecard assessments for EWCA the deficiencies noted on a national basis are a factor of 4. This mark-up factor applies to
meeting basic operational costs only. If development costs for infrastructure and other
works were to be included, the factors would be higher.
Accordingly, Scenario 1 is based on an increase in current funding (ETB16.1 million) by a
factor of 4 which amounts to ETB64.4 million per annum.
Within the Scenario, it is envisaged that staffing numbers will have to be increased to cover
the gaps noted in the scorecard assessments. In particular, these gaps are noted at the "expert level" both at the central office and in the PAs and include enhancements to the
following management functions.
Monitoring and evaluation Infrastructure development and maintenance Public relations and education Hunting facilitation and services Community relations and outreach programmes Donor programme coordination Biological research Search and rescue and emergency procedures
Policy development and guidelines Business concession and lease management Management plans, zoning and habitat recovery planning The estimated number of staff, both on site in the PAs and in the Central Office, to fully
perform these enhanced functions is approximately 200 and the direct cost in ballpark terms
is ETB20 million per annum. With overheads the total cost could approach ETB40m per
annum when all facilities, premises and equipment needed to implement the programmes is
In addition to the above, limitations are noted at the guard or scouts level in relation to the
following capabilities: Weed identification, removal and control Facility maintenance and fencing Hunting monitoring Wildlife control measures Domestic animal monitoring, veterinary services and controls Boundary demarcation.
The estimated direct cost of ten additional expert park staff and equipment for each of the
13 sites is placed at ETB4 million per annum. With overheads the total cost could be in the
order of ETB8 million per annum.
The existing staffing structure for EWCA central office and for the case study parks is
provided at Annex 4.
The management structure has been the subject of previous intensive study and is considered to be satisfactory in terms of the organisational arrangements overall.
Accordingly, the enhancements to the functions noted above should be undertaken within
the framework of the existing management structure. The additional functions generally
require an expansion of the programmes now being undertaken and require additional staff
to perform the roles necessary to achieve suitable outcomes and standards of performance
in a timely manner.
Training and capacity building is not specifically included in this estimate since it will be
covered separately under the SDPASE Project budget over the next 3-4 years. In particular a study of training needs for EWCA will be undertaken commencing in October 2009, with a
view to assessing skills gaps and how best to meet the specific needs of individuals and the
Based on the deficiencies noted in the scorecard, it is apparent that staff at most of the operational levels would benefit from skill enhancement and training in financial matters as
they relate to PA management. This includes an understanding of the government budget process, the financial management system in use by EWCA, financial delegations and
responsibilities, procurement procedures, budget bid preparation and general accounting principles and processes. A specific training course needs to be developed for this purpose
and delivered to all staff with a responsibility for budget preparation and money handling
duties. Once training is provided, it should be possible for staff to include financing issues into the management planning process and to be able to develop business plans.
The possibility of non-government organizations or donors assuming further responsibility to
manage part of the PA system with a view to reducing costs is not considered in detail at this stage, since the policy development work necessary to implement the legislation is not
sufficiently advanced. Issues that are relevant here include the likely competition between government and NGOs for donor funding to manage sites and the likelihood that EWCA may
not have sufficient resources to adequately supervise the NGOs management of such sites.
6.2 Scenario 2: Basic Management and Investment
Scenario 2 provides for the addition of capital works and infrastructure that are additional to
the figures developed under Scenario 1. Included in the proposed funding are additional
outstations from which to expand the PA protection function, visitor centres and displays to
meet the needs of tourists, research and laboratory facilities, additional staff
accommodation, workshops and storage and power generation facilities. Estimates of the
funding requirements to provide these facilities are of low order but can be taken to be
approximately ETB90 million in total for the 13 PA sites. Clearly, requirements will vary from
site to site and in particular visitor centres will not be required at all locations. In addition,
where sites are close to towns there will be no need for workshops, although secure storage
facilities will remain a requirement.
Table 15 estimates the capital requirement, based on providing facilities using durable
materials with an estimated life of 30 years. Included in the estimated costs are design fees
and the costs of construction supervision. In the case of buildings, the costs of fit out, furniture and other items of equipment are also included. On a site basis and over a period of five years the average cost is ETB1.39 million per
annum or on a aggregate basis for all sites it is ETB18 million per annum.
Table 15: Estimated Capital Requirement for Scenario 2
CAPITAL ITEM
[ETB MILLION]
Office/Laboratory 1.25
Power/Water 0.75 Workshop and storage
Car parking and roads
Vehicles 0.5 Total per site
Total for all 13 sites
Since there has been virtually no development in some parts of the PA system in past years
and the capacity of staff to implement new works is low, it is not appropriate to propose a
large increase at once. Accordingly, it is proposed that new works and infrastructure be
introduced on a sliding scale beginning at 10% in the first year and increasing in stages as
expertise expands.
Based on average expenditures this places the financial gap between income of ETB12.96
million and proposed expenditure of ETB82.5 million equal to ETB69.5 million per annum.
6.3 Scenario 3: Effective Management
While scenarios 1 and 2 address PA needs, a further scenario is required in order to take into
account the costs of addressing major socio-economic issues within the PAs such as
community development and the reduction of grazing and population pressures. An estimate of costs has been made for a similar action in the Lalibela area (ESTDP, 2009) with a figure amounting to ETB125,000 to relocate one household. On this basis the cost of
reduced pressures in BMNP alone with some 20,000 households in the park would be some
ETB25 million. The estimate is "ball park" only and would require an extensive assessment
on a case-by-case basis to determine a more reliable estimate.
6.4 Summary
The national level financial position is summarized as follows in Table 16. In essence, the
findings are that for the 2009/10 year the budget is ETB16.1 million with anticipated revenue of ETB12.96 million. The funding gap for the entire PA system is accordingly ETB3.1
million. The estimated cost to bring the national PA system to a functional "basic" level of operation is ETB64.4 million per annum which when revenue is deducted leaves a gap of
ETB51.4 million per annum. At the "optimal" level in which a range of infrastructure needs is included, the estimated cost is 82.5m pa leaving a gap of ETB69.5 million per annum.
It should be noted that the costs of dealing with the issues of resource exploitation by local
communities and livestock grazing is largely indeterminate but based on previous studies
could be in the range of ETB25 million per protected area. This would provide for household relocation and measures to provide alternative livelihoods to replace unsustainable practices
now occurring in the PAs.
Table 16: Estimated Cost Summary of the three scenarios
[ETB MILLION
[ETB MILLION
[ETB MILLION
[ETB MILLION
[ETB MILLION
[ETB MILLION
[ETB MILLION
64.4 per Ave 82.5 per
Estimated Gap [ETB million]
SECTION 7: THE ECONOMIC VALUE OF PROTECTED
AREAS
Most protected areas are primarily created to conserve biodiversity, but there are many
other important values which protected areas are increasingly being expected to deliver, such as social, economic and cultural benefits. Assurances that protected areas will provide
such benefits are often crucial for attracting the support needed for their creation and sustenance, however delivering on these promises is seldom easy. Protected area managers
and protected area agencies are increasingly being asked to assess the values, benefits and
services provided by protected areas in order to warrant core funding for conservation.
Protected areas provide many resources that can be used to provide direct gains, subsistence resources or less tangible benefits such as climate change mitigation and
erosion control. Benefits provided by protected areas can be divided into four categories: Providing services to enable people to make a living (e.g. fisheries and forestry, both
subsistence and commercial)
Supporting human life (e.g. potable water and clean air) Regulating other important ecosystem functions and services (e.g. montane forests
regulating downstream water flows)
Having cultural significance and providing opportunities for recreation (e.g. sacred sites
WWF has identified a generic list of the range of possible benefits, both tangible and
intangible, which can serve to prioritise values and benefits provided by protected areas,
which make the most impact in terms of influencing political will and trigger increased funding for biodiversity conservation (Dudley and Stolton, 2008).
Biodiversity, as the overriding benefit that protected areas should provide, particularly
when rare, endangered or endemic species are involved or where rare habitats, such as grasslands or freshwater areas are protected. Many sites also play a vital role in
protecting commercially important species, such as crop wild relatives, which may
provide important genetic material to combat disease or increase productivity of
commercial crops in the future.
Employment, for local people as managers, rangers, tourist guides and through providing
services to visitors.
Food, including wild food plants, wild game and fish (either directly or through the
contribution to fish stocks by protecting spawning areas). Traditional agricultural systems
and associated agro-biodiversity is increasingly being protected in landscape protected
areas and protected areas can be important for the conservation of locally adapted crops
(landraces) and/or agriculture practices. Some protected areas are also important for
livestock grazing and fodder collection where this is an integral part of the conservation
Water, as life support to maintain water quality and in some circumstances help increase
the quantity of water available (i.e. through filtration, groundwater renewal and
maintenance of natural flows). Water from protected areas is important for non-
commercial use, such as subsistence agriculture, drinking, washing and/or cooking and
for commercial uses including protecting water used for large-scale irrigation,
waterways, bottling plants, hydro-electric power or municipal drinking water source.
Cultural and spiritual values, appreciated by the local and global community. Many of the
world's oldest protected areas were set aside for their cultural or historical values. They
can contain important archaeological sites and historic buildings and protect pilgrimage routes and traditional land use systems. Many protected areas include sacred natural
sites or landscapes, such as sacred groves, waterfalls and mountains.
Health and recreation provided by protected areas to promote physical and mental
health and as major recreational resources. Health values can also be derived directly
from medicinal resources from within protected areas, e.g. herbs, for local use or for the
pharmaceutical industry.
Knowledge development and education through formal and informal dissemination of
information and by providing sites for ecological research and monitoring.
Climate change mitigation and adaptation, in which protected areas can play a role in
both sequestering carbon and ameliorating local climate impacts.
Disaster mitigation, in which protected areas can help mitigate these events by, soil
stabilisation (e.g. preventing avalanches, landslide and erosion), flood prevention (e.g.
mitigation in small watersheds, flood plains and wetland protection), coastal protection
(e.g. mangroves, sand dunes or coral reefs as storm and surge barriers).
Pollination services, a value that is often overlooked, but if insects do not thrive nor will
our crops; protected areas can therefore play an important role in pollinating nearby
crops or in contributing to the production of pollination products such as honey.
Materials provided by protected areas can include a whole range of natural products
including timber, fuel wood, coral, shells, resin, rubber, grass, rattan, minerals, etc.
Values and benefits provided by protected areas can be divided into two main categories,
use- and non-use values:
Direct Use Values are values of functions and benefits that accrue directly to the
consumer. These values may be associated with either consumptive uses or non-
consumptive uses. Consumptive uses could be commercial and industrial utilisation of
products, such as timber, fuel wood, medicinal plants, pasture, land for agriculture,
income from tourism, etc.
Indirect Use Values are benefits that accrue indirectly either to users or no-users.
Examples can include many ecological and environmental services, protection of biodiversity, aesthetic, cultural and spiritual values.
Option Values are benefits that could accrue in the future from resources that have no
apparent marketable value today.
Existence Values are intrinsic values placed by non-uses on environmental assets
without any intention of using it directly in the future.
Bequest Values are associated with values that people derive from knowing that the
forest is passed on to future generations.
7.1 The Value of the Ethiopian Protected Areas System
By international standards, developed within the framework of the Convention on Biological
Diversity (CBD), a guideline suggests that a national protected areas system is
representative, if 10% of each vegetation class is put under effective conservation management. This guideline implies that if this target is met, associated ecosystem services
can be effectively delivered to support and sustainably develop a national economy. Since many ecosystem services are provided by a scale which goes beyond protected areas, a
protected area has to be viewed in the context of biodiversity protection measures within a
wider landscape (e.g. ecosystem level, river basin, catchment area, etc.).
This section explores the economic value of some ecosystem services provided by protected areas in Ethiopia within a wider landscape.
7.1.1 Watershed Protection for Sustainable Development Water provided by ecosystems and protected areas is vital for local livelihoods and
sustainable development (e.g. the manufacturing sector). On a national scale, freshwater ecosystems (water catchment areas, rivers and wetlands) and associated flows in particular,
provide a broad range of services: clean drinking water, fish protein, fertile land for flood-recession agriculture and grazing, populations of wildlife for tourism, growing vegetables and
fruit, organic raw materials, medicinal plants, inorganic raw materials, flood mitigation, groundwater recharge and climate stabilisation. Services, such as the provision of safe
drinking water, water for irrigation and hydropower are the most recognisable of all services
as they provide direct products people can use. Regulation services are more easily overlooked, but are equally vital: natural purification processes in wetlands and river
ecosystems contribute to maintenance of clean water; evaporating and infiltrating water are part of the natural patterns of rainfall and discharge.
Table 17 is based on a study by Koorsgard (2006) who compares economic valuation studies
in developing countries, analysing the values of watersheds and associated services in order
to compare the provided values. The ecosystem services provided by watersheds include the values for:
Biodiversity Water consumption Water quality Flood mitigation Ground water replenishment Erosion control Microclimate stabilisation The calculation presents the values of these services based on the hectarage of all EWCA managed national parks and wildlife reserves/sanctuaries within Ethiopia. At this point, it
should be noted that such ecosystem services are provided at scales, which are commonly
larger than a national park, such as river basins, watersheds and catchment areas.
Nevertheless, national parks are an integral piece of the protection of watersheds in Ethiopia
alongside with other protected area categories (e.g. National Forest Priority Areas) and the
introduction of sustainable land use practices and soil conservation. The monetary values
presented in this calculation serve to demonstrate the importance of protecting some of the
centrepieces of major hydrological systems in Ethiopia, such as the Harenna forest, Bale Mountains National Park and the entire Bale Mountains Massif. The indicative value of water-
related ecosystem services provided by Ethiopia's national parks is between US$432 million (ETB5.5 billion) and US$14 billion per annum (ETB175 billion). Due to the wide variation of
values, the lower end of the scale is used as the most conservative estimate for the purpose
of developing arguments.
Figure 5: Gelada Baboon This species is restricted to high grassland escarpments in the
deep gorges of the central Ethiopian plateau, in the Tigre,
Begemdir, Wolle, and Shoa Provinces between 1,800 and 4,400 m a.s.l.
Table 17: The Hydrological Value of Selected Protected Areas
National Park/
Sanctuary
roclimate
nsumption
illion US
illion US
illion US
illion US
illion US
illion US
illion US
Flood Mitig
Erosion Con
88,700 4.44 to 35.48
0.89 to 7.98 1.77 to 10.64
0.53 to 2.67 to 23.99 5.33 to 31.98
75,600 3.78 to 30.24
Babile Elephant 698,200 34.91
1.40 to 6.98 to 62.84
0.49 to 2.47 to 22.24 4.94 to 29.65
1.01 to 5.06 to 45.55
Geraille 385,800
0.77 to 3.86 to 34.72 7.72 to 46.30
Kafta-Sheraro 500,000 25.00
1.00 to 5.00 to 45.00
51,400 2.57 to 20.56 1.03 to 71.96 0.10 to 87.38
0.81 to 4.07 to 36.61 8.14 to 48.82
Senkelle Swayne's
Sanctuary Simien Mountains
41,200 2.06 to 16.48 0.82 to 57.68 0.08 to 70.04
0.95 to 4.73 to 42.58 9.46 to 56.77
7.1.2 Carbon Stock For the assessment of the carbon value at national level, the following approach was taken:
We used the land cover type map prepared by the WOODY BIOMASS INVENTORY AND STRATEGIC PLANNING PROJECT (WBISPP, 2005) and performed a GIS overlay analysis to
derive at land cover types of the protected areas managed by EWCA.
Next, we used the weighted averages of woody biomass stock by land cover class provided
by WBISPP (Tab. 3.3 of the National Strategic Plan for the Biomass Energy Sector) to
calculate the woody biomass.
This figure was multiplied with the default biomass expansion factor of 2.0 which is the
lower end given for broadleaved tropical forests (source: IPCC LUCF Sector Good Practice Guidance) to arrive at the total above-ground biomass (incl. living small branches, twigs,
To calculate the total biomass stock, we estimated below-ground biomass, deadwood and
litter using default values used by FAO Forest Resource Assessment (FRA) in Ethiopia, namely 22%, 1.1% and 20% of above-ground biomass respectively.
Using a carbon content of biomass of 50% we arrived at carbon stock in tC, which was
multiplied by 3.67 to come to the tCO2 equivalent.
Finally, we used a price of US$4 per tCO2, which is about the current market price for
temporary Certified Emission Reduction Units (tCERs) to calculate the current value of carbon stock. It was conservatively assumed that the one-time payment (contrary to an
annual payment) would be sufficient to ensure the permanence of the forest. To approximate the yearly value of the carbon stock, it was assumed that the forest vegetation
would disappear in 50 years at the historical deforestation rate of about 2% in Ethiopia (baseline).
Based on this coarse estimation, the carbon stock of the Ethiopian Protected Areas System1 is worth about US$938 million, while through deforestation about US$18.8 million are lost
annually. The case study sites Bale Mountains and Gambella are the parks with the highest carbon stock (see Table 18).
1 Unfortunately, the WBISPP data do not cover all National Parks. The newest parks are not included in this calculation.
Table 18: Carbon Value of the National PA system
Protected Area
Carbon stock
Annual loss
value [US$]
National Parks
5,501,515 110,030
63,495,760 1,269,915
12,179,876 243,598
237,165,000 4,743,300
1,896,833 37,937
97,753,541 1,955,071
9,504,161 190,083
23,342,070 466,841
20,564,500 411,290
67,363,415 1,347,268
3,973,523 79,470
70,428,928 1,408,579
Wild
11,845,941 236,919
52,113,124 1,042,262
57,988,176 1,159,764
15,321,159 306,423
74,096,077 1,481,922
63,658,500 1,273,170
Senkelle Swayne's
49,288,715 985,774
5,280,673 234,442,236 937,768,946 18,755,379
7.1.3 Biodiversity There is a common understanding that biodiversity provides many benefits. Some of these
benefits come in the form of goods that can be directly valued, as they provide something
that can be extracted and sold. These goods include everything, from domesticated agricultural crops that form the basis of global food supply, to the basis of medicines and to
fibres for textile production. Thus, biodiversity is widely valued as a food pantry and genetic
storehouse for biotechnology.
Furthermore, biodiversity has an intrinsic value, which implies that human kind has to
conserve biodiversity and ecosystems, regardless of the value of benefits accruing to human
kind from biological resources. This value is difficult to determine in monetary form as it is of
philosophic nature. Nevertheless, economists have developed valuation methods that
investigate the measurable values of biodiversity as an attempt of approximation.
The following reference values (see
Table 19) are based on Koorsgard (2006). Looking at the protected areas currently under
the authority of EWCA, the value of biodiversity is found in a range of US$3.75 to 112
million per annum (ETB47 to 1,400 million). Considering the high levels of endemism as well
as the unique nature of landscapes and vegetation classes it is assumed that the overall
value of biodiversity in Ethiopia could be in the higher end of the valuation range provided.
Table 19: The National Value of Biodiversity
National Park/
US$/annum
Sanctuary
Area [ha]
[million US$]
Abijatta-Shalla Lakes
Babile Elephant Sanctuary
Senkelle Swayne's Hartebeest Sanctuary
Simien Mountains
TOTAL 3,745,900
3.75 to 112.38
7.1.4 Medicinal Plants On a national level, medicinal plants are of enormous value to the national population. As
studies have shown, up to 80% of the Ethiopian population are using medicinal plants.
Mander (2006) estimated the total value of medicinal plants (the raw material) at US$35 million (ETB437.5 million) and including the associated trade of products at about
US$167million (ETB2 billion), including raw materials. This value is not to be underestimated in terms of cost savings to the government in terms of the national health budget (Mander,
2006). Considering that most medicinal plants are collected in natural vegetation, the value of protected areas in terms of protecting the source of medicinal plants becomes apparent.
This value also links to the value of biodiversity at large, including the future option value of
genetic resources contained in medicinal plants with their potential to be used for the
production of manufactured medicines.
Based on Mander (2006), Sutcliffe (2009) calculated an average value of medicinal plants of
US$3.52/ha/annum. If this value is applied on EWCA managed protected areas, a total value of US$13.2 million is derived (see Table 20).
Table 20: Value of Medicinal Plants
National Park/
US$3.52/ha
Sanctuary
Abijatta-Shalla Lakes
Babile Elephant Sanctuary
Geraille 385,800
Kafta-Sheraro 500,000
Senkelle Swayne's Hartebeest Sanctuary
Simien Mountains
TOTAL 3,745,900
13,185,568
7.1.5 Genetic Resources As an example for the value of genetic resources and the option value that could be realised
from such a resource in the future, this study draws on an example provided by an
exceptional resource, found in the Ethiopian highlands.
Ethiopia's montane forests are the cradle of the Coffea arabica gene pool and its use is
deeply rooted in the culture and socio-economic life of the country. Coffee is one of the main
export commodities and its production provides a means for living for an estimated 15 million people (Wood, 2006). Hein and Gatzweiler (2005) estimate the net present value of
C. arabica at US$420 million to US$1,458 million (ETB5 to 18 billion), at discount rates of 10% and 5% (over a 30 year period) respectively by valuing the coffee genetic resource for
breeding purposes (see Table 21). The study estimated the value of gene races in terms of
disease resistance and genetic stock for breeding low-caffeine production varieties.
Protected areas that effectively conserve biodiversity and are representative of the national vegetation classes have a good potential to conserve genetic values and make use of their
potential.
Table 21: Genetic Resource Value of Ethiopia
PROVIDED
ANALYSIS
[US$ MILLION]
[US$ MILLION]
DISCOUNT RATE
DISCOUNT RATE
Coffee gene pool on National level
7.1.6 Sedimentation and Soil Erosion Currently, hydroelectric power accounts for 98% the total power supply in Ethiopia and
sedimentation is posing a major threat to the nation's hydropower generation capacity. A
major problem in the country is soil erosion and land degradation, resulting in the
sedimentation of reservoirs and the high cost associated with silt accumulation. Studies
indicate that annual soil erosion in Ethiopia varies from 17 to 300t/ha (EOEARTH, 2009).
Heavy sedimentation has been experienced by Ethiopia's existing dams and is a very real
risk to the lifespan of hydrodams as well as dams for irrigation and water supply,
additionally to an increase in pollution of water reservoirs and flooding hazards.
A study on Koka dam in the Awash river established that sedimentation is causing the loss of
128 million KWh with an estimated economic loss of ETB60 million per annum (ca. US$4.8 million per annum). The subsequent output lost by the manufacturing sector due to power
rationing was estimated at ETB388 million per annum (approx. US$31 million). Hathaway
(2008) notes that sedimentation has similarly reduced the lifespan of the Angereb and Melka
Wakena dams. No studies have been carried out on the production loss of Melka Wakana
and Yadot hydroelectric schemes, however, looking at the Koka dam example the cost of
sedimentation becomes apparent. Considering that Melka Wakana is one of the larger
electric power generators in Ethiopia, the economic loss due to reduced production capacities and lifespan of the dam is expected to be significant.
Table 22: Soil Loss Rates per Land Cover in Ethiopia
Source: adapted from Yesuf et al. (2005)
LAND COVER
SOIL LOSS
[T/HA/YEAR]
Grazing and browsing land
Currently unproductive
(former cropland)
Currently uncultivable
Wood and bushland
Table 22 demonstrates that the land under cultivation and former cropland cause the
highest rates of soil loss of all land uses. The main factors leading to high sedimentation
levels are poorly managed agricultural lands in the headwater catchment caused by the
removal of vegetation cover through deforestation, repeated tilling of the soil to prepare a
fine seedbed and lack of adequate soil and water conservation. Mass movement of soil
(earth flow) and landslides are found to occur during the periods of heavy rains partly due to
sand and pumice querying. Hence, catchment protection through biodiversity conservation can greatly reduce sedimentation levels.
7.1.7 Cost of Deforestation Ethiopia is subject to severe environmental degradation which in the form of soil degradation, loss of forest cover and quality, loss of wetland areas, water resource depletion
and loss of biodiversity.
The Ethiopian Forestry Action Plan (EFAP, 1994) concluded that the deforestation rate in
Ethiopia was between 150,000 and 200,000 hectare per year. In a forest resource
assessment of Ethiopia, Reusing (1998) also found that within 17 years (1973–1990) high-
forest cover decreased from 54,410 to 45,055km2 or from 4.75% to 3.93% of the land area. The study arrived at a deforestation rate of 163,000 hectares per year. Another study
estimated a deforestation rate of 141,000 hectares per year (FAO, 2007).
Direct Use Values of Forests and Woodlands
These are values of forest functions/benefits that accrue directly to the consumer. These
values may be associated with either consumptive uses or non-consumptive uses.
Consumptive uses could be forest products such as timber, fuelwood, charcoal, fruits, medicine, animals, etc. Non-consumptive use values include values of functions such as
ecotourism, recreation, science, education, etc. All these values/benefits would be lost to deforestation and the associated cost for the country would be immense.
Under the direct use value there are values associated with timber/wood extraction, livelihood support for communities in the form of wood products and ecotourism. A study
undertaken as part of the Nile Basin Initiative (cited in McKee 2007) reports that the total net cost of deforestation of high forest and woodland in the Baro-Akobo Sub-basin amounts
to ETB482.9 million per annum. Another estimate by Sutcliffe (2009) for the same area estimates an average annual deforestation rate of 28,916 hectares, amounting to an
average annual loss of ETB382 million.
The consumptive use value considered only the sustainable harvest from natural forest
under a sustainable management regime. Taking the current estimate of annual growth of 3.3m3/year and with production assortment of 47% and 53%, log and fuel wood respectively
based on practical experience of the Oromia Forestry and Wildlife Enterprise (Personal communication with Ato Diroo Bulbula), the annual loss estimated is shown below.
Table 23: Lost Timber Revenues due to Deforestation
GROWTH RATE
TIMBER VALUE
TOTAL VALUE
FOREGONE
[M3/ANNUM]
[ETB/M3]
FORGONE PER
141,000 3.3 1,846
Livelihood Support Value of the Forest Resources
For the people who live in or near the forest, an obvious impact is the decrease in the future
capacity of the forest to produce wood, fodder, fruit, and medicinal plants and so on.
Therefore, the economic loss of deforestation in the form of sustainable harvest to rural communities is significant and the place of forestry in addressing food security is
considerable. Watson (2007) estimates the consumptive use value of forest products at the Bale Mountain Eco-region to amount ETB639 million or about to ETB500/person/annum,
which is 8% of total income for 78.8% of the population below poverty line of US$2 per day.
Figure 6: Fuelwood Collection in Bale Mountains National Park
Many protected areas in Ethiopia are inhabited and provide natural resources to rural communities, such as fuel wood, timber, grazing grounds, wild food
products (e.g. forest coffee), etc. The contribution of forest products for rural communities is significant, considering that 70%
of the African population depends on forest products. In Oromia a population of around 12
million lives close to 48 regional forest priority areas. Assuming that half of the population
earns less than US$1 per day it can be assumed that most are dependent on the forest for
their livelihood support. The conservative estimated direct use value of the forest to the rural poor is estimated to about ETB690 million. In another estimate the average value of
forest as source of raw material and food supply is estimated at US$181/ha/yr and this amounts to a loss of ETB319 million.
Erosion control
One of the major environmental benefits of forest is the role it plays in erosion control. This
value of forests is estimated on average US$96/ha/annum (Nature, 1997) and the total value of the forest for erosion control would be US$13.5 million per annum.
The total economic loss due to deforestation would be around US$660 million per hectare per annum, as shown in Table 24.
Table 24: Economic Loss due to Deforestation in Ethiopia
LOSS DUE TO DEFORESTATION
BENEFIT TYPE
Loss of timber and fuel wood
Loss of livelihood support as a source of raw
material and food supply
Loss of carbon value
Loss of erosion control value
7.2 The Economic Value of Bale Mountains National Park
The Bale Mountains National Park (BMNP) is situated in the Oromiya Region encompassing
2,471km². The park is characteristic for its Afroalpine habitat, including alpine meadows, moist tropical forest and cloud forest ranging from 1,500 to 4,000 metres above sea level.
Climatically, the area is characterized by a rainy season from March to October and a dry season from November to February. Precipitation increases with altitude from 600mm to
1,000mm in the lower altitude areas to 1,000mm to 1,400mm in the high alpine areas of BMNP. Mean monthly temperatures range from 19°C to 25.4°C.
Map 2: Bale Mountains National Park and Bale Eco-Region
The park is home to several endemic mammal species, such as the Mountain Nyala,
Ethiopian Wolf, Giant Mole Rat and Bale Monkey. The forest area also provides a habitat for Lion, African Wild Dog and Giant Forest Hog.
The Harenna forest within BMNP and the adjacent Mena Angetu National Forest Priority Area
(NFPA) on the southern slope forms the second largest stand of moist tropical forest remaining in Ethiopia2, covering about 1,800km². Approximately half of the park (877km²)
lies within this forest, which is home to high levels of biodiversity and endemism, including
many threatened species such as Prunus africana. The forest contains wild coffee (Coffea arabica) and is an important source of timber, NTFPs, honey and dry season grazing. The
entire forest is under considerable human induced pressure due to uncontrolled grazing and forest fire threatening the sustainability of the forest (Abdurahman, 2008).
The BMNP and indeed the whole ecoregion, covering 22,000 km² are of paramount
importance as a water catchment of regional importance. Over forty rivers originate in the
area forming five major rivers (Web, Wabe-Shebelle, Welmel, Dunnal and Gonale) which
provide water for an estimated 12 million downstream users in the Ogaden and Somali
agricultural belt (BMNP, 2007). The General Management Plan estimates the number of permanent and seasonal households residing within the current park boundaries to be 3,088 of which 62% are permanently
2 Denich et al. (2008) estimates that about 25,000km² of forest remain in Ethiopia covering about 2.5% of the total landmass of the country.
residing in the park (BMNP, 2007). With an average of seven individuals per household, this number derives a total human population of about 21,600 people, which correlates to
estimates given by park staff (Abdurrahman Wariwo, personal communication) and the Ethiopian Wolf Conservation Programme (Zegeye Kibret, personal communication). The
population is thought to be steadily increasing. The National Park and buffer zones contain
valued permanent and seasonal grazing resources and mineral rich water (horas). Livestock
numbers are estimated at up to 168,000 head in the year 2004 (BMNP, 2007). The
production of teff, maize, potatoes and coffee is commonly practiced.
7.2.1 Direct Use Values
Recreation and Tourism
Tourism and recreation was identified as a potential benefit, which is currently not fully
realised as to having a good potential to benefit local communities, as well as government and the Ethiopian economy at large. The main tourism season concurs with the dry season
from November to February.
Revenue accruing to BMNP tourist entry fees amounted to ETB249,825 (US$19,986) in
2008/09 (see Table 25). Income was also received for accommodation at the lodge in the
park but this revenue is not known.
Table 25: BMNP Entry Fees 2008/09
SERVICE PROVIDED
SCALE OF ANALYSIS
US$/ANNUM
Tourism revenue from entry BMNP (247,100 ha)
This revenue was collected from about 2,000 visitors of which the majority are international
tourists, as can be seen in Table 26.
Table 26: BMNP Tourist Arrivals in 2008/09
TOURIST CATEGORY
ARRIVALS
International tourists
Resident foreign tourists
National visitors
Tourists have to be accompanied by guides within the park, which provides seasonal
employment to eleven guides, 20 horse providers and their assistants and some field cook assistants. These service charges do not accrue to the park authority but to the private
sector. Table 27 presents visitor fees, including entry and camping fees as well as fees for
guides and horses. According to this information, an international tourist pays about US$11
per day (ETB137.5), of which US$2.8 accrue to the national park and US$8.2 accrue to the
private sector for trekking and camping. Other activities, such as sports fishing are charged
Table 27: BMNP Tourist Fees
ENTRY FEE
GUIDE PER
RIDING OR
PER 48HRS
PER 48HRS
ASSISTANT
PACK HORSE
PER 48HRS
PER 48HRS
ETB US$ ETB US$ ETB US$ ETB US$ ETB US$
tourists Resident
30 2.4 10 0.8 120 9.6 50 4 35 2.8
tourists National
The income for guides and horse assistance is estimated at US$20,664 per annum
(ETB258,300). This calculation is based on the assumption that half of the international
tourists go trekking in the park for an average trip length of three days (US$8.2 per
international tourist per day x 840 tourists x 3 days).
Table 28: BMNP Employment Benefit
SERVICE PROVIDED
SCALE OF ANALYSIS
US$/ANNUM
Income to private sector
BMNP (247,100 ha)
Employment
Currently employment is showing minor economic importance for local communities (some
employment opportunities affiliated to BMNP mainly for Dinsho community), as well as
government employees. Job opportunities are seasonal for tourism related activities (e.g.
guides, horse rentals, etc.) and permanent for park and NGO employees. Employment
benefits can be considered as a cost to government and social benefit to society in general.
It is estimated that the park currently creates more than 60 full time jobs (park staff and
NGO staff), as well as about 55 seasonal jobs in the tourism sector.
Salaries for park employees (including incentive payments and scout salaries supported by
NGO) are estimated to be around US$40,000 per annum (ETB487,700), as can be seen in
Table 29: BMNP Staff Salaries
NUMBER OF
SALARY PER
INCENTIVE
TOTAL PER
EMPLOYEES
ANNUM [ETB]
PAYMENT BY
ANNUM [ETB]
NGO [ETB]
Experts 4 16,800
TOTAL US$
US$40,000
Agriculture
Agriculture is legally not permitted in National Parks but is practiced extensively in parts of
BMNP. Three types of farmers have been identified:
Farmers, who claim to have permanently resided in the park for generations and pay
income tax for agricultural produce.
Farmers, permanently residing in the park who do not pay taxes. Seasonal farmers, increasing in numbers since the early 1990's regarded as settlers. Participants indicated that the area used for crop production is increasing and especially
encroaching ever higher regions of the park. Human settlement and cultivation inside BMNP has been increasing since the park was established in the 1970s and has now reached
unsustainable levels with coincident rapid resource degradation. Watson (2007) investigated the direct use value of crop production in the Bale Mountains Eco-region and derived a net annual benefit of US$1,157 per household (ETB14,462). Table
30 calculates the value of crop production for the number of permanent households residing
in the park (as reported in the BMNP General Management Plan). It is assumed that crop
production is associated with households residing within the park boundary on a permanent
basis only. The total value of crop production within BMNP is estimated to be US$2.2 million per annum (ETB27.5 million).
Table 30: Crop Production Value of BMNP
NET VALUE
PROVIDED
ANALYSIS
[MILLION
US$/ANNUM]
Crop production in BMNP;
According to an analysis based on a land use cover assessment conducted in 2005 (WBISPP)
the area under cultivation within the national park is 921 hectares. This amounts to less
than 0.4% of the total land of the park. Considering the relatively high net present value of
crop production, a land use zonation and possible re-demarcation of the park boundary to
exclude the majority of cultivated land appears to be the most suitable way to regulate further conversions of natural habitat. Incentive based resettlement could be considered for
farmers, cultivating in core conservation zones such as the Harenna Escapement. The General Management Plan (BMNP, 2007) provides for a re-demarcation of the park
boundary, which would concentrate on the exclusion of a majority of cultivated areas and
issue legitimate land certificates to the remaining farmers within the new park boundaries.
Livestock grazing and fodder collection
Grazing of livestock is legally not allowed in BMNP, although commonly practiced and of
major importance to local communities in terms of subsistence and cash income. The BMNP
General Management Plan provides estimates of up to 168,000 head of livestock within the
park boundaries, which exerts immense pressure on the fragile environment of the park.
Participants indicated that up to 50% of the park is used for grazing. Mineral rich water
points found in the park are also used by pastoralists to supplement mineral requirements.
However, accurate figures on livestock production, such as total livestock units, units per
household, etc. are not known (Flintan et al. 2008). Pastoralists are divided into two groups:
Permanent park occupants with livestock. Seasonal occupants driving livestock from the low lands into the park for 3-4 months
during the dry season.
Watson (2007) studied the direct use value of livestock to households in the Bale Mountains
Eco-region and estimated an annual value of US$228 per household (ETB2,850). Table 31
calculates the value for the number of permanent and seasonal households reported in the
BMNP General Management Plan. The estimated value of livestock production in BMNP is US$0.7 million per annum (ETB8.8 million).
Table 31: Livestock Production Value of BMNP
NET VALUE
PROVIDED
ANALYSIS
[MILLION
US$/ANNUM]
Livestock Production BMNP;
and 1,168 seasonal
The sustainable livestock carrying capacity for BMNP is currently unknown. However, grazing
is considered a major cost to biodiversity conservation due to various issues such as:
Competition for grazing and browsing wildlife species and overgrazing Destruction of habitat for endemic species (e.g. destruction of giant mole rat barrows
and associated food competition to the Ethiopian wolf)
Burning of Erica to improve pasture Domestic animal associated disease risk to wildlife (e.g. rabies) Formation of livestock tracks in a fragile environment Change of pasture composition due to selective grazing
In view of the relatively small economic value of livestock production within the national park compared to the large grazing area (over 50% of the park area), strict land use
zonation and law enforcement is necessary to regulate resource use. Furthermore, the provision of extension services to pastoralists in livestock husbandry, pasture management,
access to veterinary services and products and a long term breeding programme to improve genetic stock might act as an incentive to decrease park usage and concentrate grazing in
the buffer zones.
Fish resources
Traditionally, people are not accustomed to fishing and fishing does not play a role in livelihood strategies in BMNP. In the 1960's Rainbow and Brown trout were released in a
number of streams within BMNP and have proliferated well. However, the ecological impact
caused by their introduction is unknown.
The resource is mainly used by a few sports anglers and hence there are minor economic
opportunities for a few fishing guides. Sport fishing also provides some revenue for the
tourism industry (e.g. tour operators) and government (e.g. fishing licences) and is
identified as a tourism activity in the General Management Plan, which spells out fishing
regulations and license fees, as can be seen in Table 32. Sport fishing is restricted to five
fish per rod per day and a total of 15 fish per trip, including minimum length and weight for
consumption extraction.
The number of licenses issued per annum is not known, however the activity is considered to
be of minor revenue importance at the moment but has a potential to attract tourists if
marketed to the right customer segment.
Table 32: BMNP Fishing Licence Fees
3 DAYS LICENCE
ANNUAL LICENCE
National licence
Timber, firewood and non-timber forest products
Firewood is of major importance to local communities. Commercial timber production is not legally allowed in the national park but reported especially in the Harenna forest. Other
wood products such as poles are important for fencing and construction. The collection of non-timber forest products (NTFP) is of major importance to local communities in terms of
revenue generation and is practiced on a continuous basis. Watson (2007) studied the direct use value of timber, fuelwood and non-timber forest
products (e.g. honey, coffee, bamboo) to households in the Bale Mountains Eco-region and
estimated an annual value of US$407 per household (ETB5,087 per household). Although
the values of each forest product (e.g. construction wood, fuelwood and various NTFPs) cannot be extracted from the study, a particular importance has been reported for honey
production and fuelwood collection (see Table 33).
Table 33: Value of Various Wood Products in BMNP
TOTAL VALUE
Honey production
Construction timber
Table 34 calculates the value for the number of permanent and seasonal households
reported in the BMNP General Management Plan. It is assumed that seasonal households are
present four months of the year. The total value of timber, fuel wood and NTFPs in BMNP is
estimated at US$0.9 million per annum (ETB11.25 million).
Table 34: Timber and NTFP Value of BMNP
NET VALUE
PROVIDED
ANALYSIS
[MILLION
US$/ANNUM]
Timber, fuel wood BMNP;
and 1,168 seasonal
Wild food
Wild foods, in particular coffee, honey and spices were identified as a major source of
revenue for local communities. These cash crops also provide a major source of revenue for the national economy in terms of processing and exporting the same. Participants indicated
that up to 50% of the BMNP is regularly used for the collection and production of wild foods, mainly the Harenna forest. At the moment, park management is not interfering or managing
these resources but it was indicated that extension work could prevent the overutilisation of these resources (e.g. preventing the slashing of coffee seedlings).
Watson (2006) has valued forest products, including wild foods (e.g. honey, coffee) together with the value of timber resources and fuel wood. The value of these products for BMNP is
presented in the timber and fuel wood section. Honey and beeswax production is reported to have a high relevance in terms of revenue generation as a cash crop in Rira community,
situated in the Harenna escarpment.
Medicinal resources
Medicinal plants were identified as a major resource to local communities in terms of subsistence usage. About 337 plant species are recorded to have medicinal properties in the
Bale Mountains (Watson, 2007). To estimate the value of medical plants in BMNP we draw on a study by Sutcliffe (2009)
based on Mander (2006), estimating a value of medicinal plants of US$3.52/ha/annum
(ETB44/ha/annum), as can be seen in Table 35.
Table 35: Medicinal Plant Value of BMNP
NET VALUE
PROVIDED
ANALYSIS
[MILLION
US$/ANNUM]
Medicinal plants
BMNP (247,100 ha)
Water usage
The commercial use of water resources (e.g. irrigation, bottled water, etc.) is not allowed in
BMNP whilst the non-commercial use is of major importance to local communities living in the park (see Table 36). Watson (2006) studied the effort of water collection for households
within the Bale Eco-region, reporting an average time of 23 to 25 minutes per day to carry water from the source to a homestead. This activity is exclusively carried out by women.
Considering the relative abundance of water in the Bale area due to various streams, the value of water for domestic consumption can be estimated to be at the lower end of the
range of US$50 to 400/ha/annum.
The value of water, used for household consumption, ranges between US$12.4 to 98.8
million per annum (ETB155 million to 1,235 million).
Table 36: Water Provision Value of BMNP
MINIMUM NET MAXIMUM NET
PROVIDED
ANALYSIS
[MILLION
[MILLION
US$/ANNUM]
US$/ANNUM]
Electricity Production
The water resource originating from BMNP is also benefiting the national economy by
providing energy. The annual value of electricity production is estimated at US$28 million
(ETB350 million) (see Table 37). Participants indicated that water pollution is currently not
an issue, however that the visibility in dams further downstream has decreased due to sedimentation.
At an average price of US$0.05/KWh (ETB0.6/KWh) the annual production of both
hydroelectric schemes within BMNP is valued at about US$28 million (ETB350 million).
Table 37: Electric Power Production Value of BMNP
NET VALUE AT
PROVIDED
ANALYSIS
PRODUCTION
US$0.05/KWH
[MILLION
US$/ANNUM]
Melka Wakana Hydro
Water for Electricity
Yadot Hydro Power
Irrigated Agriculture
The two river basins, Genale-Juba and Wabi-Shebelle provide water for irrigation for about
26,000 hectares (EOEARTH, 2009). The irrigation potential is estimated at 627,000 hectares
of which about 4% is currently utilised. If we take average production figures for commercial
maize of 4t/ha at a price of US$153/t (ETB1,912/t) an average value of
US$611.7/ha/annum (ETB7,646/ha/annum) is derived (price estimations based on Sutcliffe, 2009). According to these estimations, the current crop production value per annum is about
US$16 million (ETB200 million) whilst the potential value, based on current water
availability, could be as high as US$328 million (ETB4.1 billion), as can be seen in Table 39.
Although this figure cannot be associated entirely with the value of water, it is a very strong
indicator for the value provided through ecosystem services generated by the Bale
Mountains Massif for downstream economies.
Table 38: Current and Potential Irrigation Land
IRRIGATION
IRRIGATION
Table 39: Current and Potential Value of Irrigated Crop Production
SERVICE SCALE OF CURRENT
POTENTIAL
POTENTIAL
PROVIDED ANALYSIS ANNUAL
PRODUCTION VALUE
PRODUCTION [MILLION
[MILLION T]
[MILLION
US$/ANNUM]
US$/ANNUM]
Juba river basin 14,120
These figures clearly demonstrate the importance of downstream crop production in the
Ogaden and Somali Region, which is dependent on a continuous water flow from the Bale Massif. It also has to be noted that these calculations do not include the production within
the same watersheds in Somalia and Kenya, indicating the international importance of the Bale Massif. The importance of agricultural production in this area is emphasised by the fact
that the downstream area from the Bale Massif is one of the most food insecure areas within
Ethiopia (compare to Map 3).
Map 3: Food Insecurity Status
Source: FEWS (2006)
7.2.2 Indirect Use Values
Biodiversity
The value of biodiversity was identified of being of major importance to local communities,
the national population, the Ethiopian Government as well as the global community at large.
Current management activities in terms of biodiversity protection include general park
management and development activities carried out by the park itself and by NGOs
supporting the park (Frankfurt Zoological Society, Ethiopian Wolf Conservation Programme,
Due to the absence of valuation studies on the value of biodiversity, we refer to Korsgaard
(2006) who investigated the value of biodiversity by comparing several valuation studies using the benefits transfer method in developing countries. The results suggest that the
value of biodiversity in developing countries is found to be in the range of US$1 to US$30
per hectare per year (compare to Table 40).
Table 40: Biodiversity Value of BMNP
SERVICE PROVIDED
SCALE OF ANALYSIS
NET VALUE
[US$ MILLION/ ANNUM]
Biodiversity in BMNP
BMNP (247,100 ha)
Climate Change Mitigation
Climate change mitigation and local climate stabilization are identified as benefits for local communities, as well as the whole nation and the global community. Studies on the carbon
value within the park and the wide eco-region have been conducted. FZS (2008) found that in BMNP soil had a higher carbon stock per hectare than above
ground tree biomass. The study calculated a total carbon stock of 45.8 million tonnes in the Harenna forest, which equates to 168.1 million tonnes of CO2 worth approximately US$672
million (at US$4/t).
Table 41: Value of Carbon Stock
SERVICE PROVIDED
SCALE OF ANALYSIS
VALUE PER ANNUM
[US$ MILLION]
Climate Change Mitigation
BMNP Harenna forest
FZS (2008) estimates that about 12,000 hectares of mountain forest were lost in the period
of 1973 and 2005. If we multiply this figure by 200 tonnes of carbon per hectare of
mountain forest, we derive at 2.4 million tonnes of carbon, equating to 8.8 million tonnes of
CO2 worth about US$35 million (at US$4 per tonne of CO2), as presented in Table 42.
Table 42: Cost of Deforestation in BMNP
COST OF DEFORESTATION
CARBON LOST DUE TO DEFROESTATION
1973 TO 2005
[US$ MILLION]
Climate Change Mitigation
Table 43 presents a carbon figure for BMNP, based on the Woody Biomass Inventory Project data (WBISPP, 2005). The carbon stock, based on this data set, is considerably lower than
the estimates based on FZS (2008), amounting to 16.1 million tonnes, since the latter
included soil carbon.
Table 43: Carbon Stock Estimate based on WBISPP, 2005
Land Use Class
Total Carbon [t]
Total CO2 [t]
Afro-alpine; Erica /
Afro-alpine; Erica /
Afro-alpine; Grassland /
Cultivated Land; Rainfed;
Cereal Land Cover System;
lightly stocked Forest; Montane broadleaf;
Dense (50-80% crown
Forest; Montane broadleaf;
Open (20-50% crown cover)
Forest; Montane broadleaf;
Open (20-50% crown cover)
Forest; Montane coniferous;
Dense (50-80% crown
Forest; Montane mixed; Closed (>80% crown cover)
Forest; Montane mixed; Dense (50-80% crown
Grassland; unstocked
16,155,654
59,291,250
Statz and Held (2008) investigated the feasibility of carbon finance opportunities in the Bale Eco-region. The potential area for a REDD project was estimated to be around 500,000 ha of
a total reference area of 840,000 ha. The Oromia Forest Enterprise is the project developer in close cooperation with community-based organisations. The study estimates that the
project could potentially generate around 80 million tCO2 emission reduction credits within a
period of 20 years. At an estimated value of US$4 per tonne of CO2 this would result in
US$320 million (ETB4 billion). This relates to about US$25/ha/annum (ETB312.5/ha/annum) at an estimated reduction of 6.5tCO2/ha/annum. The value of carbon emission reduction per annum for the reference area (500,000ha) could be as high as US$16 million (ETB275 million). This estimation excludes the BMNP.
Soil stabilisation, flood prevention, water quality and quantity
The value of BMNP in terms of soil stabilisation is a major economic benefit to local
communities, the Ethiopian economy and the government. The vegetation within BMNP and the adjacent Forestry Priority Areas plays an important role in terms of erosion control and
landslide prevention in light of high deforestation rates recorded in the wider region. Frankfurt Zoological Society is in the process of starting a comprehensive study on the
hydrological system of the region in order to determine the value of the Bale Massif in terms of watershed protection and investigate possible ecosystem service payments to contribute
to the protection of the watershed.
Koorsgard (2006) reveals a considerable range of estimated total economic value of
ecosystem services in developing countries, from 30 to 3000 US$/ha/annum (ETB375 to 37,500/ha/annum) or from 10 to 230 US$/capita/annum (ETB125 to 2,875/capita/annum),
as can be seen in Table 44.
Table 44: Watershed Regulating Services of BMNP
PROVIDED
ANALYSIS
NET VALUE NET VALUE
[MILLION
[MILLION
BMNP (247,100 ha)
Flood mitigation BMNP (247,100 ha)
BMNP (247,100 ha)
BMNP (247,100 ha)
BMNP (247,100 ha)
7.2.3 Option Values
Genetic resources
The collection of genetic resources from BMNP has potential but is currently not practiced. It
is allowed under the current General Management Plan, however further regulations and
guidelines need to be developed. In general the value of genetic resources in BMNP can be
considered substantive. Coffee is used as an example of outstanding genetic value in terms
of disease resistance and breeding stock for this analysis.
Sutcliffe (2009) has calculated the value of coffee per hectare of suitable montane forest (1,100 to 1,900 metres a. s. l.) to obtain a value of US$280/ha (ETB3,500/ha), based on
Hein and Gatzweiler (2006). The option value of the genetic gene pool for the entire Harenna forest is US$50.4 million per annum (ETB630 million), whilst for the part of
Harenna forest situated within BMNP, US$ 24.6 million per annum (ETB307.8 million), as
can be seen in Table 45.
Table 45: Genetic Resource Value of BMNP and Harenna Forest
SERVICE PROVIDED
SCALE OF ANALYSIS
NPV [US$ MILLION]
DISCOUNTED BY 10%
OVER 30 YEARS
Coffee gene pool of Harenna Total Harenna forest
Coffee gene pool of BMNP
BMNP Harenna forest
part of Harenna forest
7.2.4 Existence Values
Cultural, spiritual value
Informants indicated that some peaks, trees and waterfalls are valued by local communities
but that this importance is not documented and currently not realised. It was suggested that
culturally important sites should be identified and documented as they have a potential
value if properly documented. The cultural and spiritual values are not quantifiable due to an
absence of information.
Wilderness and iconic values
The BMNP is famous for its wilderness and iconic values in terms of several flagship species
(e.g. Ethiopian Wolf, Mountain Nyala), high terrain (containing the second highest peak of the country) and the second largest remaining forest in the country. Ongoing management
activities by park management are supported by NGOs (e.g. Ethiopian Wolf Conservation
Programme) to sustain these values. As additional management response, it was suggested
to increase the awareness on less-known species found in the park, such as the Bale Monkey
and African Wild Dogs and to market the bio-geographic link to Europe in terms of avifauna
to ornithologists.
The benefit of BMNP in terms of its iconic species is valued within the biodiversity valuation
above.
Knowledge and education
In terms of research, there are a few partnerships between local NGOs and Universities,
such as the Ethiopian Wolf Conservation Project and Oxford University. In terms of education, it was mentioned that BMNP as well as local NGOs are actively involved in
education and awareness programmes in local communities and schools. The area has been used as the basis for many research studies from national and international research
institutions and students. However, the value of knowledge and education is currently unknown.
7.2.5 Summary of Economic Values Table 46 summarises the economic values for Bale Mountains National Park and considers
who is benefiting from these values.
In general it is observed that the highest direct use values, mainly water and energy related,
accrue mainly to the national economy. The direct use values that accrue to the population
within and around the national park are relatively low in comparison. Therefore, it is argued
that the economic value of the national park is much higher with regards to the national
economy than the benefits realised at the local level. Hence, an investment into effective
protected areas management is not only supporting local economies (e.g. through tourism
and employment) but is of utmost importance for the sustainable development of the
country through the provision of ecosystem services that are vital for the agriculture, manufacturing as well as service sectors.
Livestock grazing is considered a major threat to biodiversity conservation in BMNP.
Considering the relatively low economic benefit, in comparison to other values, we argue
that it would be worthwhile to increase efforts, targeted specifically at reducing grazing
pressure, such as alternative livelihood programmes and the development of a sustainable
grazing management plan, which is acceptable to local communities and enforceable by park management. Incentive based resettlement programmes could be an option to reduce
grazing pressure in core conservation areas and fragile environments, such as the Harenna Escarpment and the Sanetti Plateau.
The indirect use and option values are very valuable to the national economy as well as the
global community at large. However, these high values are not as tangible because they are
usually hard to realize in monetary terms. Payments for ecosystem services (PES) are becoming more common around the globe and the concept is emerging rapidly. The
potentials in terms of carbon trading or integrated watershed management payments are relevant to explore further in the case of BMNP. Due to the very high theoretic values of
these services, there is a good potential to support park management costs as well as community development costs, as even a fractional payment of the total value would
generate considerable income to perform conservation management activities.
Table 46: Summary of Economic Values for BMNP
Livestock Grazing
Timber and NTFPs
Medicinal Plants
Water Provision for
Electricity Production
Irrigated Agricultural
dependent on water
provision from BMNP
Biodiversity BMNP
Soil Stabilisation
Genetic Resources
7.3 The Economic Value of Gambella National Park
The Gambella National Park (GNP) is situated in the Gambella Region encompassing
5,061km². The park represents the largest low-lying wetland in the country, including five
large rivers (the Baro, Akobo, Itang, Gilo and Alwero). It is one of the wettest and best-
watered areas in the country including the Gambella floodplain. Altitudes range from 1,000
metres in the eastern part of the park to 300 metres above sea level in the western part of
the park. Climatically, the area is characterized by two distinct seasons, the wet season (May to October) and the dry (November to April). Precipitation increases with altitude from
1,000mm at the most western point of the park to 1,700mm in the escarpment to the east.
Mean temperatures range from 13.1°C to 34.8°C with an annual mean of 27.6°C (EWNHS,
1996). The park is home to several key mammal species, such as the Nile Lechwe, White
Eared Kob, Elephant, Buffalo and Roan Antelope. Apart from a large number of waterbirds,
three threatened species are historically recorded, which are the Shoebilled Stork,
Blackwinged Pratincole and Basra Reed Warble. The general topography is flat, covered by
wet grasslands and swamps with grasses growing to three metres height.
The area is of regional importance because the Baro-Akobo rivers provide half of the flow of the White Nile at Malakal in the Sudan and one sixth of the flow of the main Nile at the
Aswan High Dam (Sutcliffe and Parks, 2001). The Baro-Akobo Basin covers approximately
76,103km² and comprises of the entire Gambella Regional State and parts of Oromiya,
Beneshangul-Gumuz (BS-G) and the Southern Peoples, Nations and Nationalities (SPNN)
Regional States.
The land-use cover of the Baro Akobo river basin in the Gambella Region is shown in Map 4 and Table 47.
Map 4: Land Cover of the Baro-Akobo River Basin
Table 47: Land Cover of the Gambella Region
Land use Cover
Coverage
Woodland 1,950,964
Shrubland /grassland
Swampy marshland
The number of people living in the National Park is unknown and the General Management
Plan o f2004 states the regional figure of 221,998 of which about 82% live in rural areas.
According to the last population census (CSA, 2007) the rural population living in the five
Woredas covering the park is 104,057 (compare to Table 48). Settlement is reported to
concentrate along riverbanks, roads and state farms, whilst woodland and wetland areas are relatively sparsely populated. The Gambella region has one of the lowest population
densities in the country.
Table 48: Total Population in Woredas in GNP
Unfortunately, there is very limited information available about Gambella National Park and
most information found is on regional level only. The national park covers about 20% of the
total land mass of Gambella Regional State.
Figure 7: Fisherman in Gambella National
Park A fisherman drying his catch
7.3.1 Direct Use Values
Employment
The park is currently providing minor employment opportunities to 17 park management staff and no opportunities to rural communities. However, it can be assumed that
employment levels will increase if the park is being managed (e.g. currently there are two scouts employed, whilst a park this size would require about 70). The salaries of current
staff amount to ETB240,874 or US$19,285, see Table 49.
Table 49: Employment Value of GNP
SERVICE PROVIDED
SCALE OF ANALYSIS
NET VALUE
[MILLION US$/ANNUM]
Aggregate salaries of current
Unlicensed hunting
Hunting is not allowed in the national park but is commonly practiced and seen as of major
importance to the subsistence of local communities residing in the park. Informants stated
that meat is also available at local markets and hence also traded. It was indicated that bushmeat was hunted during all seasons but peaks significantly in the dry season when the
White Eared Kob migrates into Ethiopia from the Sudan (February to April). Rural communities living in and around the park hunt various species all year round, whilst during
the seasonal presence of the White Eared Kob also people from town are participating in
hunting. Rifles are readily available in the region due to the long lasting conflict in Sudan.
Since all hunting in the area is unlicensed, there is no data available on the extent of this
activity. However, considering a population of up to 800,000 Kob and estimating a very
conservative poaching level of 1%, results in 8,000 Kob killed per annum. Assuming an average dressed carcass weight of 60kg per animal, this results in 480,000kg of meat,
valued at US$720,000 (at US$1.5/kg) (ETB9 million). It is assumed that species hunted
throughout the year add an additional 10% in value, resulting in a total value of
US$792,000 (ETB9.9 million).
Table 50: Unlicensed Hunting Value of GNP
SERVICE PROVIDED
SCALE OF ANALYSIS
NET VALUE
[MILLION US$/ANNUM]
Bushmeat Estimated
off take of White
Eared Kob migration
The White Eared Kob as well as other species found in and around the park (e.g. Nile
Lechwe, Buffalo, etc.) could be an immediate source of income for the protected area as well as resident communities. To estimate sustainable off-take levels is not realistic, given the
very rudimentary information on wildlife populations in the park. However, once population trends are known (after several dry and wet season censuses), quotas could be determined
and regulated. Considering the unique species within the area, the resource can be expected
to have a considerable potential for trophy hunting revenue as well as for community based off-take for meat.
Currently hunting in national parks is not legally possible under Ethiopian legislation,
however international practice has shown that hunting rights can be used as an incentive for
communities to participate in the management of protected areas. Two Controlled Hunting
Areas, bordering the national park are currently not functional but could be used for
sustainable hunting, to serve community needs as well as trophy hunting. This would reduce
pressure on the national park as well as create an immediate income to communities and
the national park administration. Although hunting is not legally allowed in Gambella national park it is assumed that
bushmeat plays an important role in many rural livelihood strategies, especially in times of
seasonal nutritional shortages.
Wild food
Wild food plants, such as roots, bark and wild rice are of benefit in terms of subsistence. The
extent of usage of this resource has yet to be established. Due to a lack of information, it is
not possible to give an estimate on the value of wild food resources.
Fish resources
Fishing is a major activity in the rivers, ponds and dams in the area both for subsistence
consumption and for markets, mainly in town. The General Management Plan acknowledges the importance of fishing in terms of subsistence economies, but there is very limited actual
information available.
The Baro-Akobo Basin Masterplan (SELKHOZPROMEXPORT, 1990) states that there are over
70 fish species recorded in the system, of which 42 are relevant in terms of consumption.
Production in 1990 was estimated to be around 213 tonnes (live weight) whilst the potential
harvest (without improvement) was estimated to be 275 tonnes. Assuming the consumable fish to be 75% of live weight, the quantity of marketable fish is 159,750kg, which amounts
to about US$127,800 or ETB 1.6 million (assuming a price of US$0.8/kg or ETB10/kg).
Table 51: Fish Resource Value of GNP
SERVICE PROVIDED
SCALE OF ANALYSIS
NET VALUE
[MILLION US$/ANNUM]
Fishing in Gambella Region
The same report points out the importance of the inundation of the floodplains as seasonal spawning areas for fish fauna found in the White Nile system (SELKHOZPROMEXPORT,
1990). This ecosystem service is undoubtedly important to downstream economies, however
cannot be valued due to a lack of information on the scale of the fishing industry in the
Agriculture
Agriculture is not legally permitted within the park but practiced. The main areas used for
agriculture is the eastern part of the park and along the riverbanks.
Riverbank cultivation is making use of soil moisture caused by the seasonal fluctuation of
water levels. Crops cultivated include cereals, beans, oil seed, vegetables, tubers and fruits,
mainly banana. According to the Central Statistical Agency (2009) the total area under
traditional cultivation in Gambella Region is 10,342 ha (2008 to 2009 cropping season)
which demonstrates the relatively low dependence of people on crop production. Hence, the value of subsistance crop production in GNP is negligible.
The Gambella Region has a great potential for crop production, however due to relatively low
population densities, there is relatively little cultivated land. There are some commercial
farms, including state farms that are cultivating cotton, maize and coffee on a commercial
scale. According to the Ethiopian Central Statistical Agency (2009), only 32,000 hectares are
cultivated by subsistence farmers and 7,500 hectares by commercial farms.
The existing commercial farms are situated on the main carriage roads to Gambella town.
Some existing State farms have been privatised in recent years and there is a general trend
to increase the area under cultivation and attract direct foreign investment to boost regional
Some infrastructure is already available, such as the Alwero dam with an irrigation capacity
of about 14,000 hectares, situated on the eastern boundary of the GNP.
According to an unpublished report by EWCA (2008), 437,500 hectares of woodland are made available for investments into commercial agriculture. In Abobo Woreda, the eastern
part of the park, 35,300 hectares are earmarked, of which 6,300 hectares are already
cultivated. Almost half of the investment site is inside GNP. The report further states that
more land, of unknown size, is earmarked for investment and that potential investors had
already been identified. However, most sites had not been developed at the time due to a
decision by the Gambella Regional Authorities to await the planned re-demarcation of the
national park. Whether there has been any land development since then cannot be established from the trip to GNP end of August 2009, however some activities could be
detected during the visit (i.e. a borehole-drilling rig was observed in action within the park). Developments were mainly observed along the Gambella-Abobo road and between the
southern bank of the Baro river and the Gambella-Itang road.
The impact of these proposed developments on the national park and wildlife movements will have to be established. The location of farms has to be planned carefully in order to
minimise human-wildlife conflicts from the beginning and minimise impacts on wildlife movements and habitat fragmentation due to fencing of large tracks of land.
The developments along the Baro river can be considered problematic, in terms of both
wildlife corridors and access to water as well as impacting on future tourism developments,
which would certainly depend on the river. The developments around the existing Alwero dam are less critical to the integrity of the national park, however impact of increased
deforestation levels and land clearing on soil erosion and increased sedimentation levels have to be investigated.
Whether there are any planned investment sites along the Gilo river on the southern and western boundaries of the park is unknown. These areas can however be considered as
critical to the integrity of the park in view of the seasonal migration routes of the White Eared Kob population and plans to establish a corridor to create a transboundary
conservation area between Ethiopia and the Sudan. Table 52 has been adapted from an unpublished EWCA report (2008) to demonstrate the magnitude of land earmarked for agricultural development in Gambella Region. It has to be
noted that this table is presented for the entire Region.
Table 52: Land earmarked for Development in GNP
WOREDA LAND
CULTIVATED
PLANNED FOR
DEVELOPMENT
According to the same source about half of the land planned is to be put into commercial
production in the short term. The potential area under the plough amounts to 218,900
hectares. If we assume maize as a proxy cash crop with an annual production of about 4
tonnes per hectare at a price of US$153 per tonne, the total potential production value is
US$134 million (ETB1.7 billion) whilst the current production value is US$2.2 million
(ETB27.5 million), as shown in Table 53.
Table 53: Potential and Current Commercial Agricultural Production in GNP
rrent Land
200,000 30,600,00
204,000 31,212,00
396,000 60,588,00
875,600 133,966,8
It has to be noted that this is the entire production value including all farm inputs. However, the calculation serves the argument that the opportunity costs of parts of the national park
in terms of commercial agriculture might be high. The Baro-Akobo Basin Masterplan (SELKHOZPROMEXPORT, 1990) reports that the region has a good agricultural potential but
that the soils in the centre of the national park are not suitable for agriculture. Hence, there
is need for an immediate assessment to determine which parts of the region should be
considered for sustainable agricultural development and which should be part of the national
park considering wildlife corridors as well as the linkage between the escarpment woodlands
and the lowland wetland areas.
Livestock grazing
In absence of data for livestock numbers in the park, the General Management Plan states
livestock numbers of cattle, sheep and goats of 349,600, 812,400 and 102,300 respectively
on regional level. However, these figures might be too high. Another report by the Central
Statistics Agency states lower livestock figures, as presented in Table 54 (CSA, 2008).
Hence, more information is needed to assess resource use within the region and especially
the national park. The grasslands within the national park are used for grazing by the agro-
pastoralist Nuer and Anuak on a seasonal basis.
Table 54: Estimated Livestock Numbers in Gambella Region
CATTLE SHEEP GOATS
78,700 5,582 17,766
Mezhenger 18,743
130,015 17,825 31,821
Gambella Region Livestock grazing is not legally allowed in the park but commonly practiced. Traditional
grazing from agro-pastoralists is not believed to have a detrimental impact on the park and
has been present as the main livelihood strategy of the Nuer people for a long time. A
typical Nuer family keeps 15 to 30 head of cattle and 7 to 8 head of sheep or goats
(SELKHOZPROMEXPORT, 1990).
The General Management Plan states that 88% of livestock in the region is kept in Akobo
and Jikawo woredas, both partly within the current boundaries of the park. Livestock
densities3 are reported to be 1 to 5 TLU/km². The Central Statistical Agency (2008)
estimates a total of 130,000 cattle and close to 50,000 sheep and goats in Gambella Region.
Of these, it is estimated, that about two thirds are grazing within the boundaries of GNP.
3 A Tropical Livestock Unit (TLU) represents the equivalent of 250kg live weight.
Water usage
Water availability for household consumption is of major importance to local communities.
Due to the absence of data we refer to a study by Koorsgard (2006) estimating the value of
water provision for domestic consumption in developing countries. According to these
estimates the value of water is estimated between US$25.3 million to US$202.4 million
(ETB316 million to 2.5 billion) in GNP (compare to Table 55).
Table 55: Water Provision Value of GNP
US$/HA/ MINIMUM NET MAXIMUM NET
PROVIDED
ANALYSIS
[MILLION
[MILLION
US$/ANNUM]
US$/ANNUM]
consumption in ha) 50-400
GNP The Akobo river provides an important transportation link between Gambella town and
Nasaret town in the Sudan. The river is navigable only in the wet season (June to
Medicinal plants
The use of medicinal plants is of importance to the majority of community residing within
the park due to absence of clinics and long distances to town. Traditionally, plants are not
uprooted when picking herbal remedies.
To estimate the value of medical plants in GNP we refer to a study by Sutcliffe (2009),
estimating a value of medicinal plants of US$3.52/ha/annum. This gives a total value for
medicinal plants in Gambella National Park of US$ 1.8 million (ETB22.5 million) (see Table
Table 56: Medicinal Plant Value of GNP
NET VALUE
PROVIDED
ANALYSIS
[MILLION
US$/ANNUM]
Medicinal plants in GNP (506,100 ha)
GNP
Timber, fuel wood and non-timber forest products
Timber removal from the national park is of minor importance to local communities.
Deforestation is a concern mainly in the northeastern corner of the park due to the demand
for fuelwood by Gambella town. Traditionally only deadwood was collected as firewood and
this custom is still practiced by the communities living in the park.
The collection of NTFPs (i.e. honey, acacia gum) was stated to be of minor importance to local communities.
Although the majority of the park area comprises grassland and floodplains there are
considerable woodland and forested areas at the eastern boundary of the park and the region at large. Sutcliffe (2009) reports increasing rates of deforestation in these forests and
points out their importance due to Baro-Akobo providing half of the flow of the White Nile at
Malakal and one sixth of the water contained in the Aswan dam.
Recreation and tourism
Tourism is currently virtually absent due to a lack of facilities in the park and Gambella
town, however the park has a good potential to attract tourists in the future. Ethiopian
Airways is servicing Gambella Town twice to three times a week, which puts GNP into reach
of Addis Ababa within little more than an hours flight. The Baro river offers a scenic setting,
providing for a wildlife, birding and sport fishing experience as well as a unique cultural
experience. The ongoing roadwork will soon improve access for self-drive tourists as well as
ease logistics for tourism operators.
At the moment, neither the private sector nor communities are engaged in any tourism
activities and there are no facilities suitable to experience the national park.
7.3.2 Indirect Use Values
Climate change mitigation
The value of the national park in terms of carbon sequestration and local climate
amelioration is thought to have a considerable value. Based on woody biomass stock data,
the total CO2 stock contained below and above ground in Gambella National Park is 24.4
million tonnes, as shown in Table 57 (WBISPP, 2005). We assume an average market value
per tonne of CO2 of US$4 per tonne on the voluntary market as a conservative figure,
resulting in a total value of US$54 million. If we assume an approximate deforestation rate
around 2% per annum, as suggested by the Wood Biomass Inventory (WBISPP, 2005),
forest resources will be lost within a period of 50 years. Hence, the value of carbon stored in
GNP is estimated to be about US$2.0 million per annum (ETB22.5 million) or US$3.9 per
hectare per annum (ETB44.5).
Table 57: Carbon Stock and Value in GNP
Total Carbon
Total CO2
Total Value
NET VALUE
[MILLION
US$/ANNUM]
emissions
per annum
[US$ million]
3,685,881 24,438,385 97,753,540
Water Regulation, Watershed and Soil stabilisation
Local informants expressed that soil stabilisation is not a major function of the national park
which consists of grassland and wetland areas. However, deforestation rates in the woodland
areas outside the park are contributing to increased sedimentation levels in the rivers
flowing to the Sudan. Overgrazing is thought to cause some soil degradation.
Sutcliffe (2009) estimates the production loss due to sedimentation caused by deforestation
in the Baro-Akobo basin in hydroelectric and irrigation dams in Sudan and Egypt at a Net
Present Value of US$10.5 million or ETB131 million (discounted at 10% over 20 years). Refering to Koorsgard (2006) GNP has a water regulation value of US$31.4 million to
US$1.7 billion per annum (ETB316 million to 2.5 billion) (see Table 58).
Table 58: Watershed Regulating Services of GNP
MINIMUM NET MAXIMUM NET
PROVIDED
ANALYSIS
[MILLION
[MILLION
US$/ANNUM]
US$/ANNUM]
Flood mitigation 2-1,700
However, this analysis does not take into account the services provided by the whole river
basin, which includes the entire Gambella as well as parts of Oromia, Benishangul-Gumuz
(BS-G) and the Southern Peoples, Nations and Nationalities (SPNN) Regional States. The
total basin is estimated to be 7,610,300 hectares (Sutcliffe, 2009), which is more than 15
times the size of the national park.
Biodiversity
The biodiversity value of the Gambella National Park is of unique value for Ethiopia as the
only low-lying wetland area in the country and is the main reason for the creation of the
park. Both the Bureau of Agriculture and park management are managing the area and are
engaged with organising fire management committees. There are no specific studies
available valuing biodiversity in the area.
Based on a study by Koorsgard (2006), the total value of biodiversity in GNP is estimated to be US$0.5 to 15.2 million (ETB6.25 to 190 million), as shown in Table 59.
Table 59: Biodiversity Value of GNP
SERVICE PROVIDED
SCALE OF ANALYSIS
NET VALUE
[MILLION US$/ANNUM]
GNP (506,100 ha)
7.3.4 Summary of Economic Values Table 60 summarises the economic values for Gambella National Park and also considers
who is benefiting from these values.
Similarly to Bale Mountains National Park it is observed that the highest values are
associated with ecosystem services and accrue mainly to the national economy. Some direct
use values, such as employment and tourism, are currently low but have considerable
potential once the park is fully established, including the infrastructure required. Considering
the air link between Gambella and Addis Ababa, as well as the current road works, there is
good potential to develop a tourism product, based on birding, sport fishing and the wildlife
Unlicensed hunting is commonly practiced and generates a considerable value to the region.
Due to data gaps, it is impossible to determine the impact on wildlife populations and
recommend sustainable off-take levels. However, considering the estimated population size
of white eared kob (up to 800,000), sustainable utilisation of the resource is feasible and
recommended. Additional to protein supply, trophy hunting could generate a premium
income for part of the quota. A community-managed quota would generate immediate
income to communities and could be used as an incentive to abide by agreed upon resource use rules, articulated in a General Management Plan.
Livestock grazing is an integral component of most livelihood strategies of people living
within or close to the park, although the current value of livestock grazing cannot be valued
due to insufficient data. The impact of grazing on the ecosystem is unknown but is expected
to be of minor concern at present, yet may become an issue in the future with increasing
population growth rates. Commercial agriculture has considerable potential in the region, including parts of the current national park. Considering the estimated production values, the opportunity costs of
biodiversity conservation within the current park boundaries is considerable. Therefore, as already pursued by EWCA, it is necessary to re-demarcate the park with the aim of
effectively conserving a critical mass of vegetation classes, especially the wetland area,
which is not suitable for cropping. The process will require information and data on the park and surrounding areas. Some of the activities necessary, such as a wildlife census, are
already in the pipeline through the Horn of Africa Regional Environment Centre and Network programme.
Table 60: Summary of Economic Values for GNP
Analysis
Timber and NTFPs GNP
n. v. … not valued
Figure 8: Bushfires in Gambella National Park
SECTION 8: MOVING TOWARDS EFFECTIVE
MANAGEMENT
8.1 Strengths, Weaknesses, Opportunities and Threats
Analysis
In Section 6 the financial scenarios were developed, which presented the case for increased
funding. This section considers the underlying Strengths, Weaknesses, Opportunities and
Threats (SWOT) analysis of EWCA management and the changes necessary to more fully implement and advance the UNDP Scorecard and move towards best practice management.
Strengths
Two principal strengths emerge from the analysis of the PA system when considered in the
context of sustainable financing. The first of these is considered to be the desire of the government and donors to jointly find solutions to the problems of under-financing.
Governments, the NGOs and local communities have a history of working to achieve conservation outcomes in Ethiopia and this is a visible feature of PA management.
The second is the relative abundance of wildlife in the PAs, enabling sustainable utilisation
and income to be generated for tourist operators, the PAs and local people engaged in these
activities. These strengths provide a sound foundation for the future of the PA system.
Weaknesses
As already noted the major weakness in the PA system is the current lack of available
finance to properly develop and manage the PA system within the existing framework.
Other weaknesses, which are mostly institutional, include the following:
The application of short-term financial planning leading to inability to apply business-
planning principles.
Inability of EWCA to utilise revenue earned leading to lack of motivation and
reliance on other funding sources
Lack of understanding by staff of EWCA on accounting and financing procedures leading
to inefficiencies and lack of confidence to apply the provisions.
EWCA's low funding base, which provides little opportunity to initiate management
In addition there are the overarching issues of lack of PA planning, the lack of system wide
policies and standards and the capacity to meaningfully delegate management responsibilities to staff on site.
Opportunities
The major opportunities available to increase revenue lie with adjusting fees and charges to
reflect market rates and encouraging additional tourism through investment in facilities and
higher standards of service, the latter both at the park management level as well as with
private sector tourism operators.
The federal position of EWCA gives an opportunity for more harmonised approaches, better
marketing and fund raising in one competence centre.
Additionally, there is an opportunity to increase revenues through untapped niches of the
trophy hunting market. Examples include packaged hunting/tourism tours, more closely
matching hunting levels to sustainable wildlife populations so as to increase the number of
permits on offer and exclusive rights agreements with safari operators covering the more
popular hunting areas.
A major opportunity to increase investment levels into the Ethiopian PA system is the
opportunity to establish a Trust Fund. This initiative was proposed during the development
stage of the SDPASE project. An opportunity exists through legislative provisions, which
allow for cost reductions through public private partnerships to manage national PAs at their
own cost under the regulation of EWCA.
Although no charges are currently made for ecosystem services such as water and non-
timber forest products, the feasibility to earn revenue should be closely examined as it also
represents an income opportunity.
Finally the emerging carbon markets may bring additional finance for PA management through the REDD mechanism.
The overwhelming threat to the PA system is continued under-investment in management,
leading to continuing encroachment and damage from overgrazing and land cover conversion. Associated with this threat is the lack of alternative livelihoods available to local
communities living in and around the PAs, who are currently dependent on the resources of the PA for food, water, energy and housing materials together with pastures for their
The boundaries of many PA are contested and national parks such as Awash are severely
threatened by the invasion of an increasing number of herders with an ever increasing number of livestock.
The unprecedented effort of the government authorities to attract private investment in
Ethiopia is threatening the existence of certain national parks. For example, as in the case of Gambella National Park agribusiness developments within the park boundary are threatening
the integrity of the park, whilst the park could represent one of the cornerstones of the
national PA system.
8.2 IUCN Suggested Management Framework for PAs
To provide a form of guidance in relation to the way PAs might be managed in the future,
IUCN has provided a summary table which itemises actions that might be considered. The
table is provided below and represents a broad framework against which the barriers to effective management can be viewed.
Table 61: IUCN Suggested Management Framework
As it was: protected areas
As it is becoming: protected areas
were
are
Objectives
Set aside for conservation
Run also with social and economic
Established mainly for
spectacular wildlife and
Often set up for scientific, economic
scenic protection
and cultural reasons
Managed mainly for
Managed with local people in mind
visitors and tourists
Valued for the cultural importance of
Valued as wilderness
so-called "wilderness"
About protection
Also about restoration and
Governance
Run by central government Run by many partners
Local people
Planned and managed
Run with, for, and in some cases, by
Managed without regard to
Managed to meet the needs of local
Wider context Developed separately
Planned as part of national, regional
Managed as ‘islands'
and international systems
Developed as ‘networks' (strictly
protected areas, buffered and linked
by green corridors)
Perceptions
Viewed primarily as a
Viewed also as a community asset
Viewed also as an international
Viewed only as a national
Management
Managed reactively within
Managed adaptively in long term
techniques
Managed in a technocratic
Managed with political considerations
Paid for by taxpayer
Paid for from many sources
Management
Managed by scientists and
Managed by multi-skilled individuals
natural resource experts
Drawing on local knowledge
8.3 The Way Ahead - Recommended Actions
This section deals with the way ahead for achieving a functioning management system
funded from government, resource users and donors. The objective is defined as follows:
Objective: To move towards the achievement of functional system of protected areas for
the protection of wildlife and the natural habitat by 2014 with funding provided
by the Government of Ethiopia, park and wildlife users and donors.
8.3.1 Securing Government Funding Government budgets in most countries represent the principle source of funding for PAs. The
Ethiopian Government has committed itself to the development and maintenance of a
protected area system with a long-term aim of conserving appropriate areas for wildlife populations.
This commitment represents a public service undertaking in the same way that governments
fund health, education and other public services. The amount of funding directed to
protected areas is generally a matter for budgeting in the whole government context. The
power of governments to raise taxes can be used in a variety of ways to raise funds for
There are a number of advantages in using the tax structure to generate income for
conservation and PAs;
Financial resources are generated nationally, reliably and sustainable The burden of payment can be targeted towards users of the protected areas e.g.
hunters, exporters, tourists or recreational users
Finances generated can be applied to PA needs generally, since there is no need to
account to a specific donor
There is generally no need to set up a separate collection system
Ethiopia's regime of fees and charges covers a wide variety of services and is generally
considered appropriate in its scope. A new level of charges were introduced in 2009,
however further increases may be appropriate in certain PAs, where the value of the
experience is high, for example in BMNP and the world heritage site of Simien Mountains NP.
Advice to the consultant that visitors would be willing to pay up to 3 or 4 times the current
charge should be further examined and if found credible a review of charging levels made. A
review of hunting charges is being conducted by the Frankfurt Zoological Society and this
could provide a useful insight in the first instance. It is not considered appropriate to tax foreign visitors to Ethiopia beyond the current level of
charges for entry visas and hotel tax to help pay for the conservation of protected areas. At
this time, very few visitors actually visit PAs and the necessary connection between the
charges made and the benefit obtained is only barely made.
In the situation of Ethiopia however, the allocation of government budget funding is assessed as meeting only some 20-25% of needs, when operational and development costs
are taken into account. Furthermore, no long-term commitment has been given to guaranteeing funding at even the current level.
Suggested Approach
To the extent that can be negotiated within the Ministry for Culture and Tourism and in
accordance with any decision of the Minister, an approach is recommended which explores,
with the Department of Finance and Economic Development, means of placing PAs on a stable financial footing. The approach should be explored from two directions. Firstly, the
willingness of government to include PA funding to enable specific programmes, included in
the various relevant national strategies such as the Convention on Biological Diversity to be implemented. Secondly, in relation to recurrent funding and PA development, to identify
those mechanisms which government would accept as indicators of true need. This may include management or business plans or evaluations, involving management effectiveness
audits. The outcome desired is the recognition by Government of the financial needs of PAs and willingness to meet those needs on a long-term basis.
It is further suggested that the current EWCA regime of charging be maintained in its scope.
Further that the potential for increasing the level of income being earned be evaluated by
application of a willingness to pay survey, particularly for international tourists visiting PAs with unique natural habitats and capable of offering high levels of visitor satisfaction. Results
from the hunting charges survey now being undertaken by FZS could be applied as part of the proposed evaluation. Furthermore, the SDPASE project is preparing a policy paper on
sustainable hunting, including sections on management and licensing.
8.3.2 Revenue Retention Scheme The legislation providing for the establishment of EWCA includes a provision for the Director
General to operate a bank account. However, overlapping government policy requires that
all revenue earned by EWCA to be paid into the central treasury. This has the undesirable result of reducing the motivation of staff to either take the initiative to earn revenue for
EWCA or to work more efficiently in the use of funds. In addition any uncommitted or unspent monies at the end of the financial year would normally be resumed by the Treasury
and not considered as part of the next years EWCA budget.
The practice followed in many other countries is for PA agencies that earn revenue to have a
measure of flexibility in terms of utilizing earned revenue and to give them an incentive to benefit from improved management efficiencies and cost savings. There are a number of
ways that this can be formulated to give effect to the underlying principle and still remain with in the ambit of government policy.
Similar arrangements are in place in Ethiopia. For example, the Oromia Forest and Wildlife
Enterprise can retain its revenues in its own Forest Fund.
Suggested Action
That the Director General develops arguments, in consultation with central agencies for
EWCA to retain earned income and that Ministerial support be obtained to make a case to
Government to give effect to this reform. In order to give effect to the changes legislative amendment might be needed, including placing EWCA on a parastatal legal basis.
8.3.3 Donor Programmes Funding through international donors and the Global Environment Facility has underpinned
the development of PAs in Ethiopia in recent years. It has seen the development of several
new national parks and the provision of infrastructure in and around PAs. In addition, these
funding sources have also assisted with the employment of staff within the PAs for specific
Donations by private individuals are a feature of funding in many protected areas worldwide
and can be an important source of revenue under the right conditions. However, there are
many competing organisations for public donations in Ethiopia and without proper planning
and effort, it is unlikely that a programme aimed at eliciting public donations via simply a
donation box or public appeal would be successful. Clearly, the situation in Ethiopia needs to be properly understood, and the opportunities
evaluated. However, taking into account the relatively low levels of income in Ethiopia and
the low profile of protected areas generally, it is not expected that an appeal for public
donations would be successful at this time.
To the extent possible, it is proposed that every measure be taken to ensure a continuation of the donor programme and to obtain funding form sources such as the Global Environment
Facility. Donors have shown, and continue to demonstrate, a willingness to assist in funding PAs, particularly if they provide benefits for the local population and this should be fostered
to the full extent possible. However, it will be essential for EWCA and the Government of
Ethiopia generally to develop a coherent approach to attract further donor funding. Hence, it
becomes essential for EWCA to clearly establish its PA objectives and strategies in order to
place priority funding needs before donors, giving the best opportunity to succeed.
Suggested Approach
Working within EWCA, the Ministry and the Government as a whole, it is suggested that
those responsible for the donor programme develop a medium to long term PA strategy and action plan for application of donor funding with in the PA system. The strategy should be
based on achieving particular objectives and be prioritized to ensure that funding is directed
to the most important projects and needs, taking into account the donors broad aspirations for the way the money should be spent.
8.3.4 Trust Fund
Elsewhere in developing countries trust funds have proven to be a successful means of
attracting donor funding for use in PAs. It is likely that such a fund will be vital to meet the
financial needs of EWCA. The fund has the potential to provide supplementary support
additional to governmental resources. Particularly, as long as EWCA's funding levels remain
low and on a short term/annual basis. The integration of funding and a clear idea of how the
mechanisms will be applied will be an essential factor in developing the funding framework.
The SDPASE Project Document includes a provision for GEF funding of US$1 million to be
paid into a trust fund for PA conservation purposes. Certain conditions must be met in order
to secure the funding, but it is essentially provided as ‘seed money' to attract additional
funding from other donors, NGOs or private foundations.
At the time of this report, the overarching strategy for managing the trust fund is being developed with a number of options available.
Suggested Approach
That the SDPASE project supports EWCA and the Government of Ethiopia as it establishes a
trust fund and seeks to meet the GEF conditions for allocation of the first cash instalment in
order to trigger successive initiatives/action by other cooperating partners.
8.3.5 Reducing the EWCA Barriers to Implementation The first and probably the most important step to reduce barriers system-wide is to develop a comprehensive training programme for managers at all levels covering the
governmental/EWCA system of accounts and budget procedures. Added to this is the need
to develop appropriate management guidelines, which include policies and defined standards of performance. Since EWCA is a relatively new organisation, most staff, not directly
involved with the finance system, have not had the background or experience in working with the accounting procedures and/or have not been involved in the preparation of
estimates leading to budget formulation. Acquisition of this basic knowledge will assist in the application of sustainable financing.
The short-term planning framework applied in EWCA makes it extremely difficult to justify
and apply business-planning principles, which may rely on longer-term horizons in order to
achieve the benefits. A number of these constraints come about as a result of government policies, which place financial planning with central agencies responsible for Ethiopia's
financial planning as a whole. Accordingly, EWCA management relies on short term planning and annual budgets rather than addressing its financial needs on a business like footing.
By reviewing the current processes it will be possible to assess the barriers to efficient
operation and take action accordingly.
Suggested Approach
To overcome the lack of skills and experience in dealing with PA budgeting, management
and business planning, it is recommended that an analysis of the current processes be
undertaken. Based on this, a comprehensive training programme for managers at all levels should be provided.
8.3.6 Local Communities, Employment and Funding
Local communities resident in the PAs have a tradition of utilising the natural resources to
maintain their livelihoods, be it in part or totally. While some residents have a long history of
residency in the PA, others use the PA seasonally or are newcomers looking for a place to
settle. Gambella national park for example has a large refugee population from the Sudan
while BMNP is home to some 20,000 households comprising both traditional and newly
arrived residents. As has occurred in the past, employment of local residents in park management duties
represents a means of enabling local people to earn an income and reduce the pressure on
the park resources. However, where large populations exist this is not enough to be meaningful, particularly where residents own livestock and use the PA for grazing.
Two broad initiatives are proposed for consideration. The proposals are aimed at reducing
the impact on resource use and should not be seen as complete solutions for the entire PA
system, as such decisions can only be taken at park management level.
Firstly, it is proposed that through legislative amendment local communities be offered the
opportunity under a permit system to harvest and sell commercially non-timber forest
products that can be sustainably grown and harvested in the PA. Herbs such as oregano grow naturally in BMNP and have a ready market in local towns. As
occurs elsewhere in many national parks, local residents may be given an entitlement to
collect and sell these products commercially. The same concept would apply to coffee and
honey and its associated products. Permission to sell these products on the market
commercially adds to the cash supply of residents to supplement income.
Bamboo and reed harvesting for sale have the effect of utilizing products with a ready
market and benefiting the income of residents. The commercialization of these products in
addition to complimentary action to reduce grazing pressure is seen as a means of
improving livelihoods while not further reducing the impact on the PA.
It is understood that implementation of the Small Grants Programme (SGP) is in the
pipeline. The programme was started in 1992 and embodies the very essence of sustainable
development. The programme channels financial and technical support directly to
community based organisations for activities that conserve and restore the environment
while at the same time enhance people's well-being and livelihoods.
The SGP supports activities in support of the GEF priorities - biodiversity conservation, abatement of climate change, protection of international waters, prevention of land
degradation and elimination of persistent organic pollutants.
Since its inception, the SGP has confronted very real challenges in working with communities
to reconcile global environmental priorities with local community needs - challenges that
have been met in different ways across the globe depending on particular economic,
cultural, political and environmental conditions. In the process, the SGP became "the people's GEF".
Suggested Approach
That local communities be offered the opportunity through legislative amendments and
bylaws to harvest and sell commercially non-timber forest products that can be sustainably
grown and harvested in a particular PA, and that efforts be made to extend the Small Grants
Programme into communities in and around PAs and support local communities and NGOs in making their applications.
8.3.7 Cost Sharing Opportunities There is no reason why the public sector should have a monopoly on managing PAs, their
facilities or services as well as bear all costs of PA management. The involvement of private sector institutions, including civic society organisations as well as communities in the
management of PAs is a recent development that aims at sharing responsibility as well as
the financial risk of a public undertaking. Public-private partnerships (PPP) are management partnerships between rural communities, public sector institutions and the private sector (for
profit and non-profit organisations). Public-Private Partnerships aim at financing, designing, implementing and operating public
sector facilities and services. Their key characteristics include:
Long-term (sometimes up to 30 years) service provisions;
Transfer of risk to the private sector; and
Different forms of long-term contracts drawn up between legal entities and public
PPPs refer to innovative methods used by the public sector to contract with the private
sector, who bring their ability to deliver projects on time and budget, while the public sector retains the responsibility to provide these services to the public in a way that benefits the
public and delivers economic development and an improvement in the quality of life. Under PPPs, accountability for delivery of the public service is retained by the public sector whereas
under privatisation, accountability moves across to the private sector. In a PPP there is no transfer of ownership and the public sector remains accountable.
Such arrangements include other entities taking on certain management responsibilities and activities in PAs. In Bonaire, Saba and the British Virgin Islands, for example, commercial
diver operators perform basic interpretive, information and surveillance functions on behalf of Marine Protected Area authorities. Similarly, Bunaken National Park in Indonesia depends
on in-kind support from the tourism sector, including monitoring key areas and providing training, rental dive gear and boat time to rangers, as well as through conducting patrolling,
search and rescue missions.
Business concessions are another means of transferring responsibility for the performance of
certain functions and services to the private sector. In South Africa many safari lodges and tourism operations within national parks are conducted on this basis.
Cost sharing mechanisms have great potential to improve financial sustainability. To date
this remains an under utilised opportunity to cover the costs of PA management. Most PAs
financing strategies focus on raising additional funds rather than looking at redistributing the
burden of costs to other entities. However, to be realistic the opportunities are likely to exist
only in those communities and with individuals who have the desire to assist and be part of the conservation effort. Where the attitude persists that it is the government's responsibility
to manage PAs, the perception needs to change before meaningful participation can be expected.
Such arrangements however, are not without risk and require formal agreements to be put
in place to minimise unforeseen consequences. Generally, it is of utmost importance that the
regulatory authority (i.e. EWCA) has a clear vision on the management objectives of a
particular PA and can invite private sector or civil society organisations to perform certain
functions on behalf of government. It must be stressed that EWCA must retain the regulatory function, as the responsibility for effective management of national PAs remains
with the public sector. Partner institutions, whether private or civil society organisations,
should perform clearly defined management activities on behalf of government and bear the
costs for the same. The recent experience with the African Parks Network, a South African
NGO also demonstrated that the devolving of management functions can only succeed if all parties to the agreement are clear of their respective responsibilities.
Public tendering, contracts, performance assessments and rate reviews are all part of the
process to ensure that services are properly maintained and that, where appropriate, a fair
share of revenue is earned by the PA. Hence, it is recommended that EWCA should define a
clear policy on cost sharing opportunities and the devolution of management functions to
partner institutions.
Suggested Approach
That a review be undertaken of the opportunities for implementing cost sharing and
business partnerships with a view to adopt this measure. Clear guidelines and strategies need to be developed in order to place EWCA in a position to successfully negotiate
partnership arrangements with financially potent institutions.
8.3.8 "Green" Marketing The harvesting, processing and sale of natural products often generates substantial income
profits and other benefits to users where the product has an association with a well known
PA. Specifically, there is a commercial advantage in many countries in selling products that
are "clean and green". In Ethiopia, bottled natural spring water is labelled as coming from a
national park and people are willing to buy this product at a premium because of its credentials. It is possible to add commercial benefit to a range of products that are sourced
from PAs or nearby in similar ways. Ethiopia, with a long history of being a coffee and bee
wax exporter of high quality products would be well placed to consider how best this could
be exploited and is recommended for assessment.
Suggested Approach
That the opportunities for "green" marketing be evaluated for a range of products sourced in
the locality of well known PAs. To assist in this task representatives of local communities and
the private sector as well as expert NGO would be invited to lend their support and provide product and marketing expertise.
8.3.9 Payment for Ecosystem Services While many PAs have been established because they provide important environmental services, these benefits are typically enjoyed by offsite producers and consumers at low or
zero cost. Payment for environmental services provides a mechanism for capturing at least a portion of the value of these services through levying fees on the products, industries or
consumers that use and benefit from them. Although in theory revenues could be earned from any of the broader ecological services
that are associated with PAs, in reality payments for environmental service schemes are
most well developed for water resources. Payments for hydrological services have been
applied in a wide range of cases and countries and range from transfers between public sector hydropower and water supply utilities to PA agencies to direct payments to
landholders from private and commercial water users.
Although still relatively new, payments for ecosystem services are an increasingly important source of PA finance. At the same time, they inject rigor into the notion of the question of
who are the suppliers and who are the beneficiaries with the answers going some way to determining financial equity in these situations.
Suggested Approach
Resolution of the issues raised by this approach require a similar treatment to that for Green
marketing and could be dealt with in the same way. However, the Terms of Reference are
likely to be somewhat different in that PES are usually considered at an ecosystem level
rather than a local level and involving different stakeholders. This would need to be reflected in the composition of the individuals and organisations approached to assist in the
evaluation process.
8.3.10 Carbon Sequestration Payments Healthy, intact forests store carbon taken from the atmosphere and thus play a unique role
in mitigating the harmful effects of climate change. Global deforestation accounts for nearly
20 percent of the annual emission of greenhouse gases. Wide-scale deforestation is fuelling
climate change and biodiversity loss, and is expected to greatly accelerate species
extinctions. Land-use based carbon offset projects that support both forest protection and
reforestation are designed to implement actions that simultaneously address global warming
and species extinctions. Investment in conservation of carbon has the potential to earn revenue for the state budget
in addition to the value created for the environment generally and to local communities.
Land-use based carbon offsets projects does not only restore degraded lands and protect
forests that would otherwise be destroyed, but also offset carbon dioxide emissions from
industrial activities, thereby reducing the impacts on climate change.
Conservation carbon projects generate cost effective carbon offsets which meet regulations
and regulations set forth under the Kyoto Protocol and the emerging voluntary offset market while diversifying portfolio risk for participating investors. Additionally, companies are able
to communicate positive action to address climate change with concerned consumers,
shareholders and employee holders, through clear, tangible examples. For the local
community, conservation carbon projects provide employment and transform land that has
been degraded. Similarly, tree plantations promote the idea of sustainability in land-use practices, thereby satisfying the needs of the community and promoting long-term
protection of the forest. In the case of PAs in Ethiopia, there is the opportunity to develop carbon projects and use the proceeds from the sale of the carbon credits for the financing of the protected areas.
Particularly in so-called "paper parks" which are subject to deforestation, reduced emissions
from deforestation and degradation (REDD) through more effective management is a potential activity. However, carbon credits from REDD projects are currently only tradable on
the voluntary market, and not yet eligible for the official UNFCCC compliance market. This situation is expected to change in the post-Kyoto period (i.e. 2013 onwards). In areas which
have not been covered with forests since 1990, there is also the possibility to carry out CDM Afforestation/Reforestation (A/R) projects. Within protected areas, the potential for CDM A/R
is usually limited for a number of reasons, including possibly negative impacts on
biodiversity, limited financial returns from planting indigenous trees etc.
There have been some activities related to REDD, for example FZS has conducted an assessment of carbon stocks in the Bale Mountains for climate change mitigation and Farm
Africa has supported the development of a carbon finance project in the Bale Mountain Eco-region. These projects still face a number of challenges, e.g. lack of institutional capacity,
relative high costs for project development including baseline and monitoring methodologies,
scientific uncertainty, leakage (displacement of activities to other areas), risk management,
monitoring capability, financial and economic feasibility and marketing of the carbon credits.
Suggested Approach
Based on the outcomes of the UNFCCC COP 15 negotiation in Copenhagen, make a fully-
fledged analysis of the carbon potential of the Ethiopian PA system and develop a
conservation carbon (REDD) and marketing strategy for Ethiopia's PAs.
SECTION 9: BIBLIOGRAPHY
Abdurahman, N. A. (2008) An analysis of socio-economic importance of Non-Timber Forest
Products for rural households: Case study from Bale Mountains National Park, Ethiopia.
Department of Forest and Landscape Faculty of life science, Copenhagen University. Copenhagen, Denmark.
Abdurrahman Wariwo (personal communication held on 23.08.2009) Bale Mountains
National Park Community Outreach Expert.
BMNP (2007) General Management Plan: 2007 to 2017. Bale Mountains National Park.
BoA (1999) Gambella Forestry Action Programme Volume I and Volume II. Gambella
National Regional State. Bureau of Agriculture. Addis Ababa, Ethiopia.
Borrini-Feyerabend, G.; Kothari, A. and Oviedo, G. (2004) Indigenous and Local
Communities and Protected Areas: Towards Equity and Enhanced Conservation. IUCN,
Gland, Switzerland and Cambridge, UK.
Central Statistical Agency (2008) Agricultural Sample Survey 2008/09 (2001 E.C.) Volume
II. Report On Livestock And Livestock Characteristics (Private Peasant Holdings).
Statistical Bulleting 446. Addis Ababa, Ethiopia.
Central Statistical Agency (2009) Agricultural Sample Survey 2008 / 2009 (2001 E.C.)
(September – December 2008) Volume I. Statistical Bulleting 446. Addis Ababa, Ethiopia.
Denich, M.; Gole, T. W.; Gatzweiler, F.; Balcha, G. and Vlek, P. L. G. (2008) CoCE -
Conservation and use of the wild populations of Coffea arabica in the montane
rainforests of Ethiopia. Biodiversity of Africa – Observation and Sustainable
Management for our Future. Spier, Stellenbosch, Republic of South Africa.
Dudley, N. and Stolton, S. (2008) The Protected Areas Benefits Assessment Tool; WWF
International, Gland, Switzerland.
EEPCO (2009) Ethiopian Electric Power Corporation: Facts in brief 2008. Corporate
Communication Process. Addis Ababa, Ethiopia.
EFAP (1994) Ethiopia Forestry Action Plan: Final Report, EFAP Secretariat, TGoE, Addis
Ababa, Ethiopia.
EOEARTH (2009) Water Profile of Ethiopia. [online] The Encyclopaedia of Earth: Content,
Credibility, Community. Available at:
Eniang, A. E. and Wondmagenge D. (2007) Revisiting the age-long African Civet farming in
Ethiopia against the backdrop of increasing animal welfare concerns: what strategies
for sustainable utilization and conservation? Walia No 25, 2006-2007, Journal of the
Ethiopian Wildlife and Natural History Society, Addis Ababa, Ethiopia.
ESTDP (2009) Sustainable Tourism Development Project RESETTLEMENT POLICY
FRAMEWORK: March 2009 Federal Ministry of Tourism and Culture. Addis Ababa. Ethiopia.
EWNHS (1996) Important Bird Areas of Ethiopia: A first Inventory. Ethiopian Wildlife and
Natural History Society. Addis Ababa. Ethiopia.
FAO (2001) Global Forest Resources Assessment 2000, Main Report, FAO Forestry Paper
140, Rome, Italy.
FAO (2007) The State of the World's Forests 2007, Food and Agriculture Organisation of the
United Nations, Rome, Italy.
FEWS (2006) Ethiopia Food Security Update March 2006. FEWS Net Ethiopia, Addis Ababa.
Flintan, F.; Chibsa, W.; Wako, D. and Ridgewell, A. (2008) Livestock and Livestock Systems
in the Bale Mountains Eco-Region. A report for the Bale Eco-Region Sustainable
Management Project, SOS Sahel Ethiopia and FARM Africa. Addis Ababa, Ethiopia.
GEF (2008) PDF B Project Document: Sustainable Development of the Protected Areas
System of Ethiopia (SDPASE). Global Environment Facility, Washington D.C., U.S.A.
Hathaway, T. (2008) What Cost Ethiopia's Dam Boom?: A look inside the Expansion of
Ethiopia's Energy Sector. International Rivers, people, Water, Life.
Korsgaard, L. (2006) Environmental Flows in Integrated Water Resources Management:
Linking Flows, Services and Values. Institute of Environment & Resources Technical
University of Denmark.
Nature (1997) The value of the World's Ecosystem Services and Natural Capital, VOL 387.
Mander, M. (2006) Marketing of Medicinal Plants in Ethiopia: A survey of the trade in
medical plants. Institute of Biodiversity. Conservation and Sustainable Use of Medicinal Plants Project, Addis Ababa, Ethiopia.
McKee, J. (2007) Ethiopia, Country Environment Profile, A Report prepared for the European
MoWR (2004) Wabi Shebele River Basin Integrated Development Master Plan Study Project.
Ministry of Water Resources. Federal Democratic Republic of Ethiopia.
MoWR (2007) Denale-Dawa River Basin Integrated Resources Development Master Plan
Study. Ministry of Water Resources. Federal Democratic Republic of Ethiopia.
Reusing, M. (1998) Monitoring of high forests in Ethiopia. Ministry of Agriculture. Addis
Ababa, Ethiopia.
Sutcliffe, J.V. and Parks, Y.P. (1999) The Hydrology of the Nile, IAHS Special Publication No.
5, Wallingford, United Kingdom.
Sutcliffe, P.J. (2009) The Extent and Economic Costs of Deforestation in South-West
Ethiopia: A Preliminary Analysis. NTFP-PFM South Western Ethiopia. University of
Huddersfield. Untied Kingdom.
TNC (2009) Nature's Value: Assessing Protected Areas Benefits: A quick guide to protected
area practitioners. The Nature Conservancy, United States of America.
UNCTAD (2001) Greenhouse Gas Market Perspectives. United Nations Foundation. New York
Watson, C. (2007) Direct Consumptive Use Valuation of Ecosystem Goods and Services in
the Bale Mountains Eco-Region, Ethiopia. Faculty of Natural Science, Centre on
Economic Policy, Imperial College London. United Kingdom.
Watson, C.; Zeleke, S. and Kinahan, A. (2008) Baseline Studies on Carbon Storage and its
Economic Potential in the Harenna Forest, Bale Mountains National Park Final Report.
Frankfurt Zoological Society, Bale Mountains Conservation Project. Ethiopia.
WBISPP (2005) A Strategic Plan for the Sustainable Development, Conservation and
Management of the Woody Biomass Resources: Main Report. Addis Ababa, Ethiopia.
Wood, A. (2006) Options for Payment of Biodiversity Services from Ethiopian Coffee Forests.
Non Timber Forest Products Research and Development Project in S-W Ethiopia.
Yesuf, M.; Mekonnen, A.; Kassie, M. and Pender, J. (2005) Cost of Land Degradation in
Ethiopia: A Critial Review of Past Studies. Environmental Economics Policy Forum in
Ethiopia. Addis Ababa, Ethiopia.
Source: http://www.ewca.gov.et/sites/default/files/VOLUME%20II%20Main%20Report_2.pdf
Red PARF Documento Técnico Nº 8 Red Panamericana de Armonización de la Reglamentación Farmacéutica Grupo de Trabajo en Bioequivalencia (BE) Marco para la Ejecución de los Requisitos de Equivalencia para los Productos Farmacéuticos Marco para la Ejecución de los Requisitos de Equivalencia para los Productos Farmacéuticos
Rev. Inst. Med. Trop. Sao Paulo53(1):39-44, January-February, 2011doi: 10.1590/S0036-46652011000100007 ANTEMORTEM DIAGNOSIS OF HUMAN RABIES IN A VETERINARIAN INFECTED WHEN HANDLING A HERBIVORE IN MINAS GERAIS, BRAZIL Mariana Gontijo de BRITO(1), Talita Leal CHAMONE(1), Fernando José da SILVA(2), Marcelo Yohito WADA(3), Alexandre Braga de MIRANDA(4),


